Meta-Analysis
. 2015 May;15(5):565-80.
doi: 10.1016/S1473-3099(14)71073-4. Epub 2015 Mar 3.

Population-level impact and herd effects following human papillomavirus vaccination programmes: a systematic review and meta-analysis

Affiliations
Meta-Analysis

Population-level impact and herd effects following human papillomavirus vaccination programmes: a systematic review and meta-analysis

Mélanie Drolet et al. Lancet Infect Dis. 2015 May.

Abstract

Background: Human papillomavirus (HPV) vaccination programmes were first implemented in several countries worldwide in 2007. We did a systematic review and meta-analysis to assess the population-level consequences and herd effects after female HPV vaccination programmes, to verify whether or not the high efficacy reported in randomised controlled clinical trials are materialising in real-world situations.

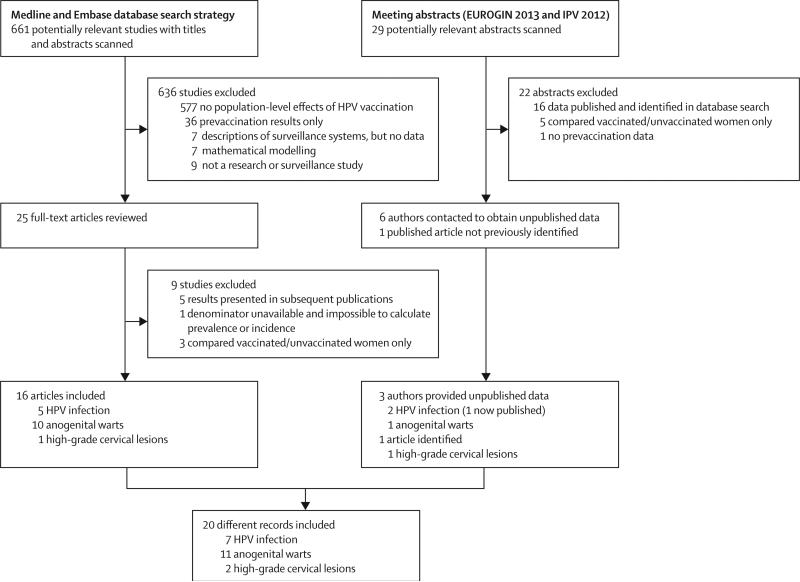
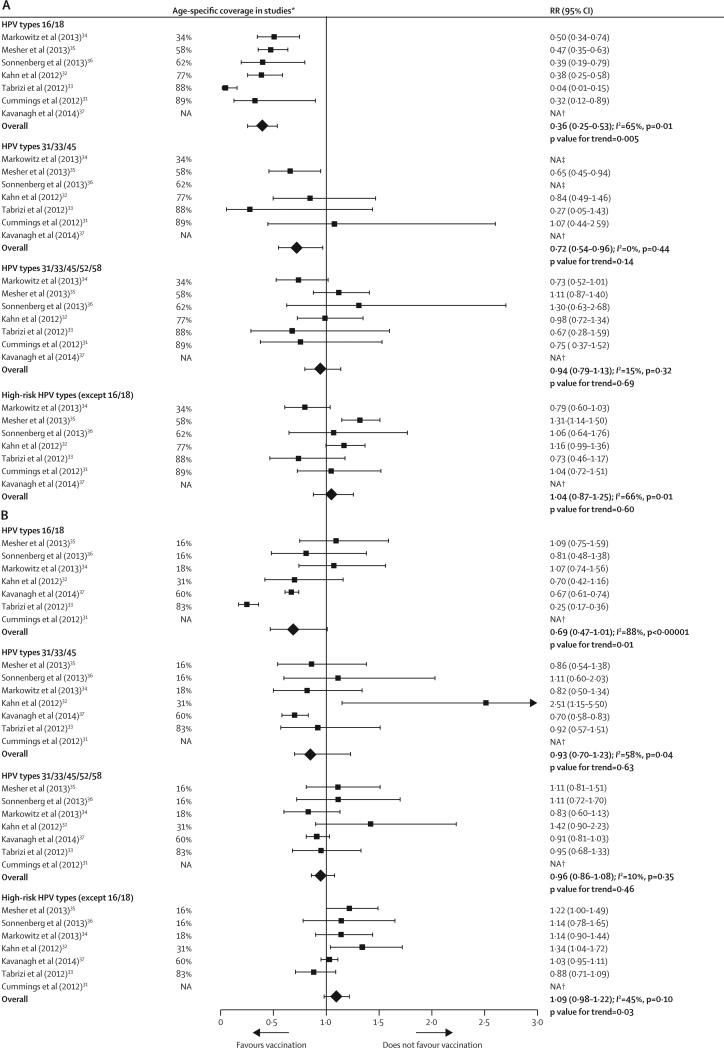
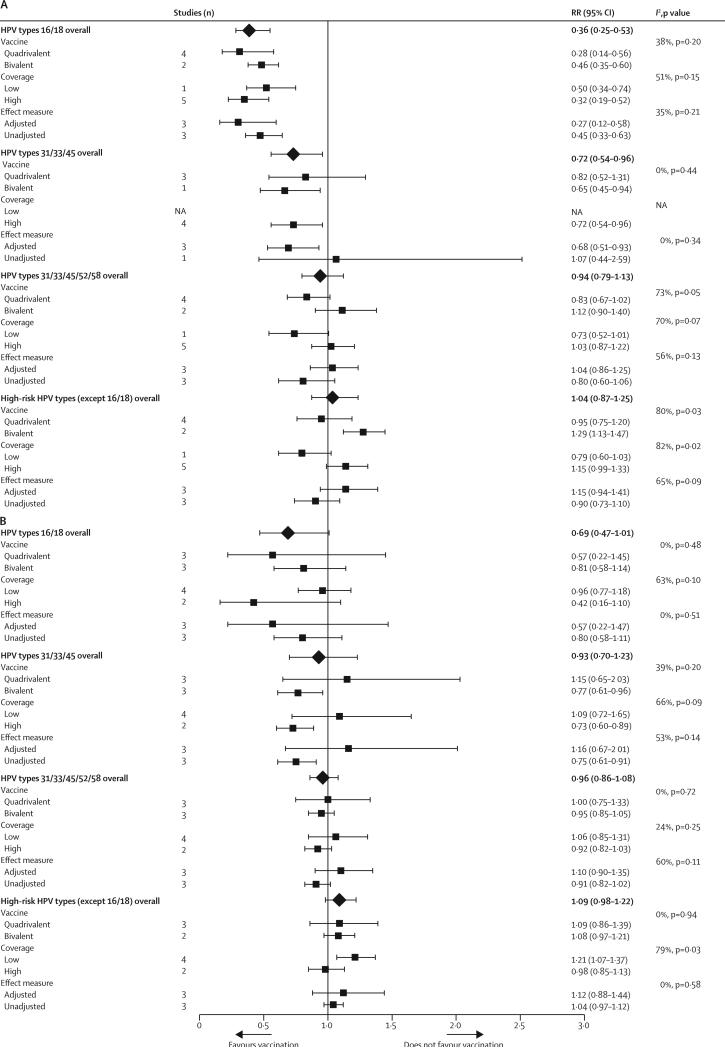
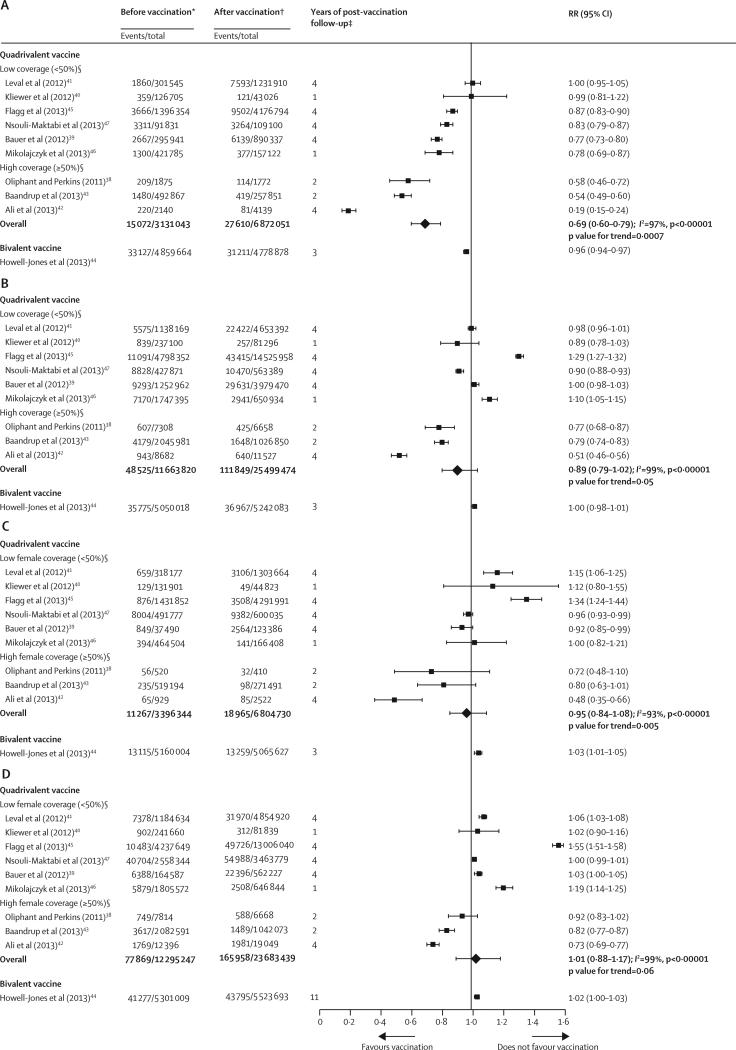
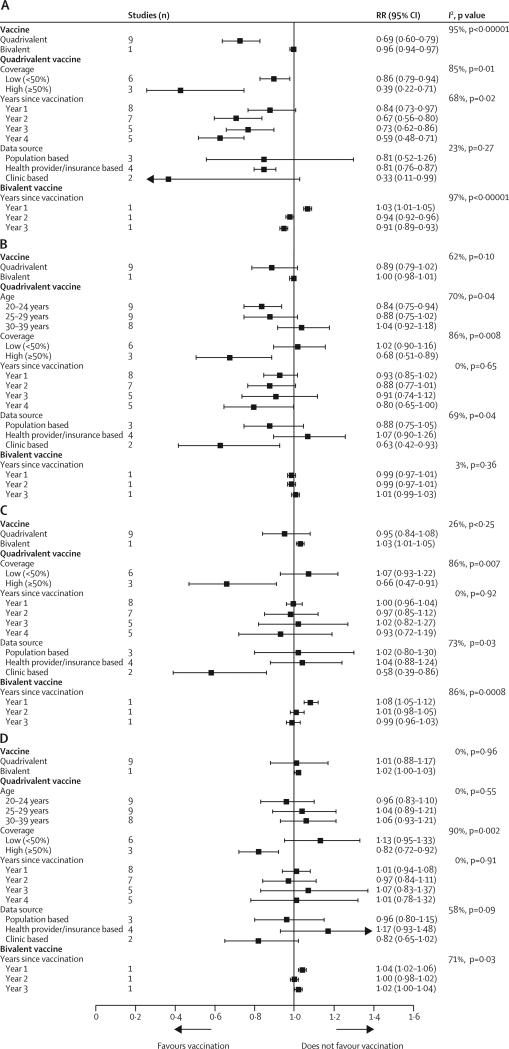
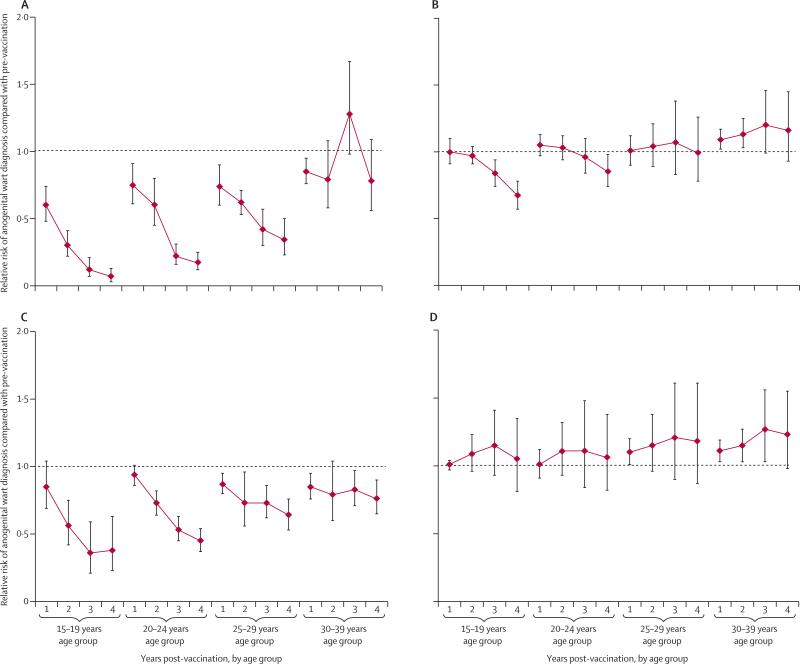
Methods: We searched the Medline and Embase databases (between Jan 1, 2007 and Feb 28, 2014) and conference abstracts for time-trend studies that analysed changes, between the pre-vaccination and post-vaccination periods, in the incidence or prevalence of at least one HPV-related endpoint: HPV infection, anogenital warts, and high-grade cervical lesions. We used random-effects models to derive pooled relative risk (RR) estimates. We stratified all analyses by age and sex. We did subgroup analyses by comparing studies according to vaccine type, vaccination coverage, and years since implementation of the vaccination programme. We assessed heterogeneity across studies using I(2) and χ(2) statistics and we did trends analysis to examine the dose-response association between HPV vaccination coverage and each study effect measure.

Findings: We identified 20 eligible studies, which were all undertaken in nine high-income countries and represent more than 140 million person-years of follow-up. In countries with female vaccination coverage of at least 50%, HPV type 16 and 18 infections decreased significantly between the pre-vaccination and post-vaccination periods by 68% (RR 0·32, 95% CI 0·19-0·52) and anogenital warts decreased significantly by 61% (0·39, 0·22-0·71) in girls 13-19 years of age. Significant reductions were also recorded in HPV types 31, 33, and 45 in this age group of girls (RR 0·72, 95% CI 0·54-0·96), which suggests cross-protection. Additionally, significant reductions in anogenital warts were also reported in boys younger than 20 years of age (0·66 [95% CI 0·47-0·91]) and in women 20-39 years of age (0·68 [95% CI 0·51-0·89]), which suggests herd effects. In countries with female vaccination coverage lower than 50%, significant reductions in HPV types 16 and 18 infection (RR 0·50, 95% CI 0·34-0·74]) and in anogenital warts (0·86 [95% CI 0·79-0·94]) occurred in girls younger than 20 years of age, with no indication of cross-protection or herd effects.

Interpretation: Our results are promising for the long-term population-level effects of HPV vaccination programmes. However, continued monitoring is essential to identify any signals of potential waning efficacy or type-replacement.

Funding: The Canadian Institutes of Health Research.


Figures

Figure 1
Figure 1
Study selection EUROGIN=EUropean Research Organisation on Genital Infection and Neoplasia. IPV=International Papillomavirus Conference. HPV=human papillomavirus.
Figure 2
Figure 2
Changes in the prevalence of HPV infections between the prevaccination and postvaccination periods in (A) girls aged 13–19 years and (B) women aged 20–24 years, ranked by age-specific vaccination coverage (≥1 dose) reported in studies RR=relative risk. HPV=human papillomavirus. NA=not available. p values for trends were obtained by fitting a linear regression between the log RR and the age-specific coverage of each study, weighted by the inverse variances of the log RR. The minimum age of participants varied between studies (see table 1). *Age-specific proportion of female participants, included in the analysis of each study, who received at least one dose of the HPV vaccine. †Data not available for girls aged 13–19 years in Kavanagh et al, and for women aged 20–24 years in Cummings et al. ‡Data not provided because they were judged potentially unreliable according to National Health and Nutrition Examination Survey analytic guidelines: prevalence estimates had a relative standard error of >30% and the sample size was below that recommended for analyses of complex survey data, by design effect and specified proportion. The only other data excluded were for HPV types 31/33/45 from NATSAL: unweighted prevaccination prevalence: 3/85; unweighted postvaccination prevalence: 16/215; weighted prevalence ratio 3·50 (95% CI 0·97–12·67)
Figure 3
Figure 3
Subgroup analyses of the changes in the prevalence of HPV infections between the prevaccination and postvaccination periods in (A) girls aged 13–19 years and (B) women aged 20–24 years RR=relative risk. HPV=human papillomavirus. NA=not available.
Figure 4
Figure 4
Changes in anogenital wart diagnosis between the pre-vaccination and post-vaccination periods in (A) girls aged 15–19 years, (B) women aged 20–39 years, (C) boys aged 15–19 years, and (D) men aged 20–39 years, ranked by the national or setting-specific female vaccination coverage RR=relative risk. p values for trends were obtained by fitting a linear regression between the log RR and the rank of vaccination coverage of each study, weighted by the inverse variances of the log RR. *Before vaccination: cumulative number of cases and person-years up to 3 years pre-vaccination, including the year of the introduction of the human papillomavirus (HPV) vaccine. †After vaccination: cumulative number of cases and person-years 1–4 years after the introduction of vaccination, depending on data available in each study. ‡Years of post-vaccination follow-up: number of years after the introduction of HPV vaccination considered in the meta-analysis (see appendix pp 10–11 for more details). §Studies were ranked qualitatively by the national or setting-specific vaccination coverage, for which we considered the number of cohorts vaccinated and vaccination coverage achieved in each cohort. However, we could not estimate the overall vaccination coverage for each study (see appendix pp 2–4 for details about the programme description, number of cohorts vaccinated, and three-dose vaccination coverage for each study).
Figure 5
Figure 5
Subgroup analyses of the changes in anogenital wart diagnosis between the pre-vaccination and post-vaccination periods in (A) girls aged 15–19 years, (B) women aged 20–39 years, (C) boys aged 15–19 years, and (D) men aged 20–39 years Data are for years with female-only vaccination programmes. RR=relative risk.
Figure 6
Figure 6
Changes in anogenital wart diagnosis during the first 4 years after the introduction of human papillomavirus vaccination with the quadrivalent vaccine Results are stratified by age and female vaccination coverage: (A) Girls and women, with high female vaccination coverage (≥50%); (B) girls and women, with low female vaccination coverage (<50%); (C) boys and men, with high female vaccination coverage (≥50%); (D) boys and men, with low female vaccination coverage (<50%). For high coverage, the results from the following studies were combined depending on the years of follow-up available: years 1 and 2: Oliphant and Perkins (2011), Baandrup et al (2013), and Ali et al (2013); years 3 and 4: Ali et al (2013). For low coverage, the results from the following studies were combined depending on the years of follow-up available: year 1: Leval et al (2013), Kliewer et al (2012), Flagg et al (2013), Nsouli-Maktabi et al (2013), and Mikolajczyk et al (2013); years 2, 3, and 4: Leval et al (2013), Flagg et al (2013), Nsouli-Maktabi et al (2013), and Bauer et al (2013). See appendix pp 2–4 for information about vaccination coverage in each study.

Comment in

References

    1. WHO . Countries with HPV vaccine in the national immunization programme and planned introductions. World Health Organization/IVB Database; Jan, 2014. [Sept 15, 2014]. http://www.who.int/immunization/diseases/hpv/decision_implementation/en/
    1. Cervical Cancer Action (CCA) Progress in cervical cancer prevention. [Sept 15, 2014];The CCA report card. 2012 Dec; http://www.cervicalcanceraction.org/pubs/CCA_reportcard_low-res.pdf.
    1. The World Bank [Sept 15, 2014];Countries and economies. 2006 http://data.worldbank.org/country.
    1. Ladner J, Besson MH, Rodrigues M, Audureau E, Saba J. Performance of 21 HPV vaccination programs implemented in low and middle-income countries, 2009–2013. BMC Public Health 2014. 14:670. - PMC - PubMed
    1. Munoz N, Bosch FX, de Sanjose S, et al. Epidemiologic classification of human papillomavirus types associated with cervical cancer. N Engl J Med. 2003;348:518–27. - PubMed

Publication types

MeSH terms

Substances