. 2015 Feb 15:14:39.
doi: 10.1186/s12943-015-0313-5.

Lysosomal protein turnover contributes to the acquisition of TGFβ-1 induced invasive properties of mammary cancer cells

Affiliations

Lysosomal protein turnover contributes to the acquisition of TGFβ-1 induced invasive properties of mammary cancer cells

Ursula Kern et al. Mol Cancer. .

Abstract

Background: Normal epithelial cells and carcinoma cells can acquire invasiveness by epithelial-to-mesenchymal transition (EMT), a process of considerable cellular remodeling. The endosomal/lysosomal compartment is a principal site of intracellular protein degradation. Lysosomal cathepsin proteases are secreted during cancer progression. The established pro-metastatic role of specific cysteine cathepsins has until now been ascribed to their contribution to extracellular matrix remodeling. We hypothesized that cysteine cathepsins affect transforming growth factor β-1 (TGFβ-1)-induced EMT of normal and malignant mammary epithelial cells.

Methods: The role of lysosomal proteolysis in TGFβ-1-induced EMT and invasion was investigated in a normal and a novel malignant murine mammary epithelial cell line. The contribution of cysteine cathepsins was determined by addition of the general cysteine cathepsin inhibitor E64d. Hallmarks of EMT were analyzed by molecular- and cell-biologic analyses including real-time cell migration/invasion assays. A quantitative proteome comparison using stable isotopic labeling with amino acids in culture (SILAC) showed the effect of E64d on TGFβ-1 induced proteome changes. Lysosomal patterning and junctional adhesion molecule A (Jam-a) localization and abundance were analyzed by immunofluorescence.

Results: We found increased lysosome activity during EMT of malignant mammary epithelial cells. Cysteine cathepsin inhibition had no effect on the induction of the TGFβ-1-induced EMT program on transcriptional level. Protease inhibition did not affect invasion of TGFβ-1 treated normal mammary epithelial cells, but reduced the invasion of murine breast cancer cells. Remarkably, reduced invasion was also evident if E64d was removed 24 h before the invasion assay in order to allow for recovery of cathepsin activity. Proteome analyses revealed a high abundance of lysosomal enzymes and lysosome-associated proteins in cancer cells treated with TGFβ-1 and E64d. An accumulation of those proteins and of lysosomal vesicles was further confirmed by independent methods. Interestingly, E64d caused lysosomal accumulation of Jam-a, a tight junction component facilitating epithelial cell-cell adhesion.

Conclusion: Our results demonstrate an important role of lysosomal proteolysis in cellular remodeling during EMT and a pivotal contribution of lysosomal cysteine cathepsins to TGFβ-1 induced acquisition of breast cancer cell invasiveness. These findings provide an additional rationale to use cathepsin inhibitors to stall tumor metastasis.


Figures

Figure 1
Figure 1
Increase of lysosomes and lysosomal protease activity during TGFβ-1 induced EMT in NMuMG cells and the MMTV-PyMT breast cancer cell line iPL32. (A) Representative phase contrast images show morphological changes after two and four days TGFβ-1 (2 ng/ml) treatment in NMuMG and iPL32 cells. (B,C) Western blot analysis of selected cathepsins in NMuMG (B) and iPL32 (C) whole cell lysates is shown with α-tubulin as loading control. NMuMG day 0 ( I ) and iPL32 day 0 ( II ) were used as positive controls. (D) Ctsl and Ctsb activity were measured by z-PheArg-AMC hydrolysis in presence or absence of Ca074 after four days of TGFβ-1 treatment in NMuMG and iPL32 cells, normalized to untreated (untr.) and are shown as the mean ± SEM (n = 3, *p ≤ 0.05 by one sample two tailed t test). (E) Abundance of acidic organelles of untreated and four days TGFβ-1 treated NMuMG and iPL32 cells were analyzed by quantitative LysoTrackerTM flow cytometry. The mean ± SEM is shown (n = 3, *p ≤ 0.05 by two tailed t-test on independent groups).
Figure 2
Figure 2
Inhibition of cysteine cathepsins during EMT impaired TGFβ-1 induced invasiveness of malignant cells. (A) Experimental setup: Cells were either untreated or treated with TGFβ-1 for four days in presence of E64d or solvent control (“ctrl”) for three days. At day three E64d was removed. At day 4 cells were trypsinized and directed migration or invasion through Cultrex®-coated membranes were analyzed for 24 h by RTCA real time trans-well assays in absence of E64d. (B) Cysteine cathepsin activity measured by z-Phe-Arg-AMC hydrolysis in NMuMG and iPL32 whole cell lysates after three days E64d treatment and one day E64d withdrawal. (C-F) Migration and Invasion of NMuMG (C,D) and iPL32 cells (E,F). Cell indexes as function of time for the triplicates of representative experiments (left panels); statistical analysis of independent experiments (right panels) calculated as the slope of cell index between the time points marked in the time-curves, normalized to “TGFβ-1 ctrl.”, shown as the mean ± SEM (n = 3 for NMuMG and n = 5 for iPL32 cells, *p ≤ 0.05, **p ≤ 0.01).
Figure 3
Figure 3
Inhibition of cysteine cathepsins during migration/invasion reduced invasion of TGFβ-1 transformed malignant cells. (A) Experimental setup: Cells were treated without or with TGFβ-1 for four days in the absence of E64d. At day four cells were incubated with E64d or solvent control (“ctrl.”) for one hour. Thereafter cells were trypsinized and migration and invasion were analyzed for 24 h by RTCA real time trans-well assays in presence of E64d. (B) Cysteine cathepsin activity measured as z-Phe-Arg-AMC hydrolysis in NMuMG and iPL32 whole cell lysates after 1 h E64d treatment. (C-F) Migration and invasion of (C,D) NMuMG and (E,F) iPL32 cells. Graphs show the cell indexes of triplicates of representative experiments (left panels); statistical analysis of independent experiments (right panels) calculated as the slope of cell index between the time points marked in the time-curves, normalized to “+TGFβ-1 ctrl.”, shown as the mean ± SEM (n = 3 for NMuMG and n = 5 for iPL32 cells, *p ≤ 0.05, **p ≤ 0.01).
Figure 4
Figure 4
Quantitative proteome comparison of untreated, TGFβ-1, and TGFβ 1 + E64d treated iPL32 cells. (A) Workflow: I: Metabolic stable isotopic labeling (SILAC) of untreated cells with light “L”, TGFβ-1 treated cells with medium “M”, and TGFβ-1 + E64d treated cells with heavy “H” amino acids. II: Cell lysis and protein preparation. III: Quantification and combination of samples. IV: Fractionation, protein cleavage by trypsin, and peptide preparation for LC MS/MS analysis. (B) Venn diagram showing the total number of proteins identified in each independent experiment and in both experiments. (C) Density plot showing the distribution of Fc values (log2) for the comparisons of the conditions untreated to TGFβ-1 as well as TGFβ-1 to TGFβ-1 + E64d in experiment 1. (D) Number of proteins altered in abundance in both experiments in the proteome comparison of untreated to TGFβ-1 treated cells as well as TGFβ-1 treated to TGFβ-1 + E64d treated cells. log2 Fc ≤ 0.58 = less abundant; log2 Fc ≥ 0.58 = more abundant. (E) KEGG (Kyoto Encyclopedia of Genes and Genomes) pathway enrichment analysis of proteins altered in abundance (log2 Fc ≤ or ≥ 0.58) in the quantitative proteome comparison of untreated to TGFβ-1 treated iPL32 cells. Functional pathways significantly enriched (with p ≤ 0.05; ≥ 6 proteins in pathway) in the KEGG analysis are shown.
Figure 5
Figure 5
Proteins more abundant upon cysteine cathepsin inhibition. The connectivity of all proteins more abundant (log2 Fc ≥ 0.58) in the quantitative proteome comparison of TGFβ-1 treated to TGFβ-1 + E64d treated iPL32 cells was determined with STRING (Search Tool for the Retrieval of interacting Genes/Proteins). The three clusters most significantly enriched: lysosome p = 2.3 x 10⁻¹², endosome p = 4.6 x 10⁻⁷, proteasome p = 4.2 x 10⁻¹², and Jam-a “f11r” are highlighted. Different line colors indicate the type of evidence for interaction.
Figure 6
Figure 6
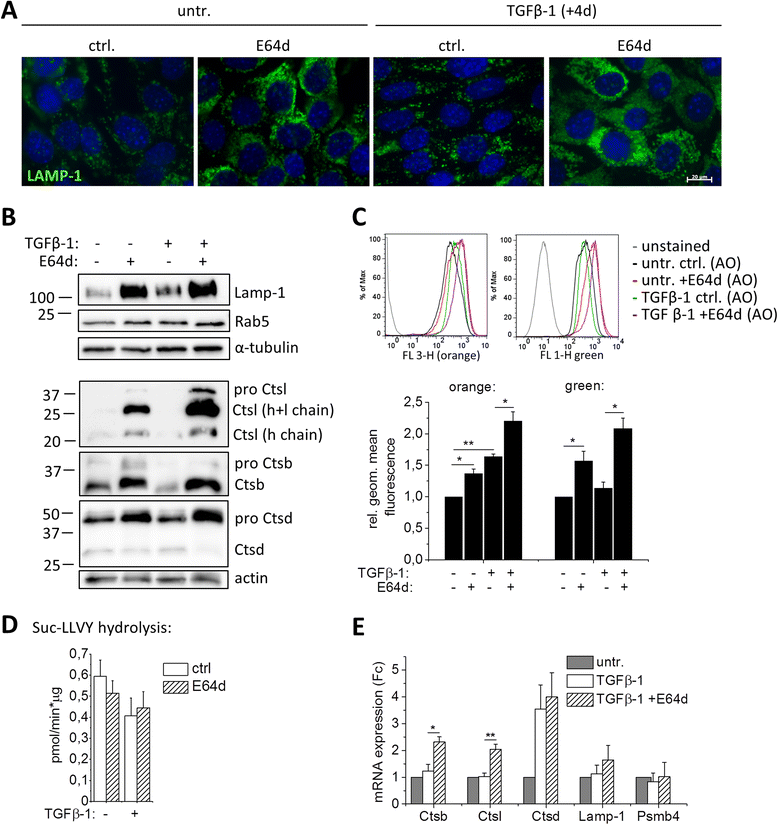
Accumulation of endosomal/lysosomal proteins and proteasomes upon cysteine cathepsin inhibition. (A) Representative Lamp-1 immunofluorescence images of untreated −/+E64d and four days TGFβ-1 −/+E64d treated iPL32 cells are shown (Lamp-1: green, Hoechst nuclear stain: blue). (B) Lamp-1, Rab5 Ctsl, Ctsb, and Ctsd protein levels were analyzed by Western blot with α-tubulin and actin as loading controls in whole cell lysates of untreated −/+E64d and four days TGFβ-1 −/+E64d treated iPL32 cells. Ctsl heavy (h) and light (l) chains indicate the fully processed mature protease. (C) Flow cytometry analysis of Acridine-Orange (AO) stained iPL32 cells pretreated with or without TGFβ-1 −/+E64d for four days: Representative histograms for FL-3 height (orange) and FL-1 height (green) are shown in the upper panel, statistical analysis of independent experiments in the lower panel. Geometric mean orange or green fluorescence was normalized to untreated control cells (n = 3, *p ≤ 0.05, **p ≤ 0.01). (D) Proteasome activity of untreated −/+E64d and four days TGFβ-1 −/+E64d treated iPL32 cells was measured by Suc-LLVY-AMC cleavage (n = 3). (E) Ctsb, Ctsl, Ctsd, Lamp-1, and proteasome subunit 4 “Psmb4” mRNA levels in untreated and four days TGFβ-1 −/+E64d treated iPL32 cells were analyzed by qRT-PCR. Starting quantity values were normalized to the untreated group. Data are shown as the mean ± SEM (n = 3, *p ≤ 0.05 **p ≤ 0.01 by two sample two sided t-test).
Figure 7
Figure 7
Jam-a expression and lysosomal Jam-a accumulation upon cysteine cathepsin inhibition. (A) Western Blot of Jam-a in whole cell lysates of untreated −/+E64d and four days TGFβ-1 −/+E64d treated iPL32 cells showed full length (FL) Jam-a and a 25 kDa Jam-a fragment (F1). (B) Jam-a transcription was analyzed by qRT-PCR in untreated and four days TGFβ-1 −/+E64d treated iPL32 cells. Starting quantity values were normalized to the untreated group and are shown as the mean ± SEM (n = 3). (C) Representative confocal images of FITC-Phalloidin (green) and Jam-a (red) immunofluorescence staining of untreated and four days TGFβ-1 −/+E64d treated iPL32 cells are shown. Images represent one confocal section at a medial position in the cells. (D) Representative images of optical sections of Jam-a/Lamp-1 immunofluorescence double-staining of four days TGFβ-1 −/+E64d treated iPL32 cells: Jam-a (red), Lamp-1 (green), and nuclei (blue) are shown. Dashed lines mark areas shown in higher magnification in the second, third, and fourth panels. Arrows denote Jam-a co-localization with Lamp-1 positive lysosomes. Arrowheads indicate Jam-a staining adjacent to Lamp-1 positive lysosomes. Scale bars = 10 μm.

References

    1. Kalluri R, Weinberg RA. The basics of epithelial-mesenchymal transition. J Clin Invest. 2009;119:1420–8. doi: 10.1172/JCI39104. - DOI - PMC - PubMed
    1. Heldin CH, Vanlandewijck M, Moustakas A. Regulation of EMT by TGFbeta in cancer. FEBS Lett. 2012;586:1959–70. doi: 10.1016/j.febslet.2012.02.037. - DOI - PubMed
    1. Thiery JP, Sleeman JP. Complex networks orchestrate epithelial-mesenchymal transitions. Nat Rev Mol Cell Biol. 2006;7:131–42. doi: 10.1038/nrm1835. - DOI - PubMed
    1. Di Guglielmo GM, Le Roy C, Goodfellow AF, Wrana JL. Distinct endocytic pathways regulate TGF-beta receptor signalling and turnover. Nat Cell Biol. 2003;5:410–21. doi: 10.1038/ncb975. - DOI - PubMed
    1. Saftig P, Klumperman J. Lysosome biogenesis and lysosomal membrane proteins: trafficking meets function. Nat Rev Mol Cell Biol. 2009;10:623–35. doi: 10.1038/nrm2745. - DOI - PubMed

Publication types