. 2015 Sep;26(9):2152-62.
doi: 10.1681/ASN.2014070642. Epub 2015 Mar 5.

Hyperphosphatemia, Phosphoprotein Phosphatases, and Microparticle Release in Vascular Endothelial Cells

Affiliations

Hyperphosphatemia, Phosphoprotein Phosphatases, and Microparticle Release in Vascular Endothelial Cells

Nima Abbasian et al. J Am Soc Nephrol. 2015 Sep.

Abstract

Hyperphosphatemia in patients with advanced CKD is thought to be an important contributor to cardiovascular risk, in part because of endothelial cell (EC) dysfunction induced by inorganic phosphate (Pi). Such patients also have an elevated circulating concentration of procoagulant endothelial microparticles (MPs), leading to a prothrombotic state, which may contribute to acute occlusive events. We hypothesized that hyperphosphatemia leads to MP formation from ECs through an elevation of intracellular Pi concentration, which directly inhibits phosphoprotein phosphatases, triggering a global increase in phosphorylation and cytoskeletal changes. In cultured human ECs (EAhy926), incubation with elevated extracellular Pi (2.5 mM) led to a rise in intracellular Pi concentration within 90 minutes. This was mediated by PiT1/slc20a1 Pi transporters and led to global accumulation of tyrosine- and serine/threonine-phosphorylated proteins, a marked increase in cellular Tropomyosin-3, plasma membrane blebbing, and release of 0.1- to 1-μm-diameter MPs. The effect of Pi was independent of oxidative stress or apoptosis. Similarly, global inhibition of phosphoprotein phosphatases with orthovanadate or fluoride yielded a global protein phosphorylation response and rapid release of MPs. The Pi-induced MPs expressed VE-cadherin and superficial phosphatidylserine, and in a thrombin generation assay, they displayed significantly more procoagulant activity than particles derived from cells incubated in medium with a physiologic level of Pi (1 mM). These data show a mechanism of Pi-induced cellular stress and signaling, which may be widely applicable in mammalian cells, and in ECs, it provides a novel pathologic link between hyperphosphatemia, generation of MPs, and thrombotic risk.

Keywords: CKD; cardiovascular disease; cell signaling; endothelial cells; hyperphosphatemia; microparticle.


Figures

Figure 1.
Figure 1.
Hyperphosphatemia acutely induces MP release from EAhy926 ECs. Acute release of MPs from EAhy926 ECs incubated for 90 minutes with control (1 mM) and high (2.5 mM) [Pi] medium. (A) Scanning electron micrographs showing MPs budding off the cell surface with (left panel) 1 mM Pi or (right panel) high phosphate milieu (2.5 mM Pi; right panel). Original magnification, ×4000. (B) Negatively stained transmission electron micrograph of the MP fraction (fraction 2 in Table 1) from the medium showing a Pi-derived MP of approximately 100–200 nm in diameter with an intact membrane. Original magnification, ×100,000. (C) NTA performed on uncentrifuged medium showing (left panel) particle concentration expressed as millions (E6) per milliliter and (right panel) average particle size. n=35. **P<0.01; ***P<0.001. (D) Flow cytometry data showing the number of particles (obtained after incubation of cells with medium for t=90 minutes at the specified Pi concentration) that were (left panel) dual labeled with anti–CD144-PE antibody and Annexin V-FITC and (right panel) labeled with Annexin V-FITC only. Using medium from a 75-cm2 culture flask, particles were prepared (fraction 2 in Table 1) and suspended in 500 μl MP-Buffer (145 mM NaCl, 2.7 mM KCL, and 10 mM Hepes, pH 7.4), and 38 μl suspension was subjected to FACS analysis as described in Concise Methods. n=3. *P<0.05 versus 1 mM Pi control. (E and F) Blunting of the Pi-induced MP release by loading the medium with (E) fructose or (F) the Pi analog PFA (an inhibitor of sodium-dependent PiT1/2 Pi transporters). n=3. *P<0.05. (G) Continued particle release after the extracellular Pi concentration had been raised to 2.5 mM for 1.5 hours and then adjusted back to the control level of 1 mM for additional 1.5 hours (an indication that Pi-derived particles are MPs rather than Ca/Pi-nanocrystals forming in the medium as a direct result of the high Pi concentration). (Left panel) Particle concentration measured by NTA in uncentrifuged medium. (Right panel) Total protein determined in particles sedimented from the medium at 18,000×g (fraction 3 in Table 1). n=3. *P<0.05; **P<0.01.
Figure 2.
Figure 2.
Hyperphosphatemia raises intracellular Pi concentration in EAhy926 ECs. Relationship between extracellular Pi concentration, Pi transport inhibition, and Pi detected in the cell layer in EAhy926 ECs. (A) Time course of the increase in intracellular Pi. n=6. **P<0.01; ****P<0.001. (B–D) Blunting of the hyperphosphatemia-induced rise in intracellular Pi at t=1.5 hours by (B) collapsing the plasma membrane sodium gradient with the Na+/K+-ATPase inhibitor ouabain (n=6), (C) blocking Pi transport with the Pi analog PFA (n=4), or (D) metabolic trapping of intracellular Pi with fructose (n=3). *P<0.05.
Figure 3.
Figure 3.
Pi transport in ECs is mainly through active Na+-Linked PiT1 (slc20a1) Pi transporters. (A) Effect of replacing Na in the Hepes-buffered saline (HBS) medium with choline or blocking Pi transporters with 1 mM PFA on transport of 32Pi. Cells were incubated to steady state for 90 minutes in HBS with 1 mM Pi at 37°C in air followed immediately by assay of 32Pi transport by incubating for exactly 5 minutes at 20°C in medium with 0.1 mM 32Pi at 2 μCi/ml. n=3. ****P<0.001. (B) Effect of siRNA silencing of PiT1 and/or PiT2 and/or PiT-1/2 dual siRNA silencing on total cell layer Pi. After removal of the transfection medium and allowing an additional 24-hour recovery period in Growth Medium, cells were incubated in HBS with 1 mM Pi for 90 minutes at 37°C in air. n=3. *P<0.05; **P<0.003; ***P<0.001. (C) Relative mRNA levels of PiT-1 and PiT-2 in EAhy926 cells transfected with scrambled/nontargeting siRNA, PiT-1 siRNA, and PiT-2 siRNA for 24 hours. After removal of the transfection medium and allowing an additional 24-hour recovery period in Growth Medium, RNA was extracted from the cells, reverse transcribed, and subjected to quantitative RT-PCR. n=5. ****P<0.001.
Figure 4.
Figure 4.
Pi inhibits phosphoprotein phosphatases. (A and B) Direct inhibition by Pi of tyrosine protein phosphatase catalytic activity in lysates of EAhy926 cells assayed in vitro in the presence of exogenous Pi at the stated concentration using two different tyrosine phosphatase substrates (A, V2471 substrate-1; B, V2471 substrate-2; Promega ). n=3. *P<0.05. (C) Mimicry by broad spectrum PTPase inhibitor (Vanadate) of the acute (90-minute) Pi-induced increase in particle output detected by NTA in uncentrifuged medium from EAhy926 cells. n=3. Particle concentration is expressed as millions (E6) per milliliter. *P<0.05; ***P<0.001. (D) Mimicry by broad spectrum PSPase inhibitor (sodium fluoride) of the chronic (24-hour) Pi-induced increase in particle output detected by measuring total sedimentable protein after centrifugation at 18,000×g (fraction 3 in Table 1). n=3. **P<0.01; ***P<0.001; ****P<0.001.
Figure 5.
Figure 5.
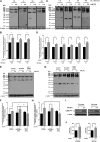
Pi induces global changes in protein phosphorylation. Net global effects of hyperphosphatemia on protein phosphorylation and/or dephosphorylation in EAhy926 ECs. (A–D) Representative immunoblots and quantitative analyses by densitometry of (A and B) protein tyrosine phosphorylation probed with pan-specific antiphosphotyrosine antibody and (C and D) protein serine/threonine phosphorylation probed with pan-specific antiphosphoserine/threonine antibody. Densitometry is shown for cells incubated for 1.5 hours in medium with 1 or 2.5 mM Pi. For tyrosine phosphorylation, n=4. For serine/threonine phosphorylation, n=4. MW, molecular mass. *P<0.05; **P<0.01. (E–H) Effect of siRNA silencing of PiT-1 transporter expression during 1.5-hour incubations of cells with 1 or 2.5 mM Pi. Representative immunoblots and quantitative analyses by densitometry of (E and F) protein tyrosine phosphorylation and (G and H) protein serine/threonine phosphorylation. Control denotes cultures treated with transfection agent only. In F, the densitometry analysis was performed on all bands in the 60- to 220-kD region of the blots. n=3. In H, densitometry was performed at 70–220 kD. n=4. *P<0.05; **P<0.01; ***P<0.001. (I and J) Effect of 24 or 48 hours of hyperphosphatemia on expression of low molecular weight protein tyrosine phosphatase (LMW-PTP) determined by immunoblotting and densitometry. n=3. *P<0.05.
Figure 6.
Figure 6.
Hyperphosphatemia induces changes in Tropomyosin-3 in ECs. (A) 2-DE (representative of three independent experiments) showing the effect on cell proteins of incubation of EAhy926 cells in medium with 1 or 2.5 mM Pi for 1.5 hours. Gels were stained with RAPIDstain Reagent followed by MALDI-TOF MS analysis of two prominent protein spots at approximately 75 (spot 1 on each gel) and approximately 30 kD (spot 2 on each gel). (B) Typical MALDI-TOF MS peptide fragment pattern of spot 2 taken from gel 1 (1 mM Pi-treated cells). (C) Peptide sequence homology with TM-3 (shown in bold) identified by MALDI-TOF MS and Mascot database search. The sequence coverage of TM-3 reached 38%. Similar results were obtained from spot 2 on gel 2 (2.5 mM Pi-treated cells; data not shown). (Similar analysis of spot 1 from both gels identified BSA [data not shown].) (D) Tropomyosin immunoblots (representative of three independent experiments) obtained from cells incubated as in A and probed using anti–TM-3 antibody to confirm the accumulation of TM-3 in cells treated with 2.5 mM Pi over a time course from 90 minutes to 48 hours. (E–H) Corresponding densitometry analyses on TM-3 immunoblots at (E) 90 minutes, (F) 8 hours, (G) 24 hours, and (H) 48 hours. n=3. *P<0.05. (I and J) Tropomyosin phosphorylation. Immunoblotting and densitometry analyses of 2-DE gels blotted on nitrocellulose membranes and probed with pan-specific anti–P-Ser/Thr antibody. (Spot 2-designated P–TM-3 denotes phosphorylated Tropomyosin). MW, molecular mass.
Figure 7.
Figure 7.
Pi-derived MPs are strongly procoagulant. Effect in a thrombin generation assay of MPs sedimented at 18,000×g from medium (with 1 or 2.5 mM Pi) cultured for 24 hours with EAhy926 cells. Particle centrifugation was performed as described in Table 1. Sedimented particles (fraction 2 in Table 1) were resuspended in pooled filtered plasma (PFP) before the assay. Control curves are also shown for PFP alone and particle preparations from which particles had been removed by ultrafiltration. (A) Representative thrombin generation curves (showing definitions of the Thrombogram parameters). (B–D) Analyses of peak thrombin, endogenous thrombin potential (ETP), and lag time of control and Pi-derived MPs showing significantly increased peak thrombin and ETP with MPs from Pi-treated cells, although the time at which thrombin burst commenced (lag time) was not different between the two MP preparations. t=24 hours. n=3. *P<0.05. (E) Total protein concentration of the 18,000×g sedimented MP pellet (fraction 2 in Table 1) from the control (1 mM Pi) and Pi-loaded (2.5 mM Pi) culture medium showing similar MP content. t=24 hours. n=3. (F) Analysis of thrombin generated per microgram of protein indicating release of more procoagulant MP from high Pi medium. t=24 hours. n=3. *P<0.05.

Comment in

References

    1. Foley RN, Parfrey PS, Sarnak MJ: Epidemiology of cardiovascular disease in chronic renal disease. J Am Soc Nephrol 9[Suppl]: S16–S23, 1998 - PubMed
    1. Razzaque MS: Phosphate toxicity: New insights into an old problem. Clin Sci (Lond) 120: 91–97, 2011 - PMC - PubMed
    1. Ellam TJ, Chico TJ: Phosphate: The new cholesterol? The role of the phosphate axis in non-uremic vascular disease. Atherosclerosis 220: 310–318, 2012 - PubMed
    1. Di Marco GS, Hausberg M, Hillebrand U, Rustemeyer P, Wittkowski W, Lang D, Pavenstädt H: Increased inorganic phosphate induces human endothelial cell apoptosis in vitro. Am J Physiol Renal Physiol 294: F1381–F1387, 2008 - PubMed
    1. Peng A, Wu T, Zeng C, Rakheja D, Zhu J, Ye T, Hutcheson J, Vaziri ND, Liu Z, Mohan C, Zhou XJ: Adverse effects of simulated hyper- and hypo-phosphatemia on endothelial cell function and viability. PLoS ONE 6: e23268, 2011 - PMC - PubMed

MeSH terms