

Measurement of longitudinal β-amyloid change with 18F-florbetapir PET and standardized uptake value ratios
- PMID: 25745095
- PMCID: PMC5313473
- DOI: 10.2967/jnumed.114.148981
Measurement of longitudinal β-amyloid change with 18F-florbetapir PET and standardized uptake value ratios
Abstract
The accurate measurement of β-amyloid (Aβ) change using amyloid PET imaging is important for Alzheimer disease research and clinical trials but poses several unique challenges. In particular, reference region measurement instability may lead to spurious changes in cortical regions of interest. To optimize our ability to measure (18)F-florbetapir longitudinal change, we evaluated several candidate regions of interest and their influence on cortical florbetapir change over a 2-y period in participants from the Alzheimer Disease Neuroimaging Initiative (ADNI).
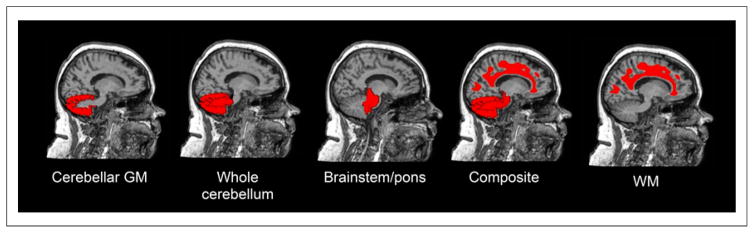
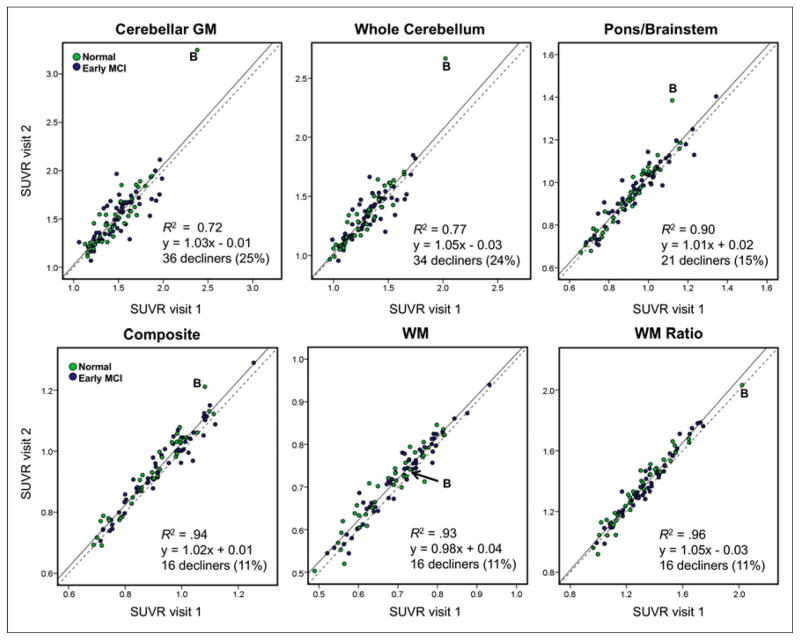
Methods: We examined the agreement in cortical florbetapir change detected using 6 candidate reference regions (cerebellar gray matter, whole cerebellum, brain stem/pons, eroded subcortical white matter [WM], and 2 additional combinations of these regions) in 520 ADNI subjects. We used concurrent cerebrospinal fluid Aβ1-42 measurements to identify subgroups of ADNI subjects expected to remain stable over follow-up (stable Aβ group; n = 14) and subjects expected to increase (increasing Aβ group; n = 91). We then evaluated reference regions according to whether cortical change was minimal in the stable Aβ group and cortical retention increased in the increasing Aβ group.
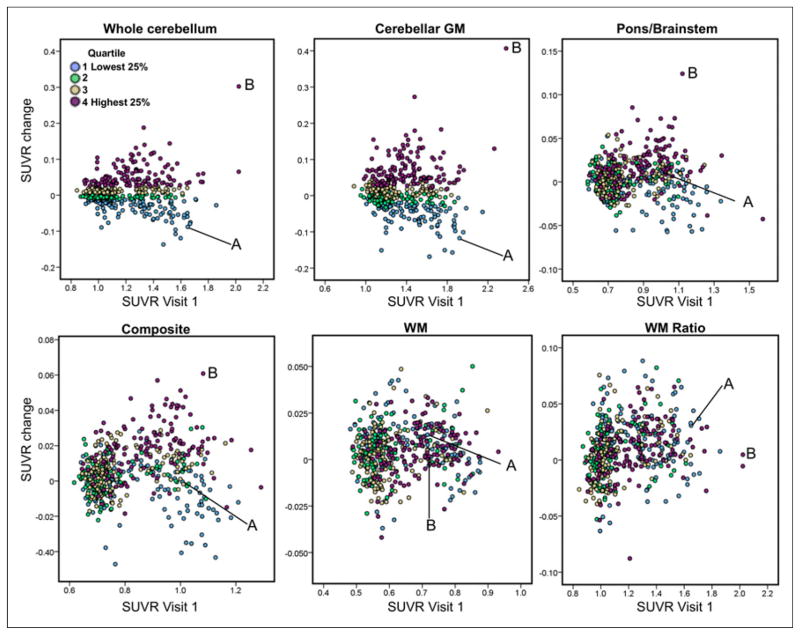
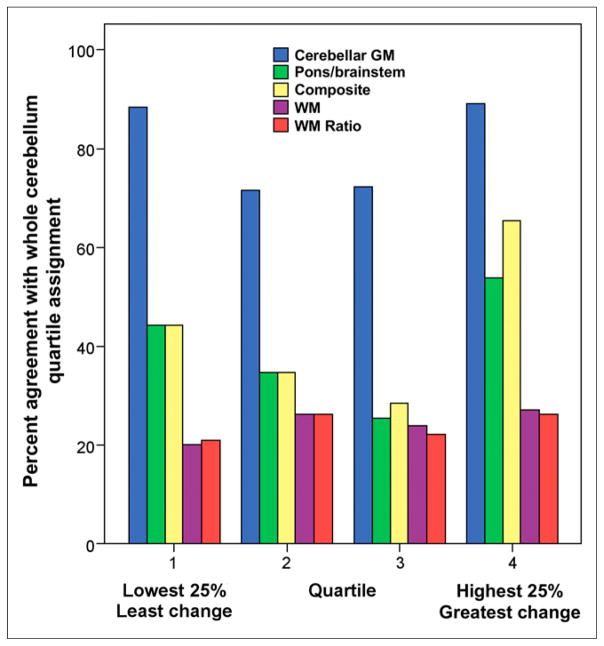
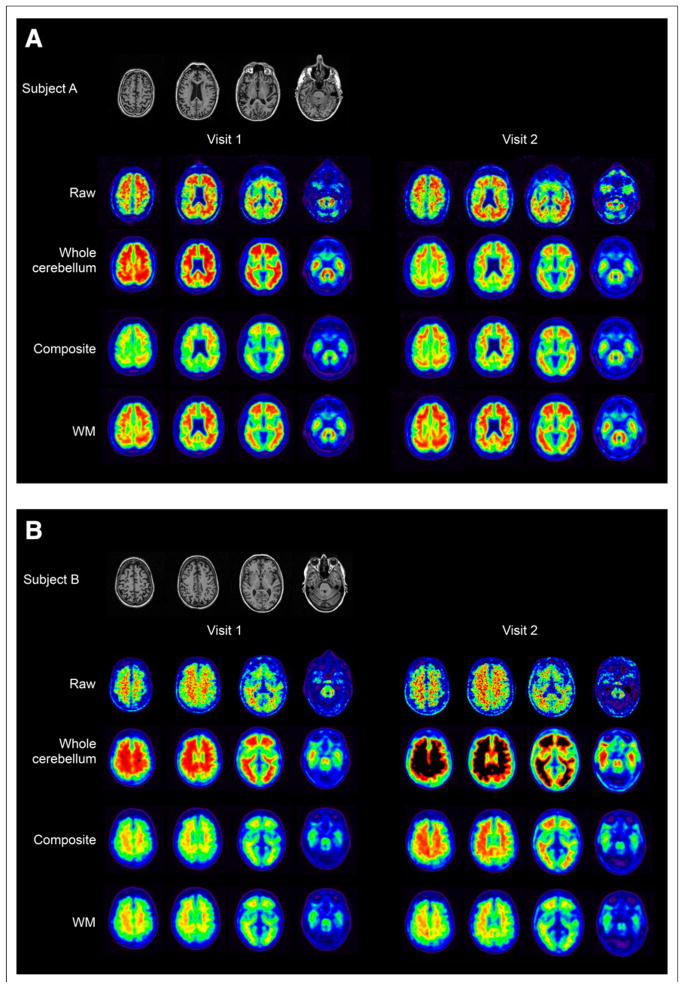
Results: There was poor agreement across reference regions in the amount of cortical change observed across all 520 ADNI subjects. Within the stable Aβ group, however, cortical florbetapir change was 1%-2% across all reference regions, indicating high consistency. In the increasing Aβ group, cortical increases were significant with all reference regions. Reference regions containing WM (as opposed to cerebellum or pons) enabled detection of cortical change that was more physiologically plausible and more likely to increase over time.
Conclusion: Reference region selection has an important influence on the detection of florbetapir change. Compared with cerebellum or pons alone, reference regions that included subcortical WM resulted in change measurements that are more accurate. In addition, because use of WM-containing reference regions involves dividing out cortical signal contained in the reference region (via partial-volume effects), use of these WM-containing regions may result in more conservative estimates of actual change. Future analyses using different tracers, tracer-kinetic models, pipelines, and comparisons with other biomarkers will further optimize our ability to accurately measure Aβ changes over time.
Keywords: Alzheimer’s disease; PET imaging; amyloid.
© 2015 by the Society of Nuclear Medicine and Molecular Imaging, Inc.
Figures
References
-
- Rinne JO, Brooks DJ, Rossor MN, et al. 11C-PiB PET assessment of change in fibrillar amyloid-beta load in patients with Alzheimer’s disease treated with bapineuzumab: a phase 2, double-blind, placebo-controlled, ascending-dose study. Lancet Neurol. 2010;9:363–372. - PubMed
-
- Lopresti BJ, Klunk WE, Mathis CA, et al. Simplified quantification of Pittsburgh compound B amyloid imaging PET studies: a comparative analysis. J Nucl Med. 2005;46:1959–1972. - PubMed
Publication types
MeSH terms
Substances
Grants and funding
LinkOut - more resources
Full Text Sources
Other Literature Sources