. 2015 Mar 6;347(6226):1259038.
doi: 10.1126/science.1259038. Epub 2015 Feb 12.

Immunogenetics. Dynamic profiling of the protein life cycle in response to pathogens

Affiliations

Immunogenetics. Dynamic profiling of the protein life cycle in response to pathogens

Marko Jovanovic et al. Science. .

Abstract

Protein expression is regulated by the production and degradation of messenger RNAs (mRNAs) and proteins, but their specific relationships remain unknown. We combine measurements of protein production and degradation and mRNA dynamics so as to build a quantitative genomic model of the differential regulation of gene expression in lipopolysaccharide-stimulated mouse dendritic cells. Changes in mRNA abundance play a dominant role in determining most dynamic fold changes in protein levels. Conversely, the preexisting proteome of proteins performing basic cellular functions is remodeled primarily through changes in protein production or degradation, accounting for more than half of the absolute change in protein molecules in the cell. Thus, the proteome is regulated by transcriptional induction for newly activated cellular functions and by protein life-cycle changes for remodeling of preexisting functions.


Figures

Figure 1
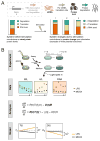
Figure 1. Framework to study the dynamic protein life cycle
(A) The dynamic protein life cycle. Top: RNA transcription, processing and degradation (dashed grey box) determine mRNA levels (red), which together with per-mRNA translation (tan) and protein degradation/removal (blue) determine final protein levels. Bottom: Hypothetical contribution of each process (stacked chart) to protein levels at steady-state (left) or to fold changes (right, three hypothetical scenarios). (B) Experimental and analysis workflow. From top to bottom: experimental system (“Experiment”) consistent of DCs grown in medium-heavy SILAC (M) medium until LPS (top) or MOCK (bottom) stimulation, when heavy (H) SILAC is substituted. A “standard”, light (L) SILAC labeled sample is spiked in. The resulting measurements (“Data”) include M/L and H/L ratios (proxies for protein degradation/removal and production, respectively), as well as RNA-Seq data at each time point. These are used to fit the parameters of an ODE model (“Analysis”), where R(t) = modeled mRNA change over time; T(t) and D(t) = per-mRNA translation and protein degradation rate constants over time, respectively; (t) = recycling (‘impurity’) rate; H(t) and M(t) = modeled change in heavy (H/L) and medium (M/L) channels, respectively. The results (“Model”) are the estimated per-mRNA translation and protein degradation rates over time. See text and (29) for details.
Figure 2
Figure 2. The protein life cycle in LPS stimulated DCs
(A) Shown are (left to right) for all 2,288 genes (rows) that were quantified in all samples, mRNA expression, H/L protein expression and M/L protein expression in LPS and MOCK stimulated DCs from each replicate (columns). Gene order is the same across all heatmaps, and determined by hierarchical clustering of fitted fold changes in mRNA level, translation rate, and degradation rate. Values are median normalized by row, logged, and robust z-transformed per map (color scale). (B) Fitted differential expression of the same 2,288 genes (rows). Left to right: Robust z-score fitted differential expression ratios (LPS/MOCK; red/blue color scale) for R(t), H(t) and M(t) in LPS vs. MOCK stimulated DCs from each replicate (columns) with the log2 fold changes between LPS and MOCK stimulated DCs at 12h post stimulation for mRNA (ΔR), per-mRNA translation rate (ΔTr), and protein degradation rate (ΔDeg) (also z-scored). Right most column: immune response (purple), ribosomal (green) and mitochondrial (orange) proteins.
Figure 3
Figure 3. Contributions of mRNA levels and the protein life cycle to steady state and dynamic protein levels
(A–D) Global contributions of mRNA levels (orange); translation rates (tan); and protein degradation rates (blue) to protein levels. Translation rates were either derived from pSILAC data (A, C and D) or from TE values from ribosome profiling data (B). Contributions to steady state protein levels prior to LPS induction (A and B) or to the change in protein abundance between LPS induced and mock treated cells (C and D) are shown. The contributions to the fold change (C) and to the absolute change in protein abundances (D) after LPS stimulation are given. Note that the contributions for steady state presented exclude the percent of the variance in measured protein levels that is not explained by the variance in mRNA, translation or protein degradation (fig. S10). Per-gene parameter values were in the order: 1. mRNA; 2. translation; 3. degradation (29). For all possible orderings see fig. S11. (E) Functional processes controlled by distinct regulatory steps. For each process (rows) and regulatory step (columns) shown are the magnitudes of the log10(P-values) for the values or differential fold changes (LPS/MOCK at 12h) of mRNA levels, protein synthesis or degradation rates of genes annotated to this process vs. the background of all genes fit by the model. Values are signed according to directionality of the enrichment (Wilcoxon rank-sum test). Shown are the 5 gene sets most enriched for increased or decreased rates for the three ‘fold change’ columns, along with their scores in all six regulatory modes. Nearly-redundant gene sets were removed (see table S6 for all gene sets). (F) Examples of regulation of expression dynamics. For each of three genes in each of LPS (orange) and MOCK (black) condition shown are the measured values (dots) and fits (curves) for (top to bottom) mRNA levels (in mRNA molecules), per-mRNA translation rates (protein molecules / mRNA molecule / hour (hr)), degradation rates (1/hr), H(t), M(t) and total protein ((M+H)(t)). X-axis: time; Y-axis: intensity or rate. Light blue: key regulatory mode. mRNA and protein molecules are only proxies for transcripts per million (TPM) and IBAQ microshares, respectively, in order to help interpretation (29).
Figure 4
Figure 4. Degradation of mitochondrial proteins following LPS stimulation is associated with mitophagy
(A, B) Increased translation rates of some ribosomal proteins (A) and increased degradation rates of mitochondrial proteins (B). Shown are the distributions of log2 fold changes of translation rates (ΔTi, A) or degradation rates (ΔDi, B) between LPS and MOCK stimulated cells of all measured ribosomal proteins (A, red) or mitochondrial proteins (B, red; from Mitocarta annotations (43)), and all measured proteins (grey). (C) Evidence of mitophagy in LPS stimulated DCs. Shown is the mitochondrial to nuclear DNA ratio (Y axis) in DCs at 0h, 12h and 24h post LPS stimulation (X axis). Values are normalized to the average mitochondrial to nuclear DNA ratio at 0h. Asterisk: a significant change relative to 0h (P-value = 0.016, t-test, n=3). (D) Distribution of raw log2 LPS/MOCK M/L ratios (a proxy for protein decay) for all measured mitochondrial proteins (in Mitocarta (43)) at 12h (black) and 24h (grey) post stimulation.

Comment in

References

    1. Sonenberg N, Hinnebusch AG. Regulation of translation initiation in eukaryotes: mechanisms and biological targets. Cell. 2009;136:731–745. - PMC - PubMed
    1. Chapman MA, et al. Initial genome sequencing and analysis of multiple myeloma. Nature. 2011;471:467–472. - PMC - PubMed
    1. Castello A, Fischer B, Hentze MW, Preiss T. RNA-binding proteins in Mendelian disease. Trends Genet TIG. 2013;29:318–327. - PubMed
    1. Komili S, Silver PA. Coupling and coordination in gene expression processes: a systems biology view. Nat Rev Genet. 2008;9:38–48. - PubMed
    1. Vogel C, Marcotte EM. Insights into the regulation of protein abundance from proteomic and transcriptomic analyses. Nat Rev Genet. 2012;13:227–232. - PMC - PubMed

Publication types

Associated data