. 2015 Mar 6;10(3):e0119198.
doi: 10.1371/journal.pone.0119198. eCollection 2015.

Genome-wide analysis of homeobox gene family in legumes: identification, gene duplication and expression profiling

Affiliations

Genome-wide analysis of homeobox gene family in legumes: identification, gene duplication and expression profiling

Annapurna Bhattacharjee et al. PLoS One. .

Abstract

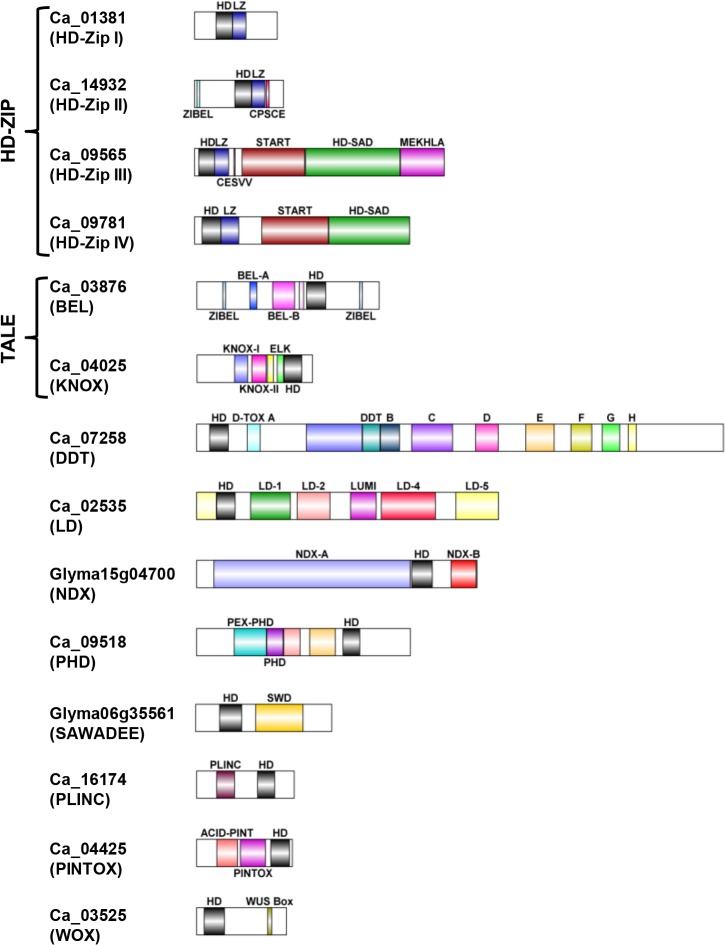
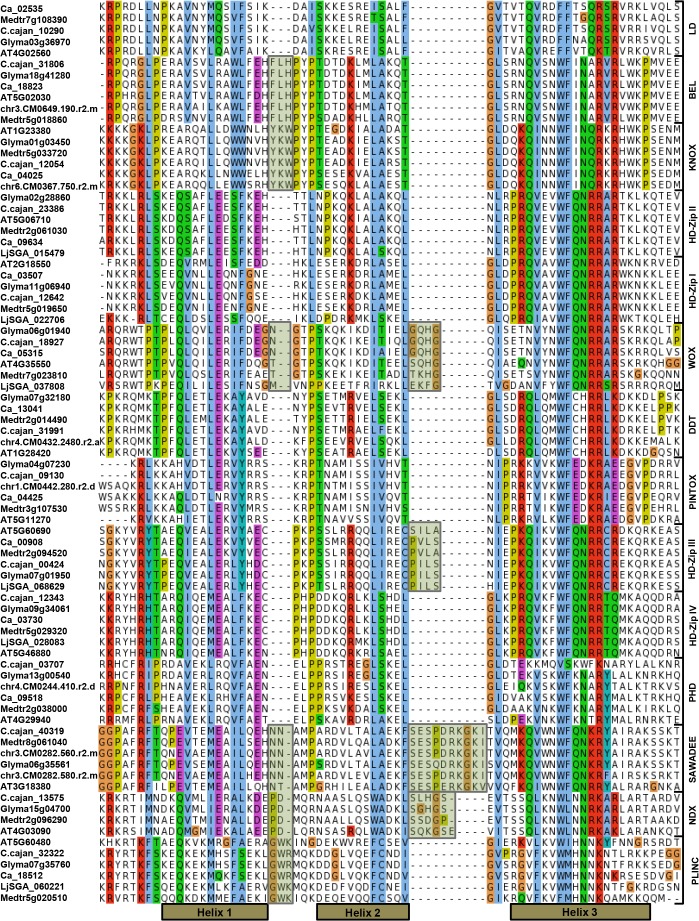
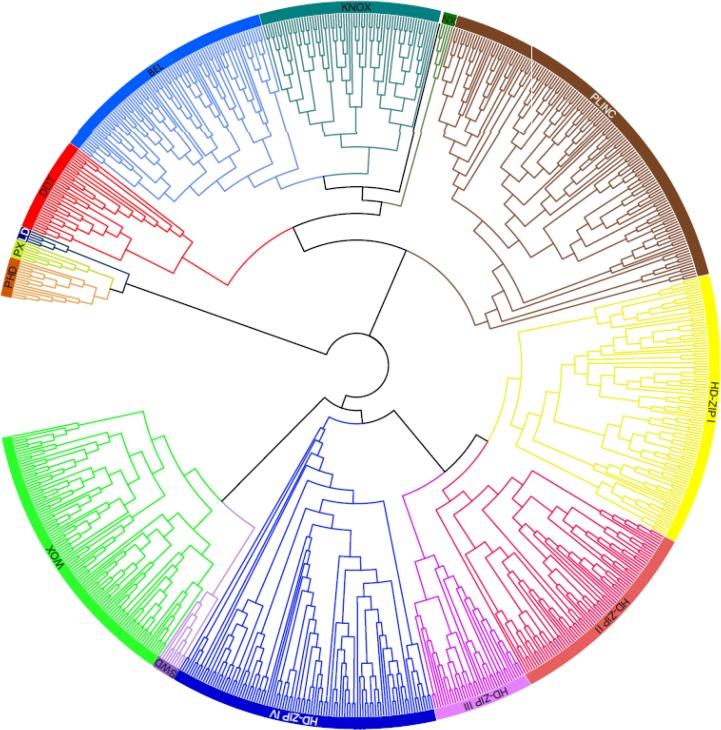
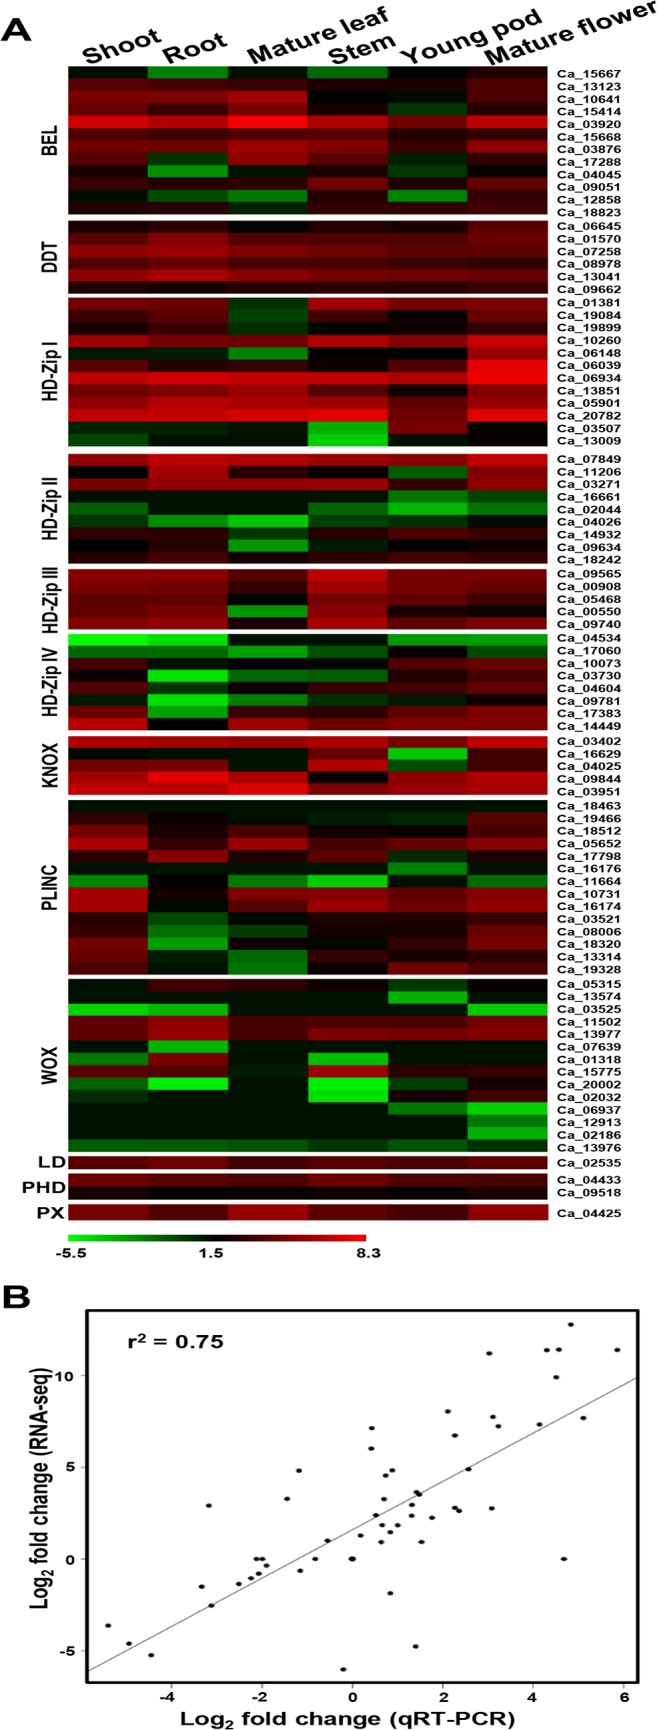
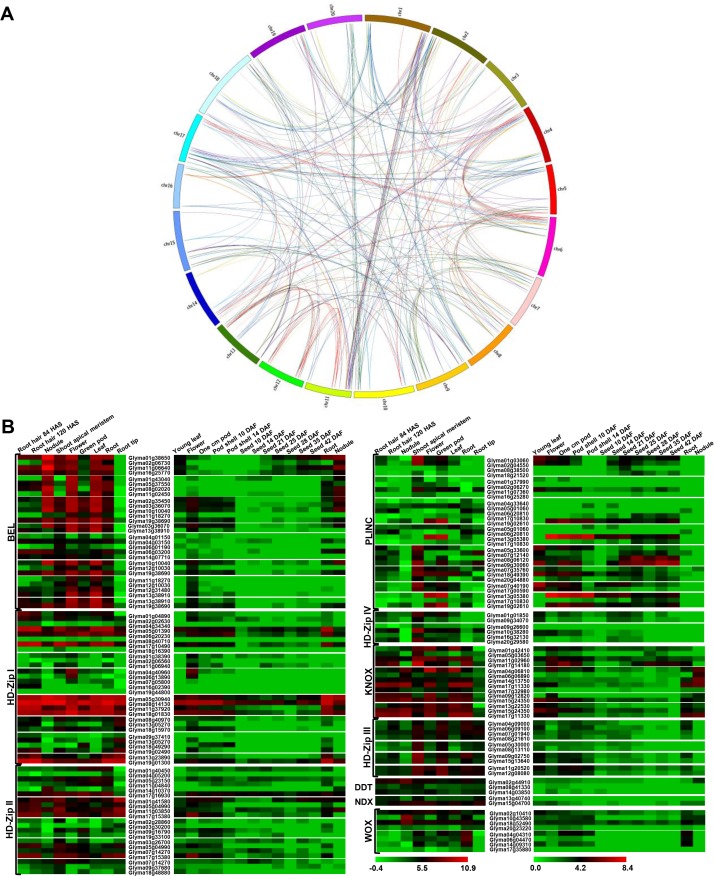
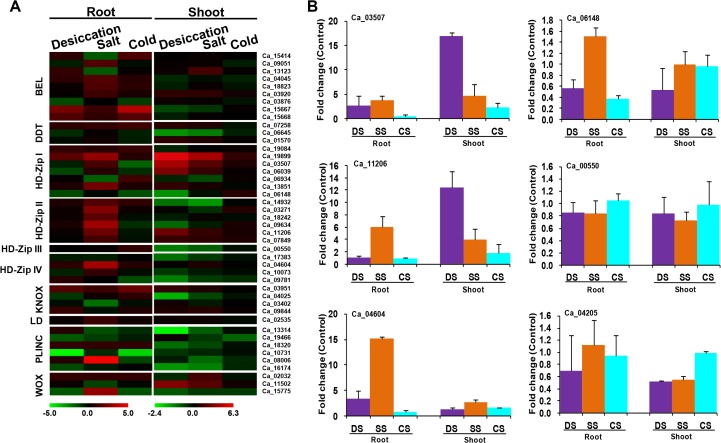
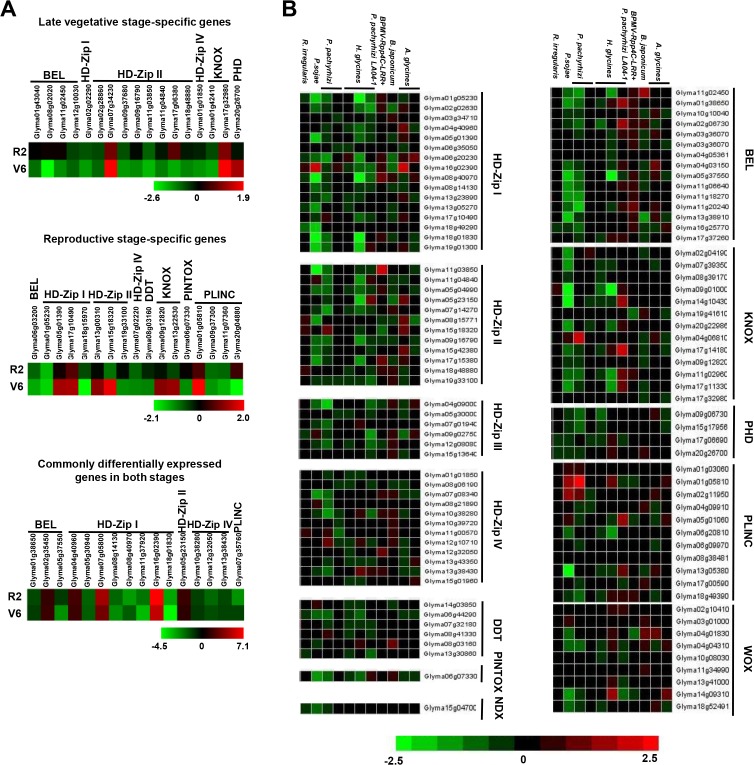
Homeobox genes encode transcription factors that are known to play a major role in different aspects of plant growth and development. In the present study, we identified homeobox genes belonging to 14 different classes in five legume species, including chickpea, soybean, Medicago, Lotus and pigeonpea. The characteristic differences within homeodomain sequences among various classes of homeobox gene family were quite evident. Genome-wide expression analysis using publicly available datasets (RNA-seq and microarray) indicated that homeobox genes are differentially expressed in various tissues/developmental stages and under stress conditions in different legumes. We validated the differential expression of selected chickpea homeobox genes via quantitative reverse transcription polymerase chain reaction. Genome duplication analysis in soybean indicated that segmental duplication has significantly contributed in the expansion of homeobox gene family. The Ka/Ks ratio of duplicated homeobox genes in soybean showed that several members of this family have undergone purifying selection. Moreover, expression profiling indicated that duplicated genes might have been retained due to sub-functionalization. The genome-wide identification and comprehensive gene expression profiling of homeobox gene family members in legumes will provide opportunities for functional analysis to unravel their exact role in plant growth and development.


Conflict of interest statement

Competing Interests: Mukesh Jain is a PLOS ONE Editorial Board member. This does not alter the authors' adherence to PLOS ONE Editorial policies and criteria.

Figures

Fig 1
Fig 1. Diagrammatic representation of the domain architecture of all the 14 classes identified in legume homeobox proteins.
Each class is represented with an example of a chickpea/soybean homeobox protein. Different domains and motifs have been indicated with different colors, homeobox domain (HD), leucine-Zipper (LZ), ZIBEL motif, CPSCE motif, CESVV motif, START domain, HD-START associated domain (HD-SAD), MEKHLA domain, DDT domain, LUMI, conserved motifs in LD HD proteins (LD1, LD2, LD4 and LD5), NDX domain (A and B), PEX-PHD, PHD, BEL domain (A and B), SAWADEE (SWD), KNOX domain (I and II), ELK motif, zinc-finger (PLINC) and WUS box (WOX). D-TOX A is indicated with its full symbol; D-TOX B, D-TOX C, D-TOX D, D-TOX E, D-TOX F, D-TOX G and D-TOX H are indicated as B, C, D, E, F, G and H, respectively.
Fig 2
Fig 2. Multiple sequence alignment of amino acid (aa) sequences of HD from different classes.
The representatives of each class from Arabidopsis thaliana (AT), Cicer arientinum (Ca), Glycine max (Glyma), Cajanus cajan (C. cajan), Medicago truncatula (Medtr) and Lotus japonicus (LjSGA, chr) have been shown. The alignment was obtained using CLUSTALX and conserved amino acids of different physicochemical properties are highlighted in different shades using the Jalview software. Atypical aa residues are also shaded and the positions of three alpha helices are indicated at the bottom of the diagram.
Fig 3
Fig 3. Phylogenetic tree based on full-length homeobox protein sequences identified in Arabidopsis, chickpea, soybean, Medicago, Lotus and pigeonpea.
The phylogenetic tree is unrooted and bootstrap support is based on 1000 replicates. Classes of homeobox gene family (labeled) are well separated in different clades in this analysis and are consistently supported by conserved, class-specific domain architecture.
Fig 4
Fig 4. Differential gene expression of chickpea homeobox genes in various tissues/organs.
(A) Heat-map showing expression patterns of homeobox genes in different tissues/organs. The scale at the bottom represents log2 RPKM value. The maximum value is displayed as dark red and minimum value is displayed as light green. Gene IDs are given on right side. (B) The correlation between gene expression results obtained from RNA-seq and qRT-PCR analysis. Each data point represents log2 of RPKM value for RNA-seq and qRT-PCR.
Fig 5
Fig 5. Gene duplication events in homeobox gene family in soybean.
(A) Circos diagram showing the genic position of 328 gene pairs on soybean chromosomes. Homeobox gene pairs present on duplicated chromosomal segments are connected by different colored lines according to different classes (B) Heat-map showing remarkable differential expression patterns among duplicated gene pairs in different tissues/organs/developmental stages. Genes have been grouped on the basis of class to which they belong. The scale at the bottom represents log2 RPKM value. The maximum value is displayed as dark red and minimum value is displayed as light green.
Fig 6
Fig 6. Differential expression of chickpea homeobox genes under abiotic stress conditions.
(A) Heat-map showing differential expression of chickpea homeobox genes under abiotic stress conditions in root and shoot tissues. The scale at the bottom represents log2 fold change, maximum value is displayed as dark red and minimum value is displayed as light green. Gene IDs are given on right side. (B) Real-time PCR analysis to validate the differential expression of representative chickpea homeobox genes during various abiotic stress conditions. The mRNA levels for each candidate gene were calculated relative to its expression in control root or shoot tissues. DS, desiccation stress; SS, salinity stress; CS, cold stress.
Fig 7
Fig 7. Differential expression of soybean homeobox genes under abiotic and biotic stress conditions.
(A) Heat-map showing differential expression patterns of soybean homeobox genes during drought stress condition at late vegetative (V6), full bloom reproductive (R2) and both stages of development. The scale at the bottom represents log2 fold change value. The maximum value is displayed as dark red and minimum value is displayed as light green. Gene IDs are given on the right side. (B) Heat-map showing expression patterns of soybean homeobox genes under biotic stresses caused by various pathogens. The scale at the bottom represents log2 ratio of expression value. The maximum value is displayed as dark red and minimum value is displayed as light green. Images have been created and retrieved by Genevestigator v.3. Gene IDs are given on the top.

References

    1. Gehring WJ, Affolter M, Burglin TR. Homeodomain proteins. Annu Rev Biochem. 1994; 63: 487–526. - PubMed
    1. Nam J, Nei M. Evolutionary change of the numbers of homeobox genes in bilateral animals. Mol Biol Evol. 2005; 22: 2386–2394. - PMC - PubMed
    1. Mukherjee K, Brocchieri L, Burglin TR. A comprehensive classification and evolutionary analysis of plant homeobox genes. Mol Biol Evol. 2009; 26: 2775–2794. 10.1093/molbev/msp201 - DOI - PMC - PubMed
    1. Desplan C, Theis J, O’Farrell PH. The sequence specificity of homeodomain-DNA interaction. Cell 1988; 54: 1081–1090. - PMC - PubMed
    1. Otting G, Qian YQ, Billeter M, Muller M, Affolter M, Gehring W, et al. Protein-DNA contacts in the structure of a homeodomain–DNA complex determined by nuclear magnetic resonance spectroscopy in solution. EMBO J. 1990; 9: 3085–3092. - PMC - PubMed

Publication types

MeSH terms