. 2015 Mar 4;7(3):939-68.
doi: 10.3390/v7030939.

Differential expression of HERV-K (HML-2) proviruses in cells and virions of the teratocarcinoma cell line Tera-1

Affiliations

Differential expression of HERV-K (HML-2) proviruses in cells and virions of the teratocarcinoma cell line Tera-1

Neeru Bhardwaj et al. Viruses. .

Abstract

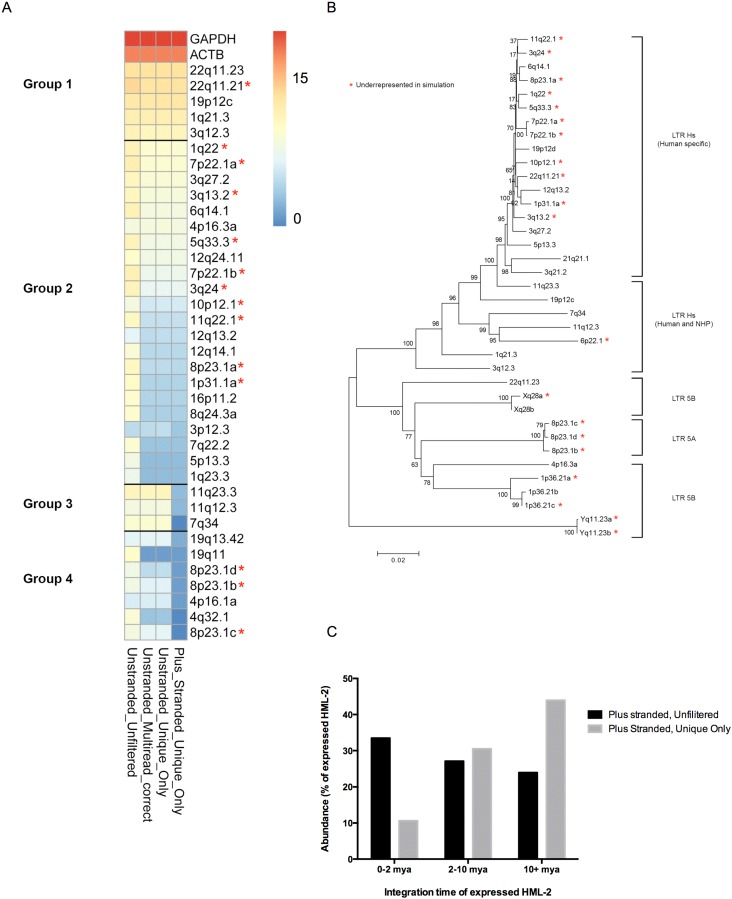
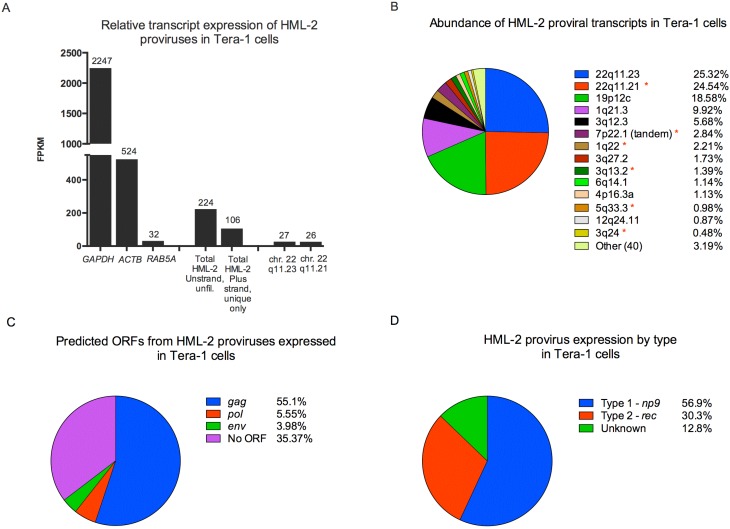
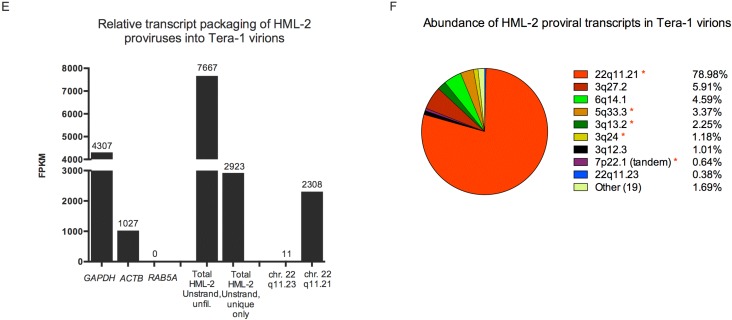
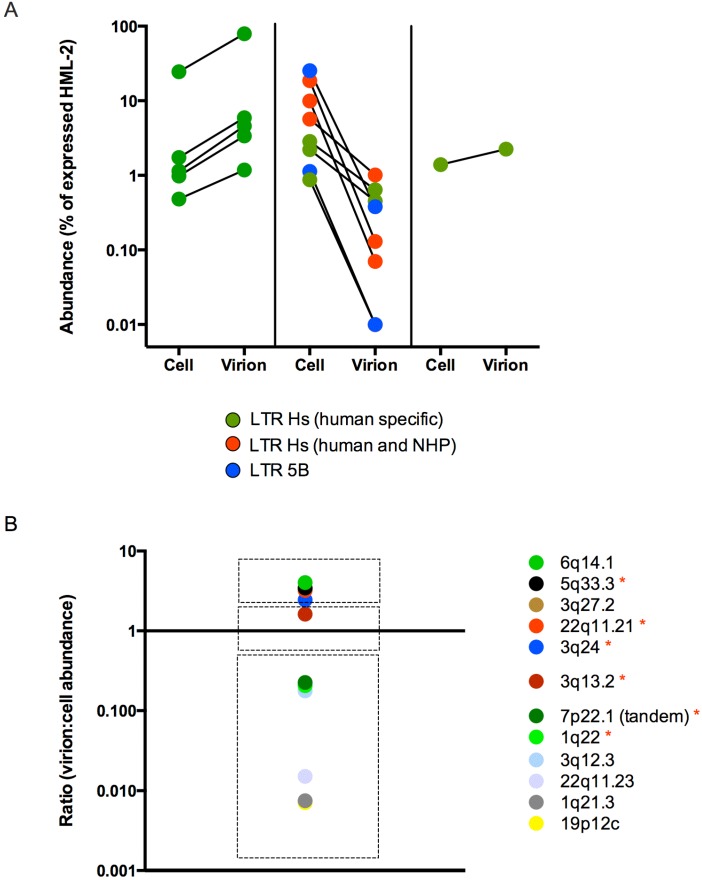
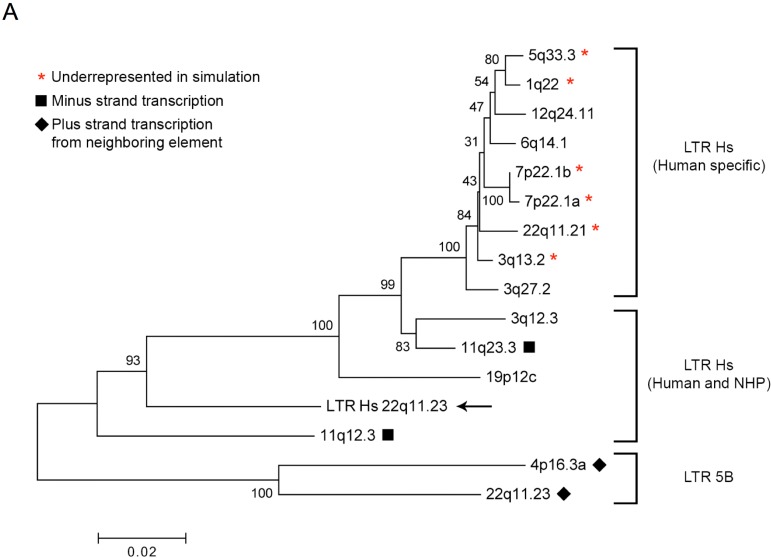
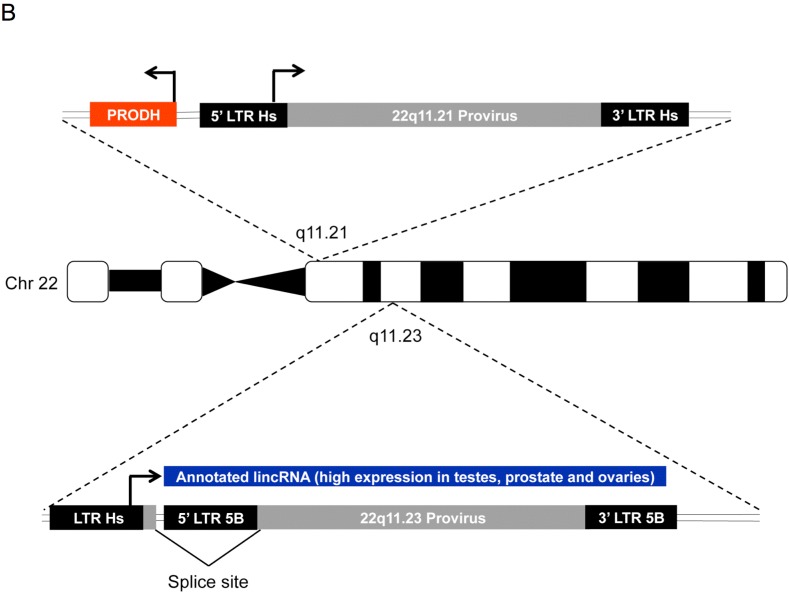
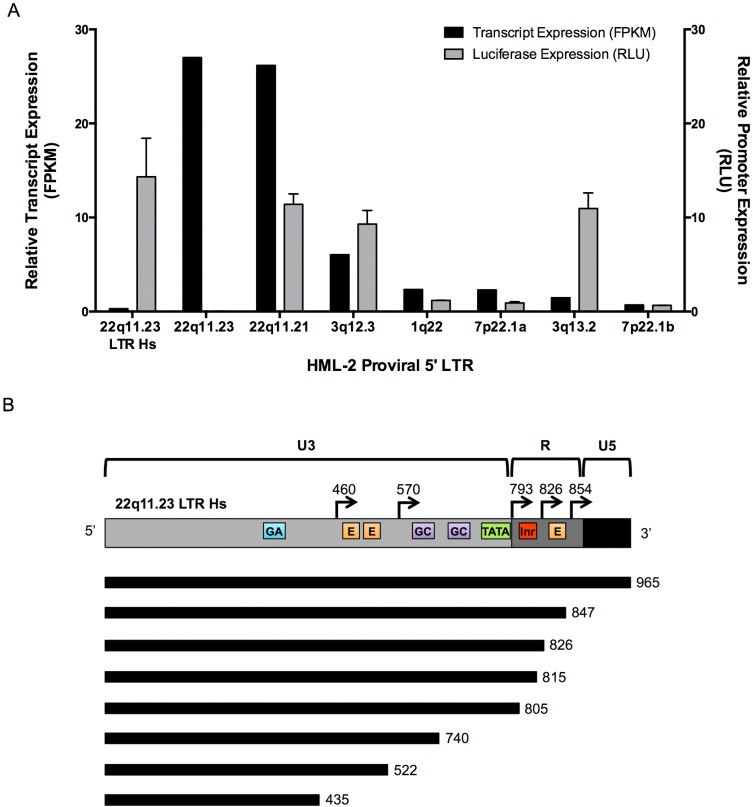
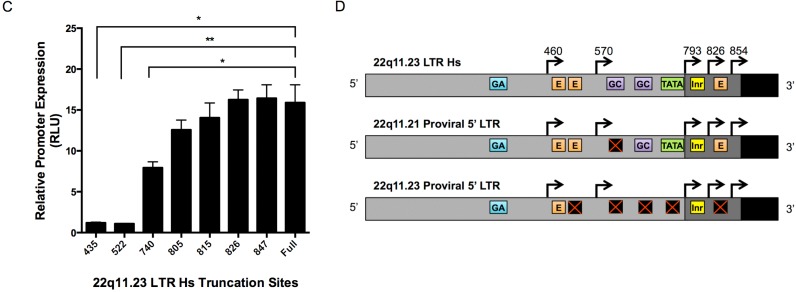
Human endogenous retrovirus (HERV-K (HML-2)) proviruses are among the few endogenous retroviral elements in the human genome that retain coding sequence. HML-2 expression has been widely associated with human disease states, including different types of cancers as well as with HIV-1 infection. Understanding of the potential impact of this expression requires that it be annotated at the proviral level. Here, we utilized the high throughput capabilities of next-generation sequencing to profile HML-2 expression at the level of individual proviruses and secreted virions in the teratocarcinoma cell line Tera-1. We identified well-defined expression patterns, with transcripts emanating primarily from two proviruses located on chromosome 22, only one of which was efficiently packaged. Interestingly, there was a preference for transcripts of recently integrated proviruses, over those from other highly expressed but older elements, to be packaged into virions. We also assessed the promoter competence of the 5' long terminal repeats (LTRs) of expressed proviruses via a luciferase assay following transfection of Tera-1 cells. Consistent with the RNASeq results, we found that the activity of most LTRs corresponded to their transcript levels.


Figures

Figure 1
Figure 1
RNASeq analysis of HML-2 expression in Tera-1 cells. (A) RNASeq reads derived from Tera-1 cellular RNA were aligned to the hg19 build of the human genome, using either a stranded (“Plus Stranded”) or unstranded (“Unstranded”) alignment. Aligned reads were either kept in full (“Unfiltered”), or were filtered based on mapping quality scores to only retain reads that uniquely aligned to one map location (“Unique Only”). The fragments per kilobase per million mapped reads (FPKM) values representing relative expression in Tera-1 cells were determined either with a multi-read correct parameter (“Multi-read Correct”) that proportionally allocates multi-reads to mapping locations, or without this parameter. FPKM values for selected HML-2 proviruses and the cellular genes GAPDH and β-actin (ACTB) across the analyses were log-normalized and used for heatmap generation to demonstrate the effects of the different analyses on expression levels. Proviruses and gene loci are divided into four groups according to their relative values following the different analyses: stable (Group 1); decrease after Unique Only (Group 2); decrease after Plus stranded alignment (Group 3); and decrease after Unique Only and Plus stranded analysis (Group 4). Log-normalized FPKM is shown by the colors from high (red) to low (blue), as indicated in the chart to the right. The (*) symbols refer to proviruses predicted to be underrepresented by 15% or more based on an in silico simulation. (B) A neighbor-joining tree of the underrepresented proviruses was created using the full provirus sequence. The p-distance method was used and bootstrap values are indicated as percent of 1000 replicates. (C) The abundance of transcripts after the Plus stranded, Unfiltered and the Plus Stranded, Unique Only analyses are plotted against estimated times of integration to show the effect of the Unique Only analysis on recently integrated proviruses. The 0–2 mya group includes human specific integrations with high sequence similarity predicted to be underrepresented in the Unique Only RNASeq in silico simulation. The relative abundance in Tera-1 cells was calculated for each provirus based on (provirus FPKM)/(total HML-2 provirus FPKM) × 100. Elements without 5’ or 3’ LTRs were unsuitable for age estimation and are not included.
Figure 2
Figure 2
HML-2 expression in Tera-1 cells and virions. (A,B) RNASeq reads originating from Tera-1 cells were aligned to the hg19 build of the human genome and analyzed using the Plus stranded, Unique Only analysis, except as indicated. (EF) RNASeq reads originating from Tera-1 virions were aligned to the hg19 build of the human genome and analyzed using the Unstranded, Unique Only analysis, except as indicated, due to the input library not being stranded. (A, E) Relative transcript expression values (FPKM) for cellular genes, total HML-2 and the most abundantly expressed or packaged HML-2 transcripts are plotted for Tera-1 cells (A) and Tera-1 virions (E). (B,F) Abundance of transcripts for each provirus in Tera-1 cells (B) and virions (F) is plotted according to (provirus FPKM)/(total HML-2 FPKM) × 100. Proviruses with (*) were predicted to be underrepresented by the in silico analysis, as used in Figure 1. (C) Open reading frames for gag, pol and env were determined for proviruses making up 96.81% of all HML-2 reads shown in Figure 2B. If a provirus had the potential to express open reading frame(s) (ORF(s)), the abundance of the provirus in the cell was allocated to each ORF, as this represents the maximum probability of that ORF being expressed. Splicing was not considered for this analysis. (D) Type 1/2 status was determined for HML-2 proviruses making up 96.81% of all HML-2 reads, listed in Figure 2B. Unknown indicates that the entire pol-env boundary region was not present in the provirus, preventing identification of provirus type.
Figure 2
Figure 2
HML-2 expression in Tera-1 cells and virions. (A,B) RNASeq reads originating from Tera-1 cells were aligned to the hg19 build of the human genome and analyzed using the Plus stranded, Unique Only analysis, except as indicated. (EF) RNASeq reads originating from Tera-1 virions were aligned to the hg19 build of the human genome and analyzed using the Unstranded, Unique Only analysis, except as indicated, due to the input library not being stranded. (A, E) Relative transcript expression values (FPKM) for cellular genes, total HML-2 and the most abundantly expressed or packaged HML-2 transcripts are plotted for Tera-1 cells (A) and Tera-1 virions (E). (B,F) Abundance of transcripts for each provirus in Tera-1 cells (B) and virions (F) is plotted according to (provirus FPKM)/(total HML-2 FPKM) × 100. Proviruses with (*) were predicted to be underrepresented by the in silico analysis, as used in Figure 1. (C) Open reading frames for gag, pol and env were determined for proviruses making up 96.81% of all HML-2 reads shown in Figure 2B. If a provirus had the potential to express open reading frame(s) (ORF(s)), the abundance of the provirus in the cell was allocated to each ORF, as this represents the maximum probability of that ORF being expressed. Splicing was not considered for this analysis. (D) Type 1/2 status was determined for HML-2 proviruses making up 96.81% of all HML-2 reads, listed in Figure 2B. Unknown indicates that the entire pol-env boundary region was not present in the provirus, preventing identification of provirus type.
Figure 3
Figure 3
HML-2 packaging shows preference for recently integrated proviruses. (A) The abundance of proviruses expressed in the cell and packaged into virions was calculated as described in Figure 2. These values were plotted side-by-side to show an increased abundance (panel 1, left), decreased abundance (panel 2, middle) or similar abundance (panel 3, right) for proviruses packaged in virions as compared to their expression in the cell. Long terminal repeat (LTR) types of proviruses detected are indicated, with LTR Hs (human specific) in green, LTR Hs (in humans and non-human primates) in red and LTR 5B in blue. Two proviruses (12q24.11 and 4p16.3a) that were not detected in virions were plotted at 0.01% in panel 2. (B) The identities of the proviruses and the ratios of their virion to cell abundance are shown. Proviruses with (*) were predicted to be underrepresented by the in silico analysis (Figure 1).
Figure 4
Figure 4
Transcription of HML-2 proviruses is driven by the native LTR or a nearby element. (A) Neighbor-joining tree of the 5’ LTR sequences of the HML-2 proviruses expressed in Tera-1 cells. The p-distance method was used to calculate distance and bootstrap values are indicated (1000 replicates). Proviruses with (*) were predicted to be underrepresented by the in silico analysis, as in Figure 1. Solid squares (∎) indicate those proviruses (11q23.3 and 11q12.3) with minus strand transcription. Solid diamonds (♦) indicate those proviruses (4p16.3a and 22q11.23) with plus strand transcription, but which appear to originate from a neighboring transcription unit and not the corresponding 5’ LTR. (B) A cartoon of two proviruses located on chromosome 22 and their method of transcription. Provirus 22q11.21 (LTR Hs, FPKM = 26.11) is located 2.1 kb downstream from the expressed gene PRODH (Proline Dehydrogenase (oxidase) 1, FPKM = 11.53) but in the opposite transcriptional orientation. The 5’ LTR of 22q11.21 appears to drive proviral transcription in Tera-1 cells. Provirus 22q11.23 (FPKM = 26.94) appears to be transcribed solely through the use of an LTR Hs (FPKM = 0.31) located 551 bp upstream from the provirus. This transcript coincides with an annotated lincRNA (large intergenic non-coding RNA) [59]. See supplemental Figures S3 and S4 for more detail. Cartoon is not drawn to scale.
Figure 4
Figure 4
Transcription of HML-2 proviruses is driven by the native LTR or a nearby element. (A) Neighbor-joining tree of the 5’ LTR sequences of the HML-2 proviruses expressed in Tera-1 cells. The p-distance method was used to calculate distance and bootstrap values are indicated (1000 replicates). Proviruses with (*) were predicted to be underrepresented by the in silico analysis, as in Figure 1. Solid squares (∎) indicate those proviruses (11q23.3 and 11q12.3) with minus strand transcription. Solid diamonds (♦) indicate those proviruses (4p16.3a and 22q11.23) with plus strand transcription, but which appear to originate from a neighboring transcription unit and not the corresponding 5’ LTR. (B) A cartoon of two proviruses located on chromosome 22 and their method of transcription. Provirus 22q11.21 (LTR Hs, FPKM = 26.11) is located 2.1 kb downstream from the expressed gene PRODH (Proline Dehydrogenase (oxidase) 1, FPKM = 11.53) but in the opposite transcriptional orientation. The 5’ LTR of 22q11.21 appears to drive proviral transcription in Tera-1 cells. Provirus 22q11.23 (FPKM = 26.94) appears to be transcribed solely through the use of an LTR Hs (FPKM = 0.31) located 551 bp upstream from the provirus. This transcript coincides with an annotated lincRNA (large intergenic non-coding RNA) [59]. See supplemental Figures S3 and S4 for more detail. Cartoon is not drawn to scale.
Figure 5
Figure 5
HML-2 Promoter Expression in Tera-1 Cells. (A) Comparison of the relative transcript expression level (FPKM; black) for a provirus and its corresponding relative luciferase expression level in Tera-1 cells transfected with a vector containing a luciferase reporter gene downstream of the indicated proviral 5’ LTR. LTR activity is expressed as relative light units (RLU; gray) normalized to a control construct with a Renilla luciferase gene driven by an SV40 promoter. The relative promoter activities of the LTR Hs located 551 bp upstream from the 22q11.23 provirus, the 5’ LTR 5B of the 22q11.23 provirus and the 5’ LTR Hs of six other expressed proviruses in Tera-1 cells are shown. (B) Schematic of the 22q11.23 LTR Hs, showing the U3, R and U5 regions. Predicted transcriptional start sites are indicated with black arrows and nucleotide position. Colored boxes indicate previously described promoter element motifs [62,63,64]. Lines below the LTR diagram indicate the regions included in each truncated LTR construct, and numbers to the right of each line indicate the nucleotide position at which the LTR was truncated. GA, GA rich motif (nt 379–386, sequence GGGAAGGG); E, enhancer box (nt 465–476, sequence TTGCAGTTGAGA; nt 485–496, sequence AGGCATCTGTCT; nt 832–843, sequence CTCCATATGCTG); GC, GC rich motif nt 759–763, (sequence CCCCC; nt 602–606, sequence GGCGG); TATA, TATA box (nt 790–797, sequence AATAAATA); Inr, initiator element (nt 807–812, sequence CTCAGA). Cartoon is not drawn to scale. (C) Relative promoter expression levels of truncated 22q11.23 LTR Hs constructs in Tera-1 cells (Kruskal-Wallis, * p < 0.05, ** p < 0.01). All luciferase experiments were conducted in triplicate and are shown as mean ± standard deviation. (D) Schematic of promoter motifs found in the 22q11.21 provirus 5’ LTR Hs, the 22q11.23 LTR Hs and 22q11.23 provirus 5’ LTR 5B. Crossed out boxes indicate presence of a mutation in the motif as compared to the canonical sequence. Cartoon is not drawn to scale.
Figure 5
Figure 5
HML-2 Promoter Expression in Tera-1 Cells. (A) Comparison of the relative transcript expression level (FPKM; black) for a provirus and its corresponding relative luciferase expression level in Tera-1 cells transfected with a vector containing a luciferase reporter gene downstream of the indicated proviral 5’ LTR. LTR activity is expressed as relative light units (RLU; gray) normalized to a control construct with a Renilla luciferase gene driven by an SV40 promoter. The relative promoter activities of the LTR Hs located 551 bp upstream from the 22q11.23 provirus, the 5’ LTR 5B of the 22q11.23 provirus and the 5’ LTR Hs of six other expressed proviruses in Tera-1 cells are shown. (B) Schematic of the 22q11.23 LTR Hs, showing the U3, R and U5 regions. Predicted transcriptional start sites are indicated with black arrows and nucleotide position. Colored boxes indicate previously described promoter element motifs [62,63,64]. Lines below the LTR diagram indicate the regions included in each truncated LTR construct, and numbers to the right of each line indicate the nucleotide position at which the LTR was truncated. GA, GA rich motif (nt 379–386, sequence GGGAAGGG); E, enhancer box (nt 465–476, sequence TTGCAGTTGAGA; nt 485–496, sequence AGGCATCTGTCT; nt 832–843, sequence CTCCATATGCTG); GC, GC rich motif nt 759–763, (sequence CCCCC; nt 602–606, sequence GGCGG); TATA, TATA box (nt 790–797, sequence AATAAATA); Inr, initiator element (nt 807–812, sequence CTCAGA). Cartoon is not drawn to scale. (C) Relative promoter expression levels of truncated 22q11.23 LTR Hs constructs in Tera-1 cells (Kruskal-Wallis, * p < 0.05, ** p < 0.01). All luciferase experiments were conducted in triplicate and are shown as mean ± standard deviation. (D) Schematic of promoter motifs found in the 22q11.21 provirus 5’ LTR Hs, the 22q11.23 LTR Hs and 22q11.23 provirus 5’ LTR 5B. Crossed out boxes indicate presence of a mutation in the motif as compared to the canonical sequence. Cartoon is not drawn to scale.

References

    1. Boeke J.D., Stoye J.S. Retrotransposons, Endogenous Retroviruses, and the Evolution of Retroelements. In: Coffin J.M., Hughes S.H., Varmus H.E., editors. Retroviruses. Cold Spring Harbor Laboratory Press; Cold Spring Harbor, NY, USA: 1997. pp. 343–435. - PubMed
    1. Bannert N., Kurth R. The Evolutionary Dynamics of Human Endogenous Retroviral Families. Annu. Rev. Genomics Hum. Genet. 2006;7:149–173. doi: 10.1146/annurev.genom.7.080505.115700. - DOI - PubMed
    1. Jern P., Coffin J.M. Effects of Retroviruses on Host Genome Function. Annu. Rev. Genet. 2008;42:709–732. doi: 10.1146/annurev.genet.42.110807.091501. - DOI - PubMed
    1. Hughes J.F., Coffin J.M. Human Endogenous Retrovirus K Solo-Ltr Formation and Insertional Polymorphisms: Implications for Human and Viral Evolution. Proc. Natl. Acad. Sci. USA. 2004;101:1668–1672. doi: 10.1073/pnas.0307885100. - DOI - PMC - PubMed
    1. Subramanian R.P., Wildschutte J.H., Russo C., Coffin J.M. Identification, Characterization, and Comparative Genomic Distribution of the Herv-K (Hml-2) Group of Human Endogenous Retroviruses. Retrovirology. 2011;8:e90. doi: 10.1186/1742-4690-8-90. - DOI - PMC - PubMed

Publication types