. 2015 May;1853(5):1229-39.
doi: 10.1016/j.bbamcr.2015.02.023. Epub 2015 Mar 6.

P21 activated kinase-1 mediates transforming growth factor β1-induced prostate cancer cell epithelial to mesenchymal transition

Affiliations

P21 activated kinase-1 mediates transforming growth factor β1-induced prostate cancer cell epithelial to mesenchymal transition

Ahmad Al-Azayzih et al. Biochim Biophys Acta. 2015 May.

Abstract

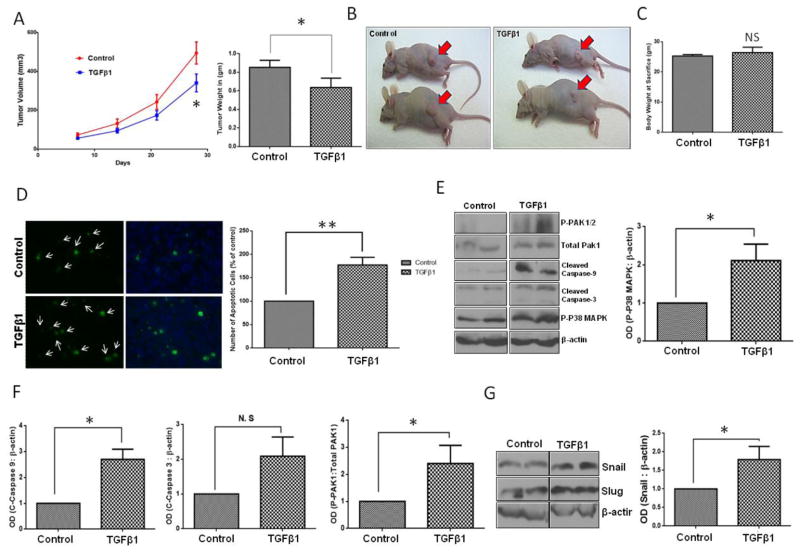
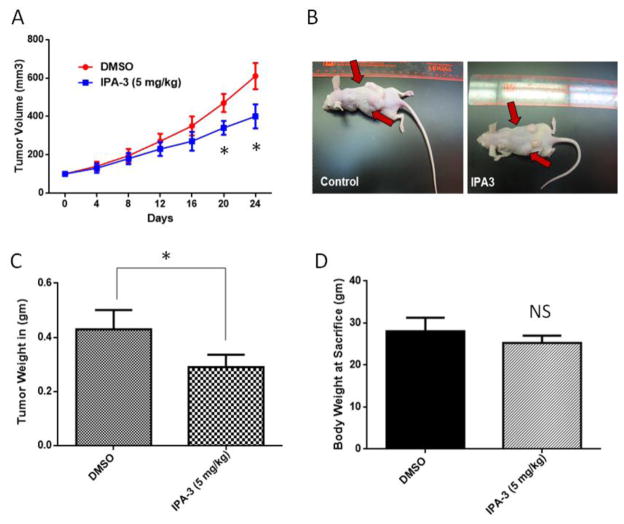
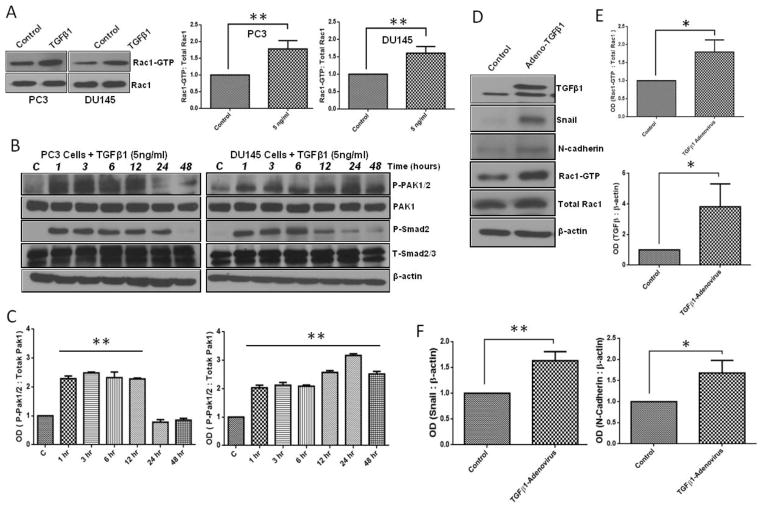
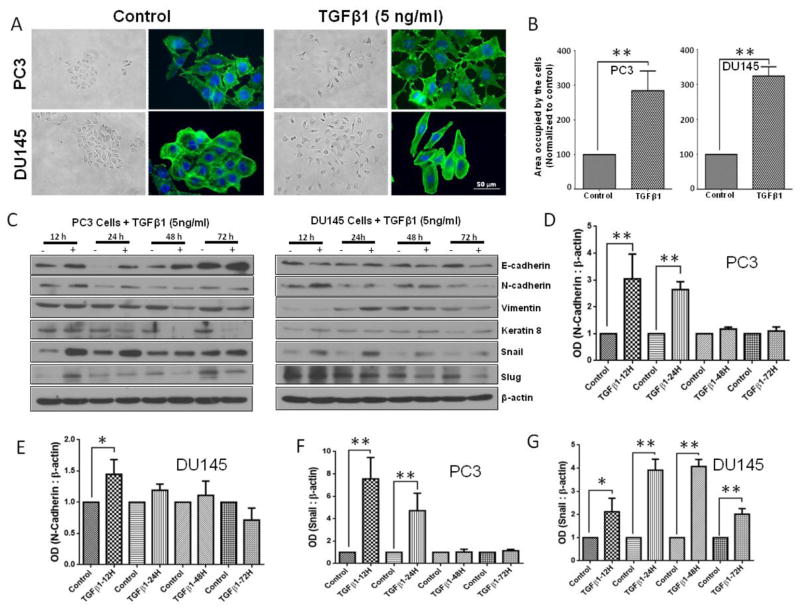
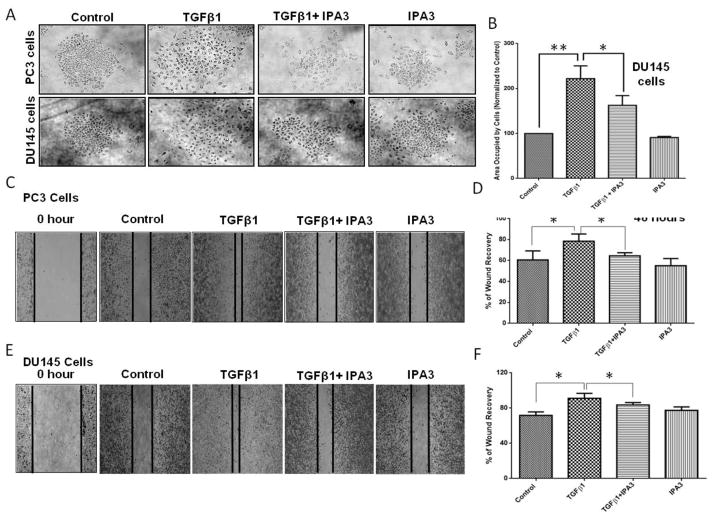
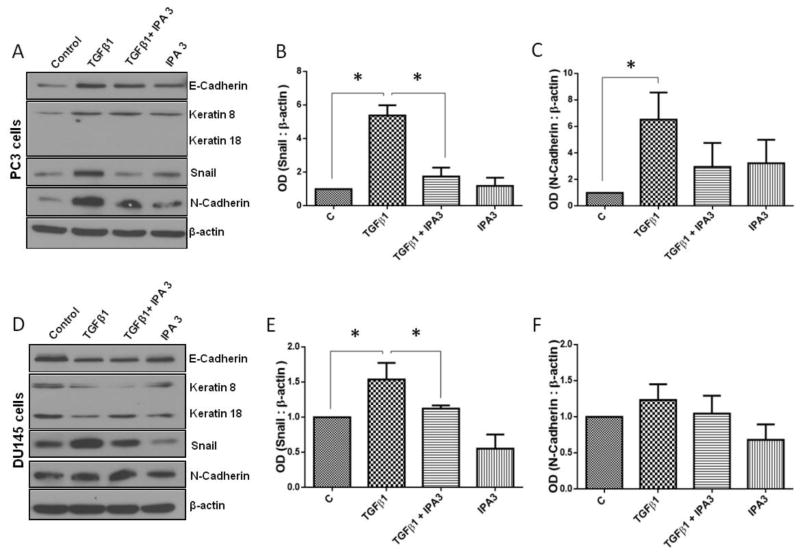
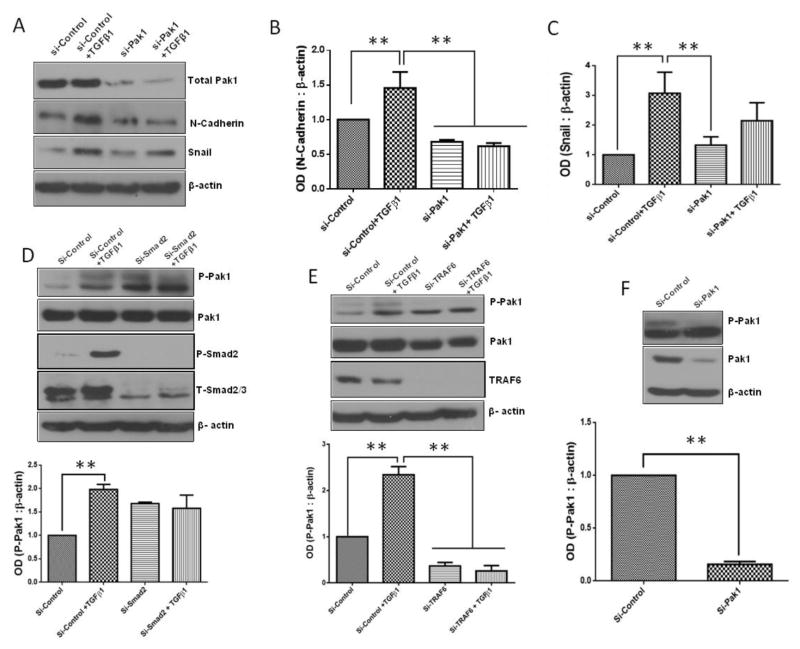
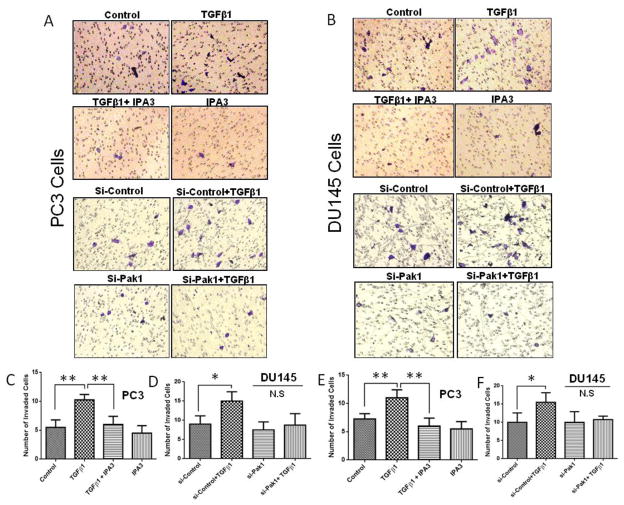
Transforming growth factor beta (TGFβ) is believed to play a dual role in prostate cancer. Molecular mechanism by which TGFβ1 suppresses early prostate tumor growth and induces epithelial-to-mesenchymal transition (EMT) in advanced stages is not known. We determined if P21-activated kinase1 (Pak1), which mediates cytoskeletal remodeling is necessary for the TGFβ1 induced prostate cancer EMT. Effects of TGFβ1 on control prostate cancer PC3 and DU145 cells and those with IPA 3 and siRNA mediated Pak1 inhibition were tested for prostate tumor xenograft in vivo and EMT in vitro. TGFβ1 inhibited PC3 tumor xenograft growth via activation of P38-MAPK and caspase-3, 9. Long-term stimulation with TGFβ1 induced PC3 and DU145 cell scattering and increased expression of EMT markers such as Snail and N-cadherin through tumor necrosis factor receptor-associated factor-6 (TRAF6)-mediated activation of Rac1/Pak1 pathway. Selective inhibition of Pak1 using IPA 3 or knockdown using siRNA both significantly inhibited TGFβ1-induced prostate cancer cell EMT and expression of mesenchymal markers. Our study demonstrated that TGFβ1 induces apoptosis and EMT in prostate cancer cells via activation of P38-MAPK and Rac1/Pak1 respectively. Our results reveal the potential therapeutic benefits of targeting TGFβ1-Pak1 pathway for advanced-stage prostate cancer.

Keywords: EMT; Pak1; Prostate cancer; Snail; TGFβ.


Conflict of interest statement

Conflicts of interest

The authors have declared that no conflicts of interest exist.

Figures

Figure 1
Figure 1. TGFβ1 overexpression results in the growth inhibition of prostate tumor xenografts
A. Figure showing tumor volume (left) and weight (right) analysis of the PC3 tumor xenografts bearing either Ad-GFP or Ad-TGFβ1 overexpression. B. Representative images of xenograft tumor in both control and TGFβ1 overexpression groups (n= 6) C. Bar graph representing mice body weight on the date of tumor collection. D. Pictures showing TUNEL staining (green), DAPI (blue) and bar graph indicating prostate cancer cell apoptosis in tumor xenograft sections taken from either control or TGFβ1 overexpressing tumors (n= 6). E. Western blot images of control and Ad-TGFβ1 expressing PC3 tumor xenograft lysates showing expression levels of p-p38 MAPK, cleaved caspase 3, cleaved caspase 9, p-PAK1, and total PAK1 normalized to β-actin (left) and bar graph representing optical densitometry measurements of p-p38-MAPK expression normalized to β-actin (right) (n= 4). F. Bar graphs representing optical densitometry measurements of cleaved caspase-9, cleaved caspase-3 and phosphorylated Pak1expressions in prostate tumor xenografts normalized to β-actin (n= 3). G. Western blot image of Snail and slug expressions in prostate tumor xenografts (left) and bar graph representing optical densitometry measurements of Snail expression (right) normalized to β-actin (n= 3).*p<0.05 and **P<0.01, Data presented as Mean ± SEM.
Figure 2
Figure 2. Treatment with IPA 3 results in the growth inhibition of prostate tumor xenografts
A. Panel showing tumor volume measurements from Day 0 to Day 24 (left) and representative pictures of tumor xenograft from DMSO or IPA 3 (5mg/Kg) treatments groups on Day 24 (n= 4–5) (right). B. Bar graph showing weights of tumors from mice treated with either DMSO or IPA 3 (5mg/Kg) collected on Day 24. C. Bar graph representing mice body weight on the date of tumor collection. (n= 4–5). *p<0.05 and **P<0.01, Data presented as Mean ± SEM.
Figure 3
Figure 3. TGFβ1 treatment enhances Rac1-mediated Pak1 activation and expression of mesenchymal markers (Snail and N-cadherin) in prostate cancer cells
A. Western blot images of active Rac1 (Rac1-GTP) bands after one time treatments with TGFβ1 (5ng/ml) or control vehicle in PC3 and DU145 cells (left) and Bar graphs showing band densitometry analysis of Rac1-GTP expressions normalized to β-actin after treatment of PC3 and DU145 cells with or without TGFβ1 (5 ng/ml) for 24 h (right) (n= 4). B. Representative Western blot images of P-PAK1/2, Total Pak1, P-smad2/3, T-Smad after one time treatments with TGFβ1 (5ng/ml) or vehicle for 1, 3, 6, 12, 24 and 48 h in PC3 and DU145 cells. C. Bar graphs showing band densitometry analysis P-PAK1/2 normalized to total Pak1 after treatment with TGFβ1 (5ng/ml) or PBS for 1, 3, 6, 12, 24 and 48 h in PC3 and DU145 cells, respectively (n= 4). D. Representative Western blot images of EMT marker expression and active Rac1-GTP in PC3 cells after being subjected to infection with either control Ad-GFP or Ad-TGFβ1. E. Bar graphs representing optical densitometry measurements for Rac1-GTP and TGFβ expression levels in PC3 cells after 48 h post transfection (n= 4). E. Bar graphs representing optical densitometry measurements of Snail and N-cadherin expressions, respectively, in PC3 cells 48 h post-transfection with Ad-GFP or Ad-TGFβ1 (n= 4). *p<0.05 and **P<0.01, Data presented as Mean ± SEM.
Figure 4
Figure 4. TGFβ1 enhances Snail and N-cadherin expression, and EMT in prostate cancer cells
A. Representative images showing the effect of TGFβ1 (5 ng/ml for 3 days) on stress fiber formation (phalloidin staining) in PC3 and DU145 cells (x 40 magnification) and phase-contrast images showing the effect of TGFβ1 (5 ng/ml) on cell scattering in both cell lines (x 20 magnification). B. Bar graphs showing quantification of the cell scattering data in PC3 (left) and DU145 (right) cells (n= 4). C. Representative Western blot images of E-Cadherin, Keratin 8, N-cadherin, Vimentin, Snail, and Slug after one time treatment with TGFβ1 (5ng/ml) or no treatment for 12, 24, 48, and 72 h in PC3 and DU145 cells. D. Bar graph showing optical band densitometry analysis of N-cadherin expression in PC3 cells, after one time treatment with TGFβ1 (5ng/ml) or no treatment for 12, 24, 48, and 72 h normalized to β-actin (n= 4). E. Bar graph showing optical band densitometry analysis of N-cadherin expression in DU145 cells, after one time treatment with TGFβ1 (5ng/ml) or no treatment for 12, 24, 48, and 72 h normalized to β-actin (n= 4). F. Bar graph showing optical band densitometry analysis of Snail expression in PC3 cells, after treatments with TGFβ1 (5ng/ml) or no treatment for 12, 24, 48, and 72 h normalized to β-actin (n= 4). G. Bar graph showing optical band densitometry analysis of Snail expression in DU145 cells, after treatments with TGFβ1 (5ng/ml) or no treatment for 12, 24, 48, and 72 h normalized to β-actin (n= 4). *p<0.05 and **P<0.01, Data presented as Mean ± SEM.
Figure 5
Figure 5. Pharmacological inhibition of Pak1 with IPA 3 inhibits TGFβ1-induced EMT-associated morphological changes, cell scattering, and motility in prostate cancer cells
A. Representative images of PC3 and DU145 cell scattering following 72 h treatments with TGFβ1 (5 ng/ml), or IPA 3 (15 μM), or a combination. B. Bar graph showing quantification of the cell scattering in DU145 cells as treated above (n= 4). C and D. Representative images and bar graph of PC3 cell migration following 48 h treatments of TGFβ1 (5 ng/ml), IPA 3 (15 μM), or a combination (n= 4). E and F. Representative images and bar graph of DU145 cell migration following 48 h treatments of TGFβ1 (5 ng/ml), IPA 3 (15 μM), or a combination (n= 4). *p<0.05 and **P<0.01, Data presented as Mean ± SEM.
Figure 6
Figure 6. IPA 3, Selective Pak1 inhibitor inhibits TGFβ1-mediated EMT in prostate cancer cells
A, Representative Western blot images of EMT marker expression in PC3 cells following 72 h treatments with TGFβ1 (5 ng/ml), IPA 3 (15 μM), or combination, with treatments repeated every 24 hours. B and C. Bar graph representing optical densitometry for mesenchymal markers, Snail and N-Cadherin expressions respectively in PC3 cells following 72 h treatments with TGFβ1 (5 ng/ml), IPA 3 (15 μM), or combination (n= 3). D, Representative Western blot images of EMT markers expression in DU145 cells following 72 h treatments with TGFβ1 (5 ng/ml), IPA 3 (15 μM), or combination. E and F. Bar graph representing optical densitometry of mesenchymal markers, Snail and N-Cadherin expressions respectively in DU145 cells following 72 h treatments with TGFβ1 (5 ng/ml), IPA 3 (15 μM), or combination (n= 3). *p<0.05, Data presented as Mean ± SEM.
Figure 7
Figure 7. Selective Pak1 knockdown in PC3 cells inhibits EMT marker expression induced by TGFβ1 treatment involving TRAF6 pathway
A. Representative Western blot images showing EMT marker expression in PC3 cells after being subjected to either control siRNA or Pak1 siRNA for 48 h followed by treatment with or without TGFβ1 (5ng/ml) for 24 h. B and C. Bar graphs representing optical densitometry measurements for mesenchymal marker expression (N-Cadherin and Snail, respectively) in either Control-siRNA or Pak1 siRNA transfected PC3 cells (n= 3). D. Representative Western blot images and bar graph showing changes in the phosphorylation of Pak1 with the Si-RNA-mediated knockdown of Smad2 for 48 h followed by treatment with or without TGFβ1 (5ng/ml) for 24 h in PC3 cells, compared to Si-Control (n= 3). E. Representative Western blot images bar graph showing optical densitometry measurements for phosphorylated Pak1 in Control-siRNA or TRAF6 SiRNA transfected PC3 cells (n= 3). F. Representative Western blot image and bar graph showing changes in the Pak1 phosphorylation in PC3 cells with Pak1 knockdown (n= 3).*p<0.05 and **P<0.01, Data presented as Mean ± SEM.
Figure 8
Figure 8. IPA-3, Selective Pak1 inhibitor or Pak1 knockdown prevents TGFβ1-mediated prostate cancer cells invasion
A. Representative images of transwell plates following invasion assay of PC3 cells subjected to either IPA 3 treatment or Pak1 knockdown. B, Representative images of transwell plates following invasion assay of DU145 cells after subjected to either IPA 3 treatment or Pak1 knockdown. C and D. Bar graphs showing PC3 cell invasion (cells/field) after either IPA 3 treatment or Pak1 knockdown (n= 4). E and F, Bar graphs showing DU145 cell invasion (cells/field) after subjected to either IPA 3 treatment or Pak1 knockdown (n= 4). *p<0.05 and **P<0.01, Data presented as Mean ± SEM.

Similar articles

Cited by

References

    1. Ahmed T, Shea K, Masters JR, Jones GE, Wells CM. A PAK4-LIMK1 pathway drives prostate cancer cell migration downstream of HGF. Cell Signal. 2008;20:1320–1328. - PubMed
    1. Akhurst RJ, Derynck R. TGF-beta signaling in cancer--a double-edged sword. Trends Cell Biol. 2001;11:S44–51. - PubMed
    1. Al-Azayzih A, Gao F, Goc A, Somanath PR. TGFbeta1 induces apoptosis in invasive prostate cancer and bladder cancer cells via Akt-independent, p38 MAPK and JNK/SAPK-mediated activation of caspases. Biochem Biophys Res Commun. 2012;427:165–170. - PMC - PubMed
    1. Alhusban A, Al-Azayzih A, Goc A, Gao F, Fagan SC, Somanath PR. Clinically relevant doses of candesartan inhibit growth of prostate tumor xenografts in vivo through modulation of tumor angiogenesis. J Pharmacol Exp Ther. 2014;350:635–645. - PMC - PubMed
    1. Arias-Romero LE, Villamar-Cruz O, Huang M, Hoeflich KP, Chernoff J. Pak1 kinase links ErbB2 to beta-catenin in transformation of breast epithelial cells. Cancer Res. 2013;73:3671–3682. - PMC - PubMed

Publication types

MeSH terms