

Metabolic Profiling of Geobacter sulfurreducens during Industrial Bioprocess Scale-Up
- PMID: 25746987
- PMCID: PMC4407208
- DOI: 10.1128/AEM.00294-15
Metabolic Profiling of Geobacter sulfurreducens during Industrial Bioprocess Scale-Up
Abstract
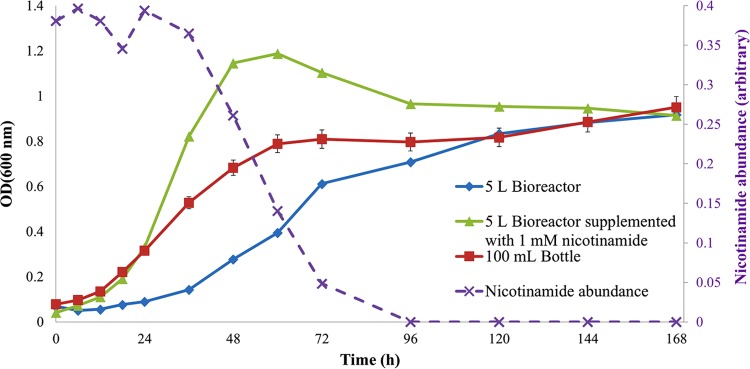
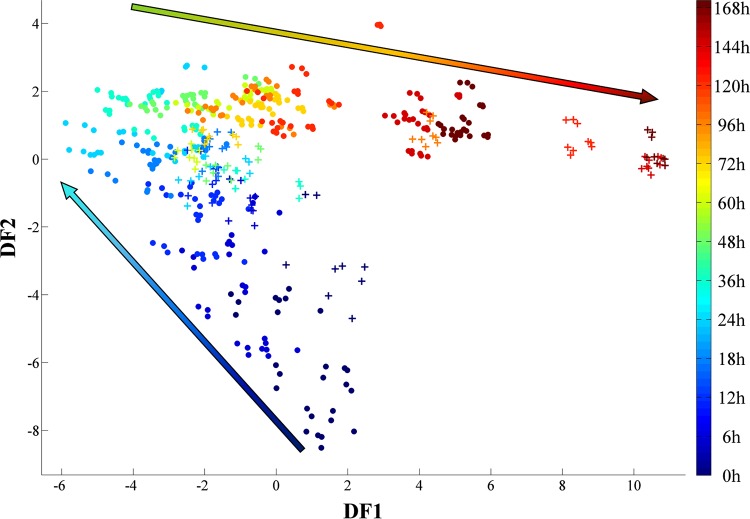
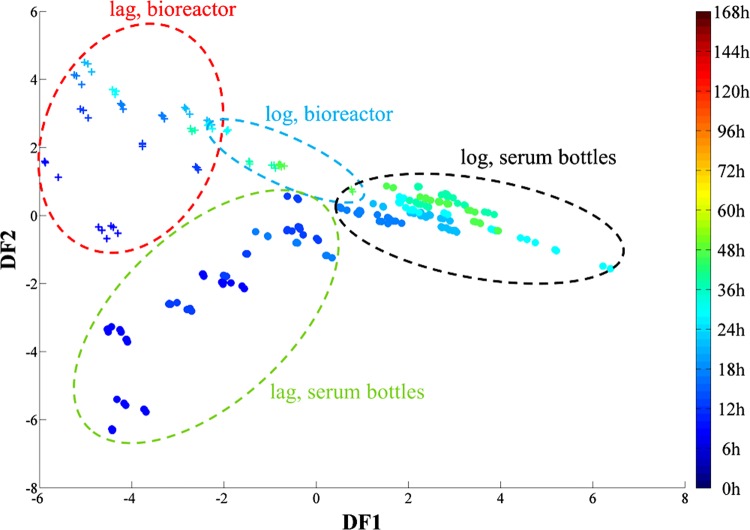
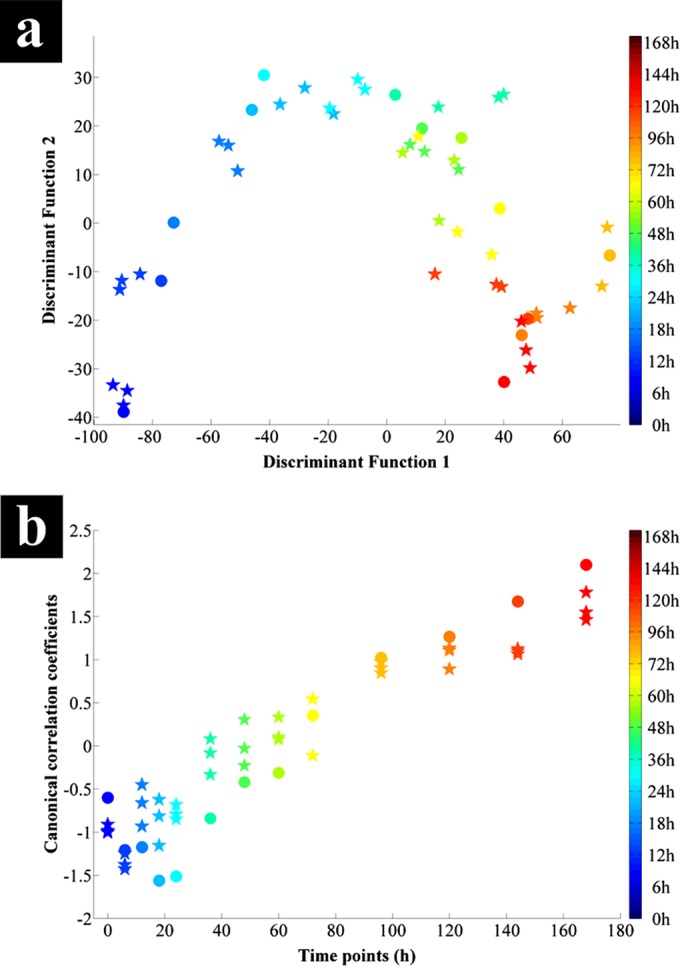
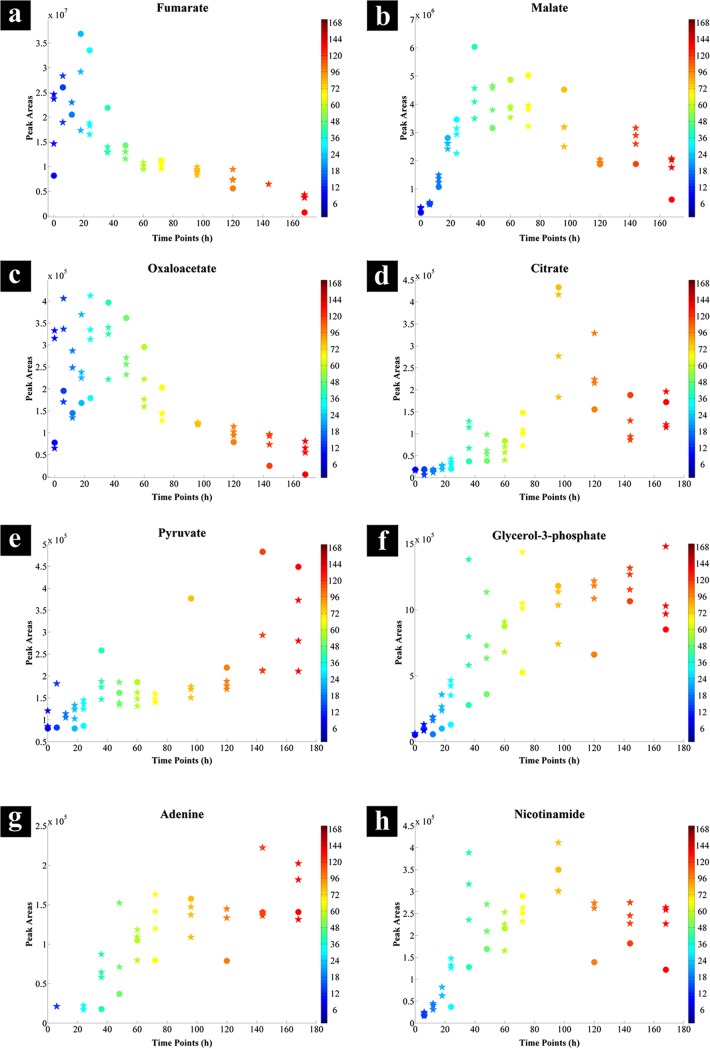
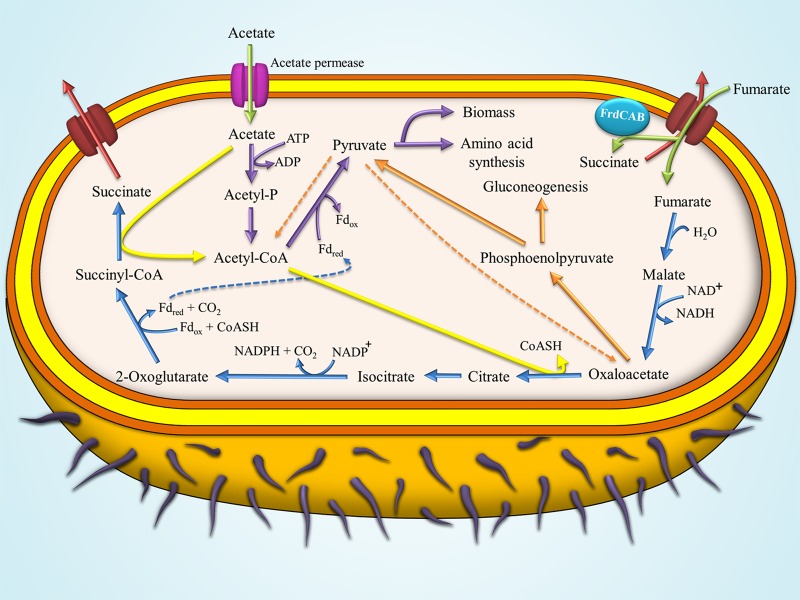
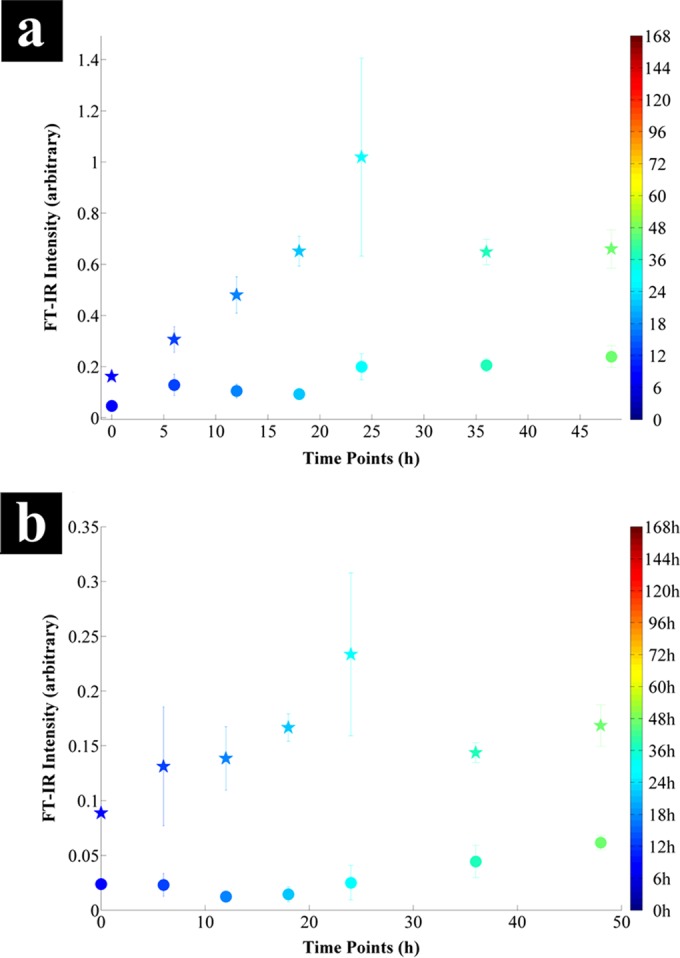
During the industrial scale-up of bioprocesses it is important to establish that the biological system has not changed significantly when moving from small laboratory-scale shake flasks or culturing bottles to an industrially relevant production level. Therefore, during upscaling of biomass production for a range of metal transformations, including the production of biogenic magnetite nanoparticles by Geobacter sulfurreducens, from 100-ml bench-scale to 5-liter fermentors, we applied Fourier transform infrared (FTIR) spectroscopy as a metabolic fingerprinting approach followed by the analysis of bacterial cell extracts by gas chromatography-mass spectrometry (GC-MS) for metabolic profiling. FTIR results clearly differentiated between the phenotypic changes associated with different growth phases as well as the two culturing conditions. Furthermore, the clustering patterns displayed by multivariate analysis were in agreement with the turbidimetric measurements, which displayed an extended lag phase for cells grown in a 5-liter bioreactor (24 h) compared to those grown in 100-ml serum bottles (6 h). GC-MS analysis of the cell extracts demonstrated an overall accumulation of fumarate during the lag phase under both culturing conditions, coinciding with the detected concentrations of oxaloacetate, pyruvate, nicotinamide, and glycerol-3-phosphate being at their lowest levels compared to other growth phases. These metabolites were overlaid onto a metabolic network of G. sulfurreducens, and taking into account the levels of these metabolites throughout the fermentation process, the limited availability of oxaloacetate and nicotinamide would seem to be the main metabolic bottleneck resulting from this scale-up process. Additional metabolite-feeding experiments were carried out to validate the above hypothesis. Nicotinamide supplementation (1 mM) did not display any significant effects on the lag phase of G. sulfurreducens cells grown in the 100-ml serum bottles. However, it significantly improved the growth behavior of cells grown in the 5-liter bioreactor by reducing the lag phase from 24 h to 6 h, while providing higher yield than in the 100-ml serum bottles.
Copyright © 2015, American Society for Microbiology. All Rights Reserved.
Figures
Similar articles
-
Growth of Geobacter sulfurreducens under nutrient-limiting conditions in continuous culture.Environ Microbiol. 2005 May;7(5):641-8. doi: 10.1111/j.1462-2920.2005.00731.x. Environ Microbiol. 2005. PMID: 15819846
-
The proteome of dissimilatory metal-reducing microorganism Geobacter sulfurreducens under various growth conditions.Biochim Biophys Acta. 2006 Jul;1764(7):1198-206. doi: 10.1016/j.bbapap.2006.04.017. Epub 2006 May 16. Biochim Biophys Acta. 2006. PMID: 16797259
-
Influence of fumarate on interspecies electron transfer and the metabolic shift induced in Clostridium pasteurianum by Geobacter sulfurreducens.J Appl Microbiol. 2024 May 1;135(5):lxae122. doi: 10.1093/jambio/lxae122. J Appl Microbiol. 2024. PMID: 38749675
-
Tale of two metal reducers: comparative proteome analysis of Geobacter sulferreducens PCA and Shewanella oneidensis MR-1.Methods Biochem Anal. 2006;49:97-111. Methods Biochem Anal. 2006. PMID: 16929676 Review.
-
Coupled metabolic-hydrodynamic modeling enabling rational scale-up of industrial bioprocesses.Biotechnol Bioeng. 2020 Mar;117(3):844-867. doi: 10.1002/bit.27243. Epub 2019 Dec 20. Biotechnol Bioeng. 2020. PMID: 31814101 Review.
Cited by
-
Evaluation of Sample Preparation Methods for Inter-Laboratory Metabolomics Investigation of Streptomyces lividans TK24.Metabolites. 2020 Sep 22;10(9):379. doi: 10.3390/metabo10090379. Metabolites. 2020. PMID: 32972026 Free PMC article.
-
Geobacter sulfurreducens metabolism at different donor/acceptor ratios.Microbiologyopen. 2022 Oct;11(5):e1322. doi: 10.1002/mbo3.1322. Microbiologyopen. 2022. PMID: 36314758 Free PMC article.
-
Simultaneous Raman and Infrared Spectroscopy of Stable Isotope Labelled Escherichia coli.Sensors (Basel). 2022 May 22;22(10):3928. doi: 10.3390/s22103928. Sensors (Basel). 2022. PMID: 35632337 Free PMC article.
-
Biomineralization of Cu2S Nanoparticles by Geobacter sulfurreducens.Appl Environ Microbiol. 2020 Sep 1;86(18):e00967-20. doi: 10.1128/AEM.00967-20. Print 2020 Sep 1. Appl Environ Microbiol. 2020. PMID: 32680873 Free PMC article.
-
Targeted redox and energy cofactor metabolomics in Clostridium thermocellum and Thermoanaerobacterium saccharolyticum.Biotechnol Biofuels. 2017 Nov 30;10:270. doi: 10.1186/s13068-017-0960-4. eCollection 2017. Biotechnol Biofuels. 2017. PMID: 29213318 Free PMC article.
References
-
- Methe BA, Nelson KE, Eisen JA, Paulsen IT, Nelson W, Heidelberg JF, Wu D, Wu M, Ward N, Beanan MJ, Dodson RJ, Madupu R, Brinkac LM, Daugherty SC, DeBoy RT, Durkin AS, Gwinn M, Kolonay JF, Sullivan SA, Haft DH, Selengut J, Davidsen TM, Zafar N, White O, Tran B, Romero C, Forberger HA, Weidman J, Khouri H, Feldblyum TV, Utterback TR, Van Aken SE, Lovley DR, Fraser CM. 2003. Genome of Geobacter sulfurreducens: metal reduction in subsurface environments. Science 302:1967–1969. doi:10.1126/science.1088727. - DOI - PubMed
-
- Lovley DR. 2002. Dissimilatory metal reduction: from early life to bioremediation. ASM News 68:231–237.
-
- Lovley DR, Stolz JF, Nord GL, Phillips EJP. 1987. Anaerobic production of magnetite by a dissimilatory iron-reducing microorganism. Nature 330:252–254. doi:10.1038/330252a0. - DOI
Publication types
MeSH terms
Substances
Grants and funding
LinkOut - more resources
Full Text Sources
Miscellaneous
