

Equating accelerometer estimates among youth: The Rosetta Stone 2
- PMID: 25747468
- PMCID: PMC5381708
- DOI: 10.1016/j.jsams.2015.02.006
Equating accelerometer estimates among youth: The Rosetta Stone 2
Abstract
Objectives: Different accelerometer cutpoints used by different researchers often yields vastly different estimates of moderate-to-vigorous intensity physical activity (MVPA). This is recognized as cutpoint non-equivalence (CNE), which reduces the ability to accurately compare youth MVPA across studies. The objective of this research is to develop a cutpoint conversion system that standardizes minutes of MVPA for six different sets of published cutpoints.
Design: Secondary data analysis.
Methods: Data from the International Children's Accelerometer Database (ICAD; Spring 2014) consisting of 43,112 Actigraph accelerometer data files from 21 worldwide studies (children 3-18 years, 61.5% female) were used to develop prediction equations for six sets of published cutpoints. Linear and non-linear modeling, using a leave one out cross-validation technique, was employed to develop equations to convert MVPA from one set of cutpoints into another. Bland Altman plots illustrate the agreement between actual MVPA and predicted MVPA values.
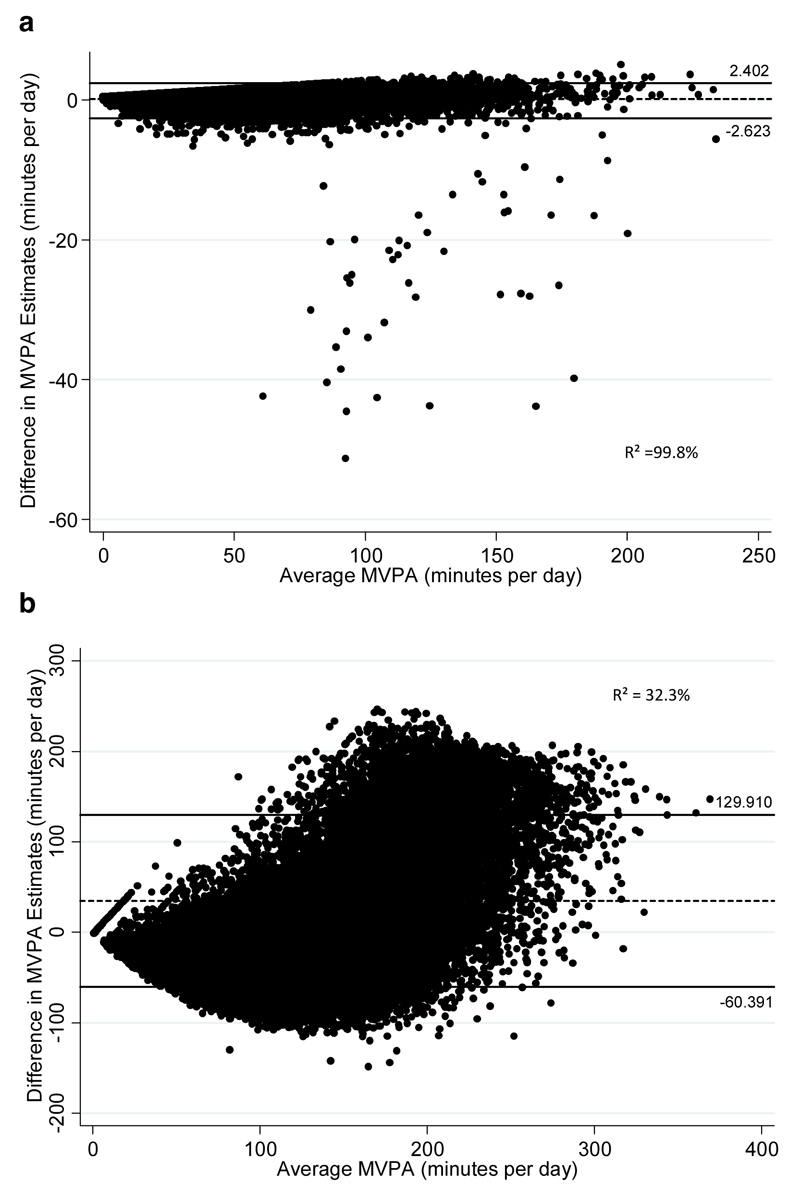
Results: Across the total sample, mean MVPA ranged from 29.7MVPAmind(-1) (Puyau) to 126.1MVPAmind(-1) (Freedson 3 METs). Across conversion equations, median absolute percent error was 12.6% (range: 1.3 to 30.1) and the proportion of variance explained ranged from 66.7% to 99.8%. Mean difference for the best performing prediction equation (VC from EV) was -0.110mind(-1) (limits of agreement (LOA), -2.623 to 2.402). The mean difference for the worst performing prediction equation (FR3 from PY) was 34.76mind(-1) (LOA, -60.392 to 129.910).
Conclusions: For six different sets of published cutpoints, the use of this equating system can assist individuals attempting to synthesize the growing body of literature on Actigraph, accelerometry-derived MVPA.
Keywords: Children; Cutpoints; MVPA; Measurement; Policy; Public health.
Copyright © 2015 Sports Medicine Australia. Published by Elsevier Ltd. All rights reserved.
Figures
References
-
- Reilly JJ, Penpraze V, Hislop J, et al. Objective measurement of physical activity and sedentary behaviour: review with new data. Arch Dis Child. 2008;93(7):614–619. - PubMed
-
- Cliff DP, Okely AD. Comparison of two sets of accelerometer cut-off points for calculating moderate-to-vigorous physical activity in young children. J Phys Act Health. 2007;4(4):509. - PubMed
-
- Trost SG, McIver KL, Pate RR. Conducting accelerometer-based activity assessments in field-based research. Med Sci Sport Exerc. 2005;37(11 Suppl):S531–543. - PubMed
-
- Kim Y, Beets MW, Welk GJ. Everything you wanted to know about selecting the “right” Actigraph accelerometer cut-points for youth, but…: a systematic review. J Sci Med Sport. 2012;15(4):311–321. - PubMed
-
- Trost SG. State of the art reviews: measurement of physical activity in children and adolescents. AM J Lifestyle Med. 2007;1(4):299–314.
Publication types
MeSH terms
Grants and funding
LinkOut - more resources
Full Text Sources
Other Literature Sources
Medical
