. 2015 Apr:138:279-90.
doi: 10.1016/j.envres.2015.01.019. Epub 2015 Mar 4.

Impact of ferromanganese alloy plants on household dust manganese levels: implications for childhood exposure

Affiliations

Impact of ferromanganese alloy plants on household dust manganese levels: implications for childhood exposure

E L Lucas et al. Environ Res. 2015 Apr.

Abstract

Adolescents living in communities with ferromanganese alloy plant activity have been shown to exhibit deficits in olfactory and fine motor function. Household dust may serve as an important manganese (Mn) exposure pathway to children, though dust Mn concentrations have not previously been measured to assess household contamination from ferromanganese alloy plant emissions. Here we determined the association between dust concentrations and surface loadings of Mn and other metals (Al, Cd, Cr, Cu, Fe, Pb, and Zn) in indoor and outdoor household dust from three Italian communities that differ by history of ferromanganese alloy plant activity: Bagnolo Mella, with an active ferromanganese alloy plant (n=178 households); Valcamonica, with historically active plants (n=166); and Garda Lake, with no history of ferromanganese plant activity (n=99). We also evaluated Mn levels in other environmental (soil, airborne particulates) and candidate biomarker (blood, hair, saliva, fingernails) samples from children within the households. Household dust Mn concentrations and surface loadings were significantly different between the three sites, with levels highest in Bagnolo Mella (outdoor median Mn concentration=4620, range 487-183,000µg/g), intermediate in Valcamonica (median=876, range 407-8240µg/g), and lowest in Garda Lake (median=407, range 258-7240µg/g). Outdoor dust Mn concentrations in Bagnolo Mella, but not the other communities, were significantly inversely related with distance from the plant (R(2)=0.6630, P<0.0001). Moreover, outdoor dust Mn concentrations and loadings were highly predictive of but significantly higher than indoor dust Mn concentrations and loadings by ~2 to ~7-fold (Mn concentrations) and ~7 to ~20-fold (Mn loadings). Finally, both indoor and outdoor dust Mn concentrations and outdoor dust Mn loading values were highly significantly correlated with both soil and air Mn concentrations, and with children's hair and fingernail Mn concentrations, but weakly or not associated with saliva or blood Mn levels. Given the evidence associating elevated Mn exposure with neurological impairments in children, these data support that dust Mn levels should be reduced in contaminated environments to protect the health of resident children.

Keywords: Biomarker; Dust; Exposure; Ferroalloy; Manganese.


Figures

Figure 1
Figure 1
Map of study sites in the Province of Brescia, Italy. The red triangles are the locations of each ferroalloy plant. The blue dots are the sampling points. Sellero, Breno and Darfo are located in the valley of Valcamonica.
Figure 2
Figure 2
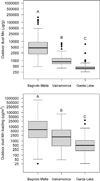
Outdoor household dust Mn concentrations (upper panel, µg/g on log10 scale) and dust Mn loadings (lower panel, (µg Mn/m2 on log10 scale) in the communities with active (Bagnolo Mella, n~142), historic (Valcamonica, n=81) and no history (Garda Lake, n~68) of ferromanganese alloy plant activity. The middle line within each box is the median, the lower and upper margins of the box represent the 25th and 75th percentiles, while the lower and upper whiskers are drawn to the furthest data point within 1.5-times the interquartile range. Boxes with different superscript letters are significantly different from one another, based on Tukey’s post hoc test (p<0.05).
Figure 3
Figure 3
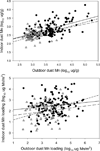
Upper panel: Linear regression of outdoor vs. indoor household dust Mn concentrations across the three study sites: Bagnolo Mella, a community with active ferromanganese plant emissions (filled circles and solid regression line, y = 0.409(x) + 1.371, R2=0.2848, n=137, p<0.0001); Valcamonica, with a past history of past ferromanganese alloy plant activity (grey triangles, long dashed line, y = 0.318(x) + 1.559, R2=0.0923, n=79, P=0.0065), and; Garda Lake, with no history of ferromanganese plant activity (open circles, short dashed line, y = 0.417(x) + 1.170, R2= 0.0889, n=65, P=0.016). Lower panel: Outdoor vs. indoor household dust Mn loadings (log10 µg Mn/m2) across the three study sites: Bagnolo Mella (filled circles and solid regression line, y = 0.132(x) + 1.981, R2=0.0186, n=136, P=0.113); Valcamonica (grey triangles, long dashed line, y = 0.170(x) + 1.429, R2=0.0276, n=79, P=0.143), and Garda Lake (open circles, short dashed line, y = 0.378(x) + 0.813, R2= 0.0992, n=60, P=0.014). Regression lines extended to axis for clarity.
Figure 4
Figure 4
Outdoor dust Mn concentrations vs. distance (km) from the nearest ferromanganese alloy plant for household dust samples from the three study sites: Bagnolo Mella, a community with active ferromanganese plant emissions (filled circles and solid line best fit regression, [Outdoor dust (µg Mn/g) = 2.817 * e(0.4254/(D + 0.5947)); where D=distance in km; R2=0.6630, n=142, p<0.0001]; Valcamonica, with a past history of past ferromanganese alloy plant activity (grey triangles, n=81), and; Garda Lake, with no history of ferromanganese plant activity (open circles, n=68). Regressions for Valcamonica and Garda Lake (not shown) were non-significant.
Figure 5
Figure 5
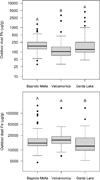
Outdoor household dust Pb (upper panel) and Fe (lower panel) concentrations (µg/g on log10 scale) in the communities with active (Bagnolo Mella, n=142), historic (Valcamonica, n=81) and no history (Garda Lake, n=68) of ferromanganese alloy plant activity. The middle line within each box is the median, the lower and upper margins of the box represent the 25th and 75th percentiles, while the lower and upper whiskers are drawn to the furthest data point within 1.5-times the interquartile range. Boxes with different superscript letters are significantly different from one another, based on Tukey’s post hoc test (p<0.05).
Figure 6
Figure 6
Manganese concentrations in blood (A), saliva (B), hair (C), and fingernails (D) from pre-adolescent subjects age 11 – 14 years (n = number of subjects per biomarker and study site). The middle line within each box is the median, the lower and upper margins of the box represent the 25th and 75th percentiles, while the lower and upper whiskers are drawn to the furthest data point within 1.5-times the interquartile range. Boxes with different superscript letters are significantly different from one another, based on Tukey’s post hoc test (p<0.05).

References

    1. Agency for Toxic Substances and Disease Registry. Toxicological Profile for Manganese. Atlanta: U.S. Department of Health and Human Services; 2012. - PubMed
    1. Al-Awadhi JM, AlShuabi AA. Dust fallout in Kuwait city: Deposition and characterization. Sci. Total. Environ. 2013;461–462:139–148. - PubMed
    1. Al-Khashman OA. The Investigation of metal concentrations in street dust samples in Aqaba city, Jordan. Environ. Geochem. Hlth. 2007;29:197–207. - PubMed
    1. Allott RW, Kelly M, Hewitt CN. A model of environmental behaviour of contaminated dust and its application to determining dust fluxes and residence times. Atmos. Environ. 1994;28:679–687.
    1. Aschner M, Erikson K, Dorman D. Manganese Dosimetry: Species Differences and Implications for Neurotoxicity. Cr. Rev. Toxicol. 2005;35:1–32. - PubMed

Publication types