. 2015 Mar 12;160(6):1169-81.
doi: 10.1016/j.cell.2015.01.050. Epub 2015 Mar 5.

Zygotic genome activation triggers the DNA replication checkpoint at the midblastula transition

Affiliations

Zygotic genome activation triggers the DNA replication checkpoint at the midblastula transition

Shelby A Blythe et al. Cell. .

Abstract

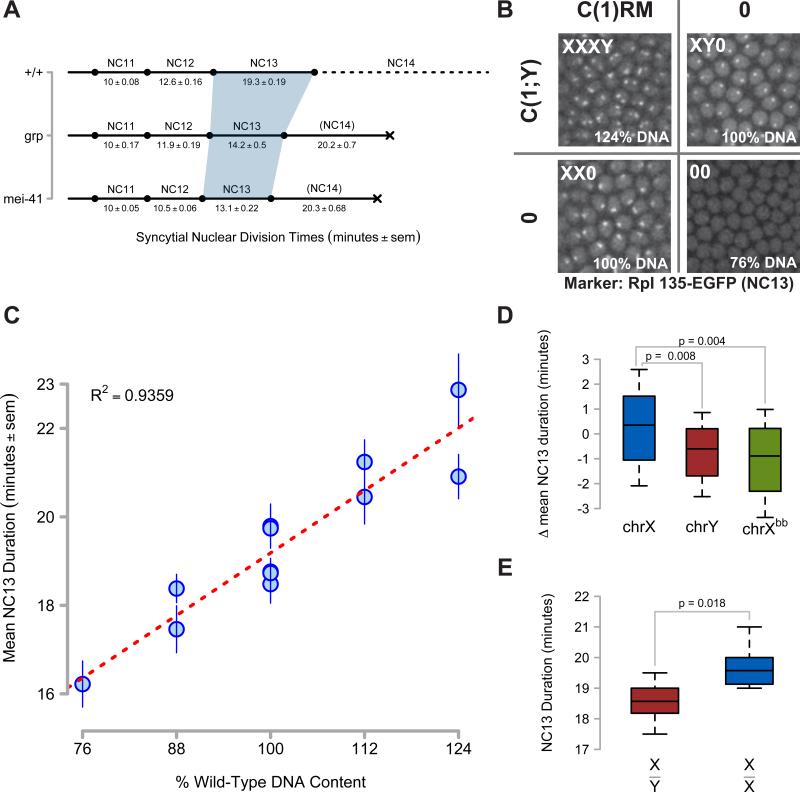
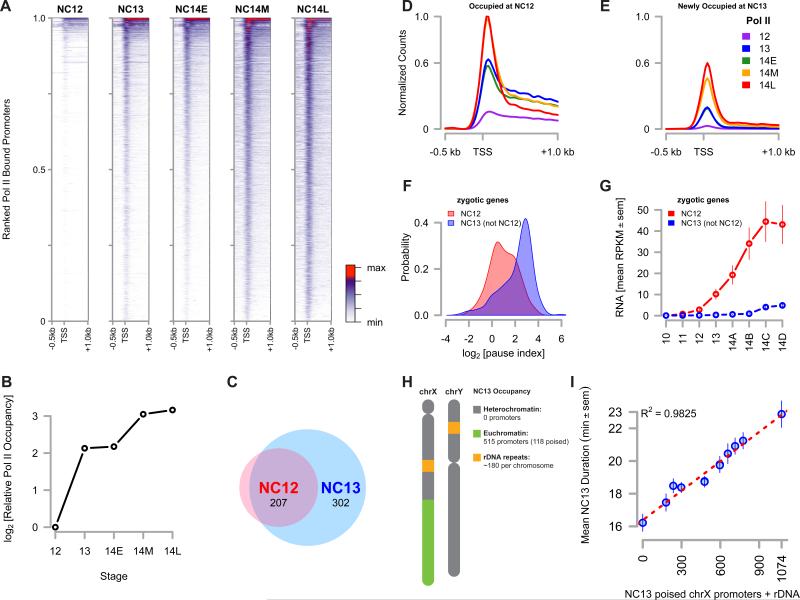
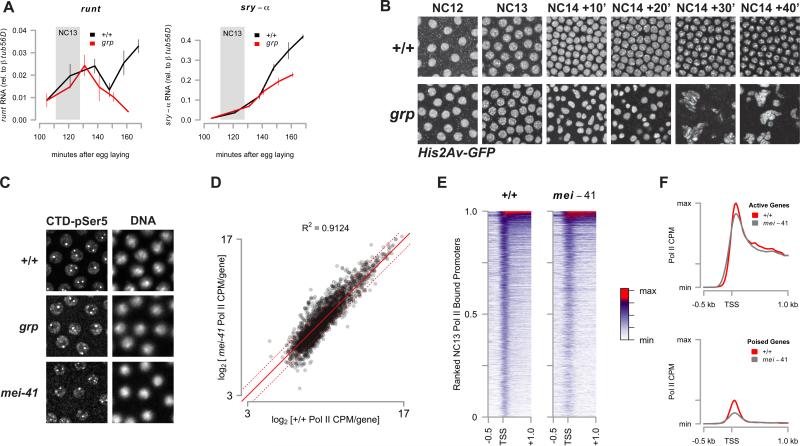
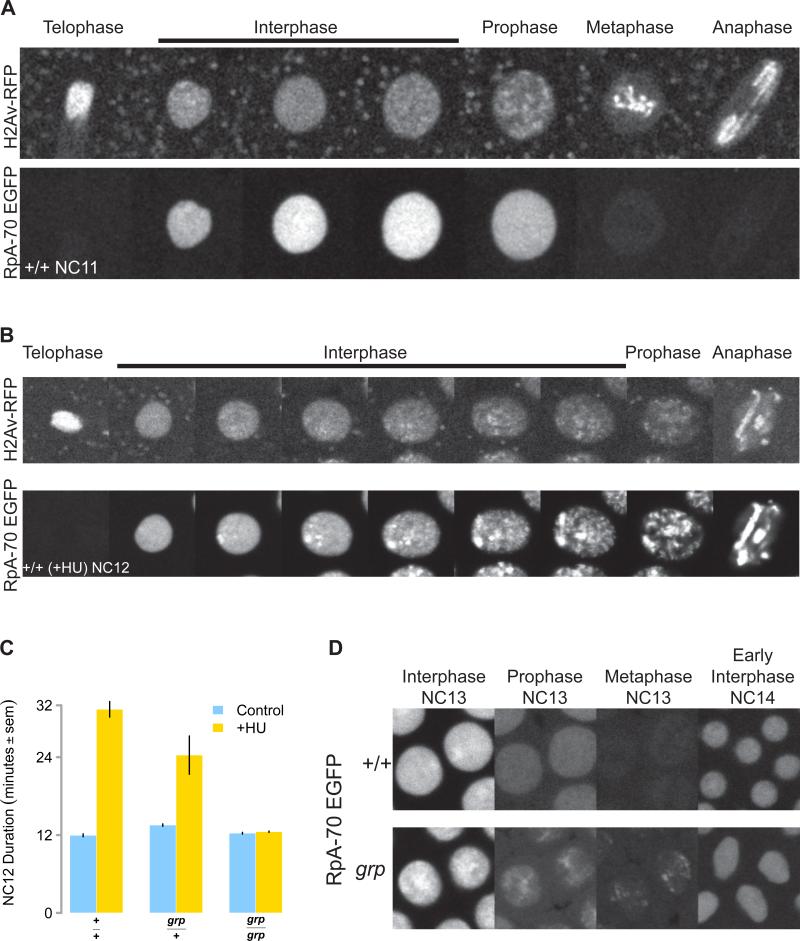
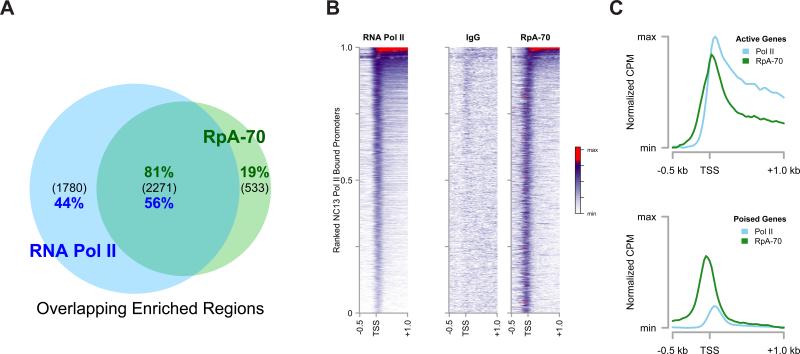
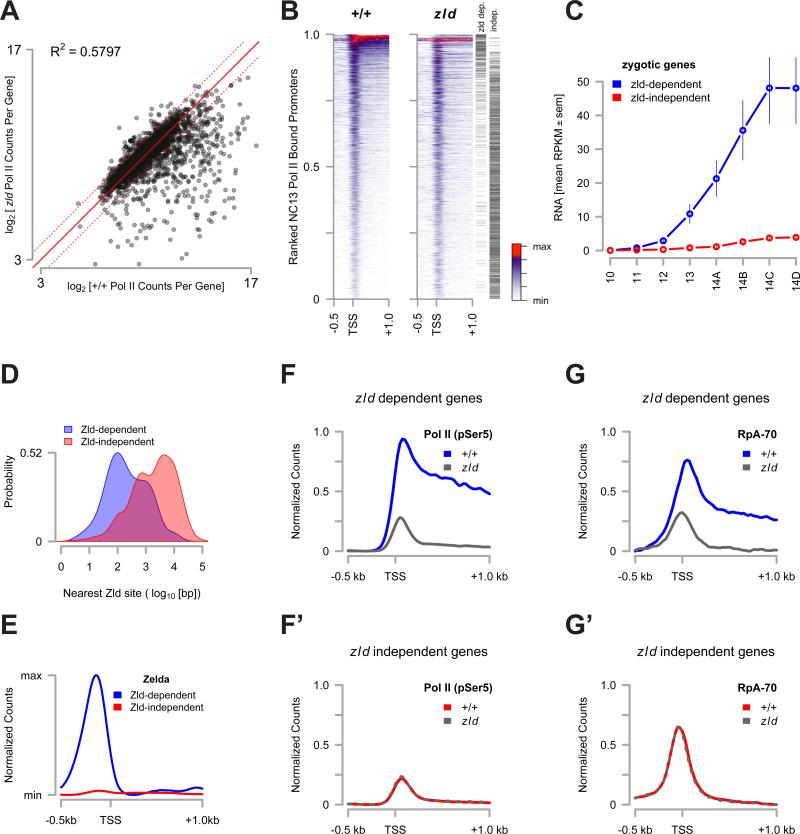
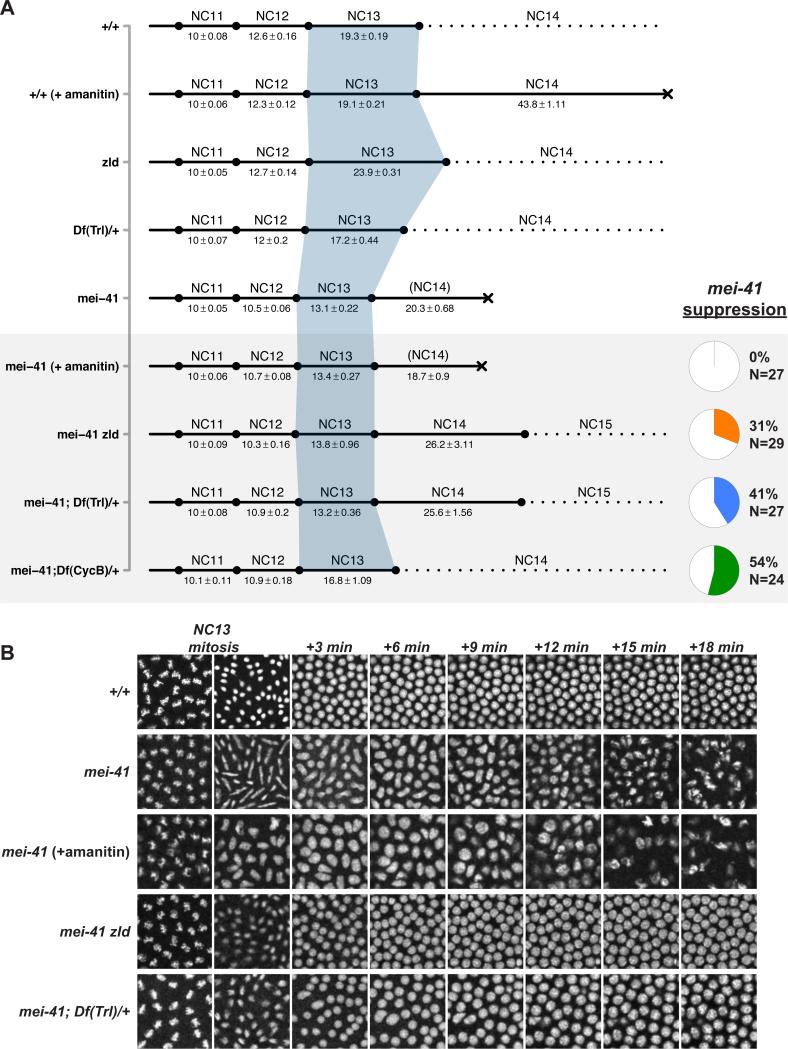
A conserved feature of the midblastula transition (MBT) is a requirement for a functional DNA replication checkpoint to coordinate cell-cycle remodeling and zygotic genome activation (ZGA). We have investigated what triggers this checkpoint during Drosophila embryogenesis. We find that the magnitude of the checkpoint scales with the quantity of transcriptionally engaged DNA. Measuring RNA polymerase II (Pol II) binding at 20 min intervals over the course of ZGA reveals that the checkpoint coincides with widespread de novo recruitment of Pol II that precedes and does not require a functional checkpoint. This recruitment drives slowing or stalling of DNA replication at transcriptionally engaged loci. Reducing Pol II recruitment in zelda mutants both reduces replication stalling and bypasses the requirement for a functional checkpoint. This suggests a model where the checkpoint functions as a feedback mechanism to remodel the cell cycle in response to nascent ZGA.


Figures

Figure 1
Figure 1. Non-Equivalence of Zygotic DNA for MBT Checkpoint Activation
(A) Timelines of syncytial cell cycle times for wild type (+/+), grp1, and mei-41D3/29D embryos were measured by time-lapse confocal microscopy of H2Av-GFP or RFP. The shaded region highlights NC13. Lethality is signified by a black X. (B) Representative confocal images (2500μm2) of nucleolar RNA Pol I GFP expression in NC13 embryos produced from a cross between C(1)RM/0 ; RpI135-EGFP/+ and C(1;Y)1/0 adults. First chromosome dosage is indicated in the upper left of each panel, and the corresponding amount of zygotic genomic DNA is indicated in the bottom left. NC13 nucleolar morphology in XY0 embryos is punctate, whereas it is barbell-shaped in XX0 embryos (See Supplemental Information). No nucleolar RpI135 EGFP is detected at NC13 in 00 embryos. (C) NC13 times were measured for embryos with zygotic DNA dosage between 76% and 124% (see Experimental Procedures). Mean NC13 times ± sem for N ≥ 11 embryos per genotype are plotted as a function of zygotic genomic DNA content. Linear regression is represented as a red line. (D) Box plots showing deviations from mean NC13 time for genotypes differing in chrX (N = 74), chrY (N = 40), or rDNA dosage (Xbb, N = 41). Brackets indicate the results of two-tailed t-tests. (E) NC13 times for male (X/Y, N = 11) and female (X/X, N = 12) embryos produced from w; His2Av-RFP x w, HbP2>GFPnls /Y; + adults. Box plots show the distribution of NC13 times for each genotype. Brackets indicate the results of a two-tailed t-test. See also Figure S1.
Figure 2
Figure 2. Large Scale Recruitment of Poised RNA Pol II at NC13
(A) Promoter-proximal RNA Pol II (CTD pSer5) was plotted for timepoints spanning the MBT. Significantly enriched promoters are ranked from the top to the bottom of the y-axis by high to low mean intensity over the entire timecourse. The x-axis spans −0.5 kb to +1.0 kb and the TSS is noted. The colorbar is at the right hand margin. (B) The sum of normalized Pol II CPM values for each gene in the Drosophila genome was calculated for each timepoint and plotted as an estimate of total Pol II occupancy over the course of MBT. (C) The number of purely zygotic genes present at either NC12 or NC13 was determined and plotted as a venn diagram. (D and E) Mean distributions of Pol II over promoters occupied at NC12 (D) versus promoters newly occupied at NC13 (E) are plotted per timepoint. The y-axis for both plots represents Pol II counts normalized to the maximum count value in both data sets. The maximum count value for genes newly occupied at NC13 is 0.6 and is noted on both axes. (F) A kernel density estimate was plotted for the set of pause indices for each gene in both the ‘bound at NC12’ set (red) or the ‘newly bound at NC13’ set (blue). (G) RPKM values for purely zygotic genes in the ‘bound at NC12’ (red) and the ‘newly bound at NC13’ (blue) sets were extracted from (Lott et al., 2011) and averaged. Mean RPKM values ± sem are plotted from NC10 through NC14. (H) The schematic representation of chrX and Y showing relative quantities of heterochromatic and euchromatic sequences on each. The observed number of promoters occupied and poised at NC13 is annotated on the right. (I) NC13 cell cycle time data for different X-Y chromosome combinations from Figure 1E is re-scaled and plotted according to the sum of poised chrX promoters plus rDNA repeats. Data are represented as mean ± sem with a linear regression (red line). See also Table S1
Figure 3
Figure 3. A Functional Replication Checkpoint is Not Necessary for Zygotic Gene Activation
(A) Quantitative RT-PCR was performed on random-primed cDNA from precisely staged single w; His2Av-GFP (+/+, black) or trans-heterozygous w; grp1/209; His2Av-GFP/+ (grp, red) embryos (N = 3 per timepoint). Mean expression of runt or sry-α mRNA ± sem is quantified relative to expression of β-tubulin 56D mRNA. The period corresponding to NC13 in wild type embryos is highlighted (grey box). (B) Representative time lapse confocal images (2500 μm2) are shown of His2Av-GFP in wild type (+/+, top) and grp1 mutant embryos (bottom) corresponding to the time points in Figure 3A. (C) Staining of RNA Pol II (CTD pSer5) (left) and DNA (DAPI, right) in wild type (+/+, top), grp1 (middle), and mei-41D3/29D (bottom). (D) log2[Pol II CPM] values for genes in the set of NC13-bound promoters were plotted for both wild-type and for mei-41D3 NC13 stage embryos. The solid red line indicates no change between samples and the dotted red lines indicate ±2-fold changes. (E) Promoter-proximal Pol II counts for both wild-type (+/+) and mei-41D3 were plotted as in Figure 2A. (F) Mean promoter-proximal Pol II counts for the set of ‘active’ (upper panel) or ‘poised’ (lower panel) genes in the wild-type (+/+) or mei-41D3 datasets are plotted. The y-axis is identical between plots and is scaled to the maximal value plotted. See also Table S2
Figure 4
Figure 4. RpA-70 EGFP Marks Sites of Stalled Replication
(A) RpA-70 EGFP uniformly localizes to interphase nuclei before NC13. An RpA-70 EGFP; H2Av RFP embryo was imaged by confocal microscopy. Successive representative images of a single NC11 stage nucleus are shown at the cell cycle stages indicated on top. (B) RpA-70 EGFP and H2Av RFP as visualized in a HU-treated embryo by time-lapse confocal microscopy. Successive representative images of a single NC12 nucleus are shown at the cell cycle stages indicated on top. (C) Wild type (+/+), grp/+, and grp mutant embryos were treated with HU and total NC12 duration was measured by time lapse confocal microscopy. (D) Wild type (+/+) and grp mutant embryos expressing RpA-70 EGFP were visualized by time-lapse confocal microscopy. Successive representative images of two nuclei per genotype are shown at the cell cycle stages indicated.
Figure 5
Figure 5. RpA-70 EGFP Co-Localizes with RNA Pol II in NC13 Embryos
(A) Genomic regions significantly enriched by ChIP-seq for RpA-70 or Pol II were identified and intersected to yield a set of co-enriched regions. The total number of peaks in each group is indicated in parenthesis and the percentage of the total for each ChIP is shown (green: RpA-70, blue: Pol II). (B and C) Promoter-by-promoter view of Pol II and RpA-70 localization on NC13 chromatin is shown (B) compared with a control ChIP (IgG). The mean distribution of Pol II and RpA-70 over actively expressed (C, top) and poised (C, bottom) is plotted. To facilitate comparison, mean CPM values per set of co-enriched promoters for each ChIP were calculated and are presented normalized to the maximal value per ChIP and are then floored to the minimum value (Normalized CPM).
Figure 6
Figure 6. Loss of Pol II binding reduces RpA-70 binding to transcribed regions
(A) log2[Pol II CPM] values for genes in the set of NC13-bound promoters were plotted for both wild-type and for zld294 NC13 stage embryos. The solid red line indicates no change between samples and the dotted red lines indicate 2-fold changes in either direction. (B) Promoter-proximal Pol II counts for both wild-type (+/+) and zld294 were plotted as in Figure 2A. The position of each promoter in the classes of ‘zelda dependent’ or ‘zelda independent’ loci are marked by a black hashmark on the right margin. (C) RPKM values for genes in the ‘zelda dependent’ (blue) and the ‘zelda independent’ (red) sets were extracted from (Lott et al., 2011) and averaged. Mean RPKM values ± sem are plotted from NC10 through NC14. (D) Kernel density estimates for distances between a known Zelda protein binding site (from (Harrison et al., 2011)) and TSSs in the ‘zelda dependent’ (blue) and ‘zelda independent’ (red) classes (p<<0.01, Wilcoxon rank sum test). (E) The promoter proximal distribution of Zelda protein (from (Harrison et al., 2011)) for genes in the ‘zelda dependent’ (blue) and ‘zelda independent’ (red) sets was plotted. (F and F’) The NC13 promoter proximal distribution of Pol II for zelda dependent loci (F) was plotted for wild type (blue) and zelda (grey) embryos. (F’) shows the distribution of Pol II at zelda independent loci for wild type (red) and zelda (grey dashed) embryos. (G and G’) The NC13 promoter proximal distribution of RpA-70 for zelda dependent loci (G) was plotted for wild type (blue) and zelda (grey) embryos. (G’) shows the distribution of RpA-70 at zelda independent loci for wild type (red) and zelda (grey dashed) embryos. See also Table S3
Figure 7
Figure 7. Reduced Pol II recruitment suppresses mei-41 lethality
(A) Syncytial cell cycle times for the indicated genotypes/treatments were measured by time-lapse confocal microscopy of H2Av-GFP. Time is represented in minutes ± sem. Lethality is represented by a black X. The grey box highlights conditions tested for suppression of mei-41 lethality. Data for suppressing individuals only are shown for the final three genotypes. The pie charts at bottom right indicate the frequency of mei-41 suppression for the associated genotypes. Wild-type and mei-41 data is reproduced from Figure 1. N = 27 (+/+ (+amanitin)), N = 30 (zld germline clones), N = 20 (Df(Trl)/+). (B) Representative images (2500μm2) from time-lapse recordings from (A) are shown in 3-minute intervals beginning at metaphase 13 through 18 minutes into NC14. Note the absence of defective NC13 mitosis in mei-41 zld and mei-41; Df(Trl)/+ and subsequent wild-type nuclear morphology compared with mei-41 alone or mei-41 (+amanitin).

Comment in

References

    1. Azvolinsky A, Giresi PG, Lieb JD, Zakian VA. Highly transcribed RNA polymerase II genes are impediments to replication fork progression in Saccharomyces cerevisiae. Mol Cell. 2009;34:722–734. - PMC - PubMed
    1. Benoit B, He CH, Zhang F, Votruba SM, Tadros W, Westwood JT, Smibert CA, Lipshitz HD, Theurkauf WE. An essential role for the RNA-binding protein Smaug during the Drosophila maternal-to-zygotic transition. Development. 2009;136:923–932. - PMC - PubMed
    1. Bermejo R, Lai MS, Foiani M. Preventing replication stress to maintain genome stability: resolving conflicts between replication and transcription. Mol Cell. 2012;45:710–718. - PubMed
    1. Bhat KM, Farkas G, Karch F, Gyurkovics H, Gausz J, Schedl P. The GAGA factor is required in the early Drosophila embryo not only for transcriptional regulation but also for nuclear division. Development. 1996;122:1113–1124. - PubMed
    1. Blythe SA, Reid CD, Kessler DS, Klein PS. Chromatin immunoprecipitation in early Xenopus laevis embryos. Developmental Dynamics. 2009;238:1422–1432. - PMC - PubMed

Publication types

MeSH terms

Associated data