. 2015 Mar 12;160(6):1246-60.
doi: 10.1016/j.cell.2015.02.038. Epub 2015 Mar 5.

Genome-wide CRISPR screen in a mouse model of tumor growth and metastasis

Affiliations

Genome-wide CRISPR screen in a mouse model of tumor growth and metastasis

Sidi Chen et al. Cell. .

Abstract

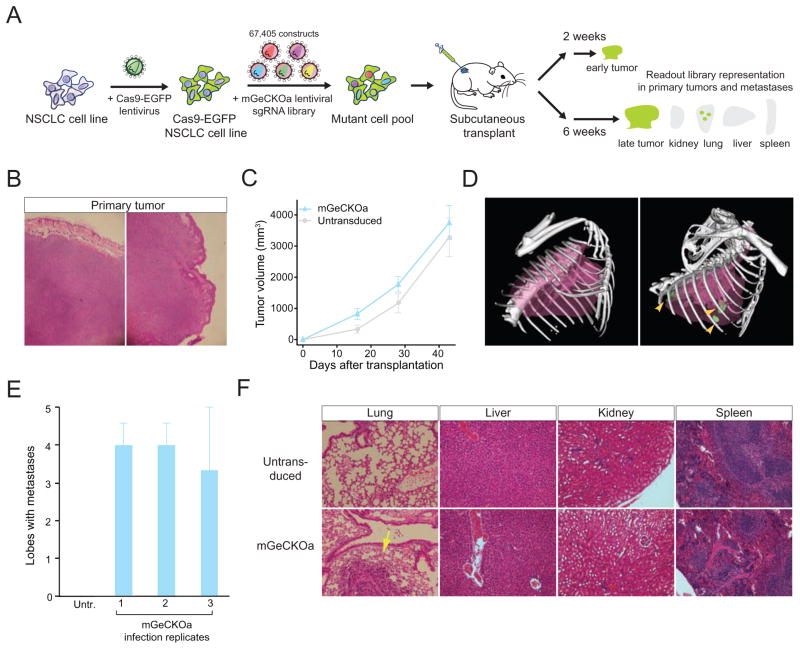
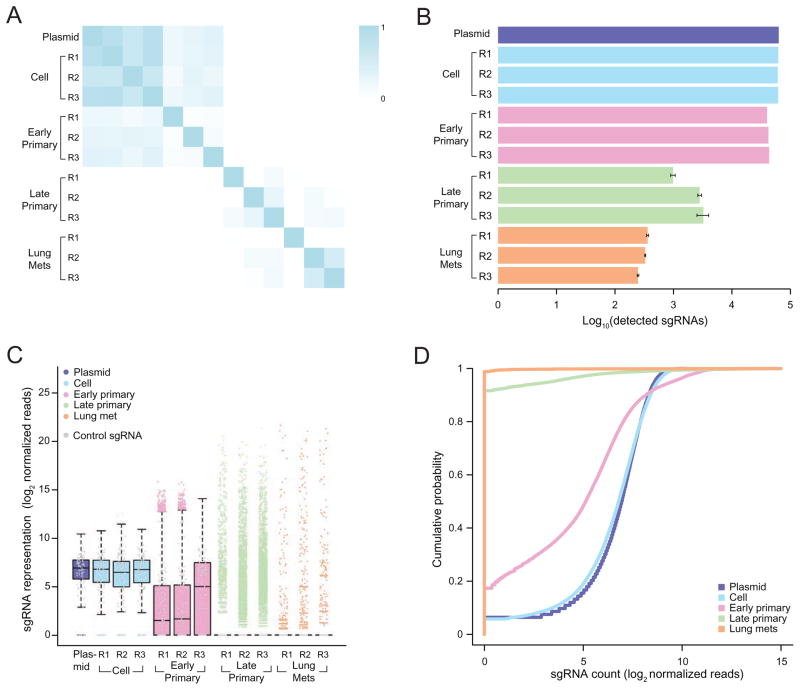
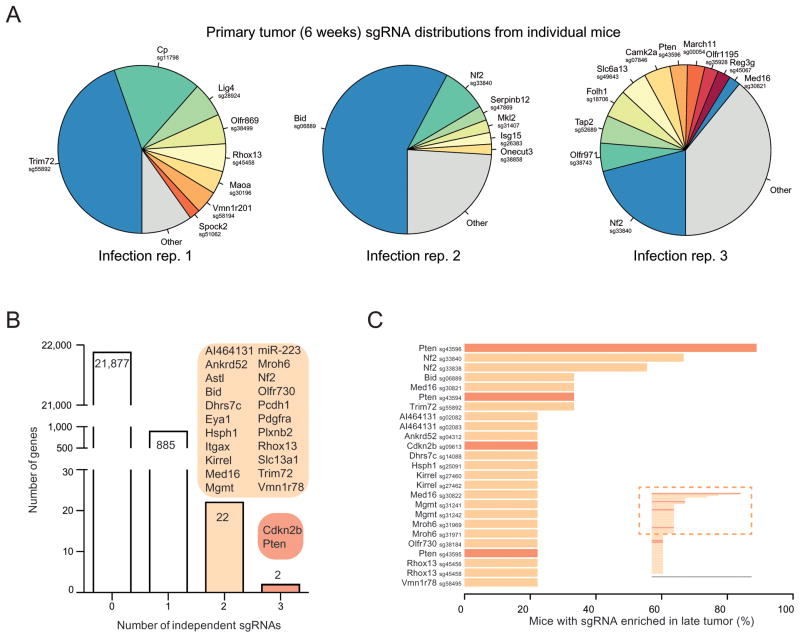
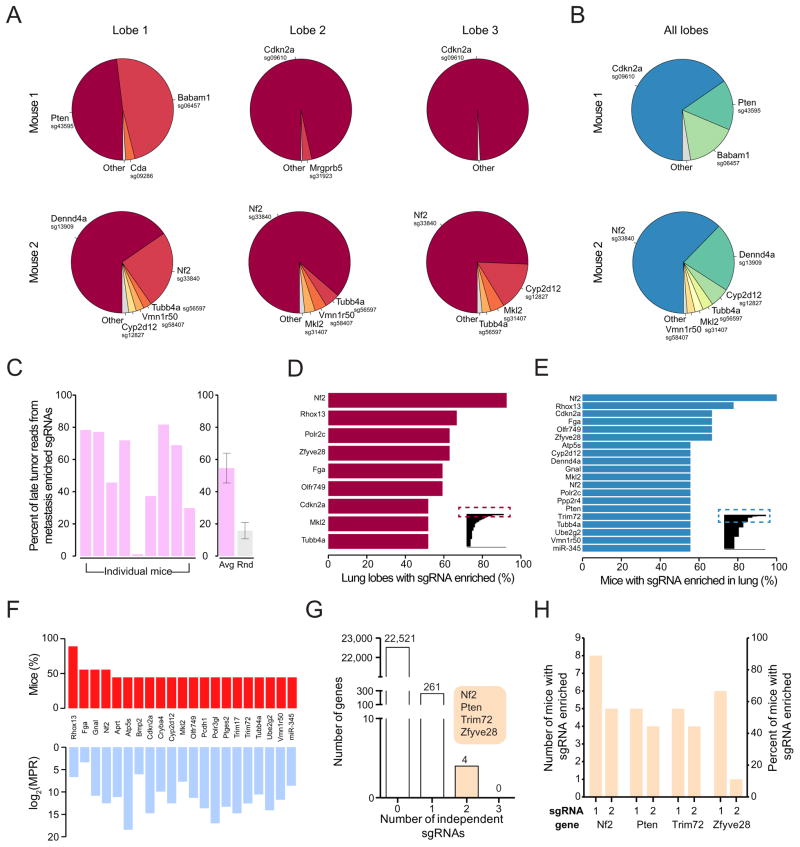
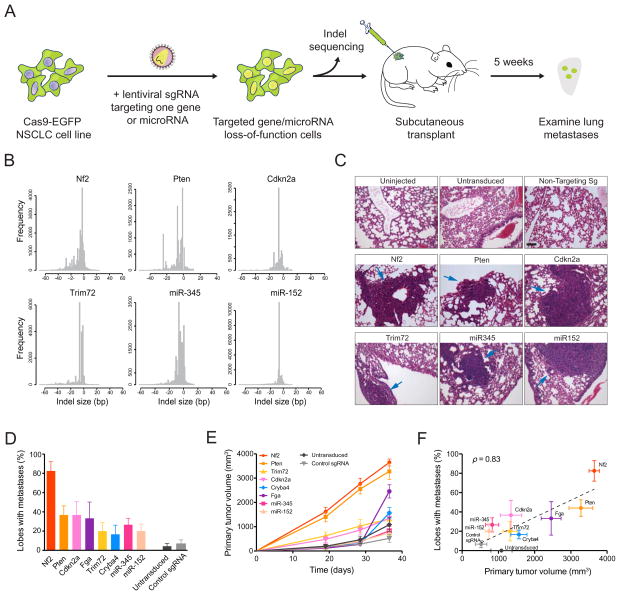
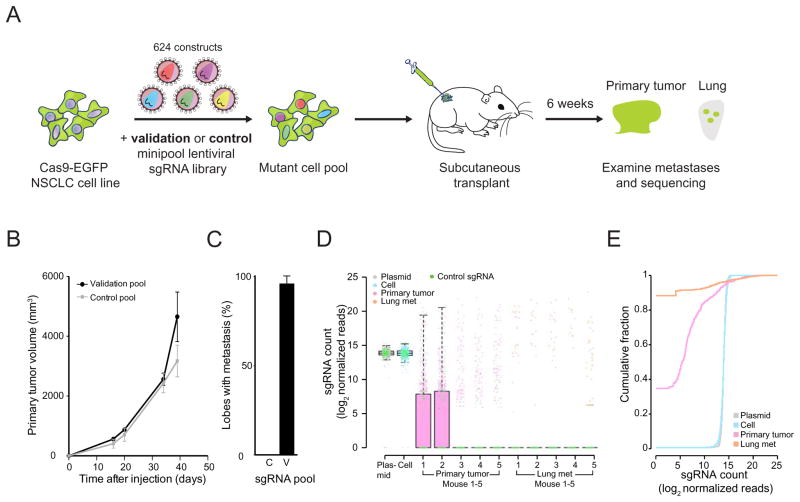
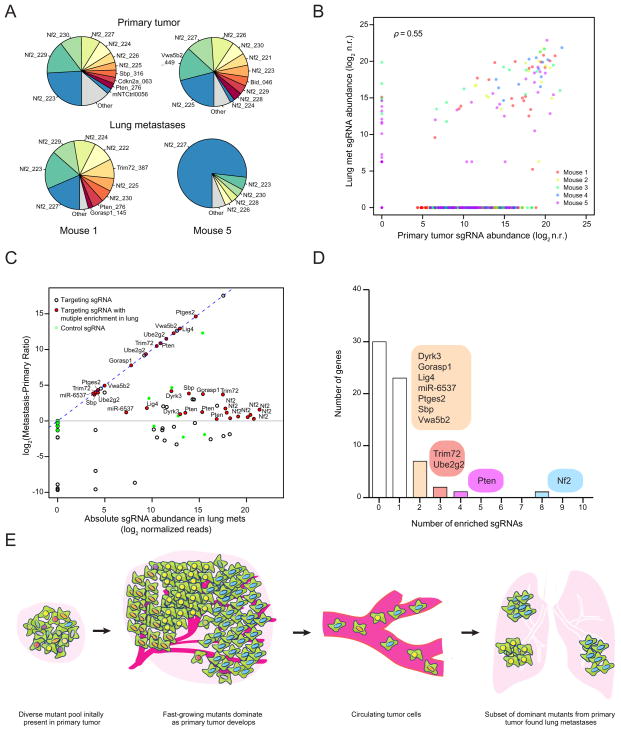
Genetic screens are powerful tools for identifying genes responsible for diverse phenotypes. Here we describe a genome-wide CRISPR/Cas9-mediated loss-of-function screen in tumor growth and metastasis. We mutagenized a non-metastatic mouse cancer cell line using a genome-scale library with 67,405 single-guide RNAs (sgRNAs). The mutant cell pool rapidly generates metastases when transplanted into immunocompromised mice. Enriched sgRNAs in lung metastases and late-stage primary tumors were found to target a small set of genes, suggesting that specific loss-of-function mutations drive tumor growth and metastasis. Individual sgRNAs and a small pool of 624 sgRNAs targeting the top-scoring genes from the primary screen dramatically accelerate metastasis. In all of these experiments, the effect of mutations on primary tumor growth positively correlates with the development of metastases. Our study demonstrates Cas9-based screening as a robust method to systematically assay gene phenotypes in cancer evolution in vivo.


Figures

Figure 1
Figure 1
(A) Schematic representation of the loss-of-function metastasis screen using the mouse genome-scale CRISPR/Cas9 knock-out library (mGeCKOa). (B) Representative hematoxylin and eosin (H&E) stains of primary tumor from Nu/Nu mice subcutaneously transplanted with a Cas9-GFP KrasG12D/+;p53−/−;Dicer1+/− (KPD) NSCLC cell line, untransduced or transduced mGeCKOa lentiviral library. Scale bar: 200 μm. (C) Primary tumor growth curve of Nu/Nu mice transplanted with untransduced cells (n = 3 mice) or mGeCKOa-transduced Cas9-GFP KPD cells (n = 9 mice). (D) Micro-CT 3D reconstruction of the lungs of representative mice transplanted with control (untransduced) and mGeCKOa-transduced (mGeCKOa) cell pools. Lung metastases were identified and traced in each 2D section (green). (E) Percent of lobes with metastases visible after dissection under a fluorescence stereoscope, in Nu/Nu mice transplanted with untransduced Cas9-GFP KPD cells (n = 3 mice), or mGeCKOa-transduced Cas9-GFP KPD cells with three independent infection replicate experiments (R1, R2 and R3, n = 3 mice per replicate). (F) Representative H&E stains from various organs of Nu/Nu mice subcutaneously transplanted with untransduced and mGeCKOa-transduced Cas9-GFP KPD cells. Yellow arrow indicates a lung metastasis. Scale bar: 40 μm. (See also: Figure S1)
Figure 2
Figure 2
(A) Pearson correlation coefficient of the normalized sgRNA read counts from the mGeCKOa plasmid library, transduced cells before transplantation (day 7 after spinfection), early primary tumors (~ 2 weeks after transplantation), late primary tumors (~ 6 weeks after transplantation), and lung metastases (~ 6 weeks after transplantation). For each biological sample type, 3 independent infection replicates (R1, R2 and R3) are shown. n = 1 mouse per infection replicate for early primary tumors and n = 3 mice per infection replicate for late primary tumors and lung samples. (B) Number of unique sgRNAs in the plasmid, cells before transplantation, early and late primary tumors and lung metastases as in (A), Error bars for late primary tumors and lung metastases denote the s.e.m. for n = 3 mice per infection replicate. (C) Boxplot of the sgRNA normalized read counts for the mGeCKOa plasmid pool, cells before transplantation, early and late primary tumors and lung metastases as in (A). Outliers are shown as colored dots for each respective sample. Gray dots overlayed on each boxplot indicate read counts for the 1,000 control (non-targeting) sgRNAs in the mGeCKOa library. Distributions for late primary tumors and lung metastases are averaged across individual mice from the same infection replication. (D) Cumulative probability distribution of library sgRNAs in the plasmid, cells before transplantation, early and late primary tumors and lung metastases as in (A). Distributions for each sample type are averaged across individual mice and infection replications. (See also: Figures S2 and S3)
Figure 3
Figure 3
(A) Pie charts of the most abundant sgRNAs in the primary tumors (at ~6 weeks post-transplantation) of three representative mice (one from each replicate mGeCKOa infection). The area for each sgRNA corresponds to the fraction of total reads from the primary tumor for the sgRNA. All sgRNAs with ≥ 2% of total reads are plotted individually. (B) Number of genes with 0, 1, 2 or 3 significantly enriched (FDR < 0.2% for at least one mouse) mGeCKOa sgRNAs targeting that gene. For genes/miRs with 2 or more enriched sgRNAs, genes/miRs are categorized by how many sgRNAs targeting that gene/miRs are enriched as indicated in the colored bubbles adjacent to each bar. (C) Inset: Waterfall plot of sgRNAs where multiple sgRNAs targeting the same gene are significantly enriched in primary tumors. Each sgRNA is ranked by the percent of mice in which it is enriched. Only sgRNAs enriched in 2 or more mice are shown in the main panel. Main panel: Enlargement and gene labels for sgRNAs at the top of the list from the inset (boxed region). (See also: Figures S3, S4 and S5)
Figure 4
Figure 4
(A) Pie charts of the most abundant sgRNAs in three individual lobes of the lungs of two representative mice transplanted with mGeCKOa transduced cells. The area for each sgRNA corresponds to the fraction of total reads from the lobe for the sgRNA. All sgRNAs with ≥ 2% of total reads are plotted individually. (B) Pie charts of the most abundant sgRNAs in the lung (averaged across three individual lobes) for the two mice shown in (A). All sgRNAs with ≥ 2% of average reads are plotted individually. (C) Left: Percentage of late tumor reads for the significantly enriched (FDR < 0.2%) mGeCKOa sgRNAs found in the lung metastases (averaged across three dissected lobes). Right: In purple, the percentage of late tumor reads for the significantly enriched (FDR<0.2%) mGeCKOa sgRNAs found in the lung metastases (average across all mice, n = 9 mice). In grey, the percentage of late tumor reads for random, size-matched samplings of sgRNAs present in the late tumor (n = 100 samplings). (D) Inset: All sgRNAs found in individual lung lobes ordered by the percent of lobes in which a particular sgRNA was amongst the significantly enriched (FDR < 0.2%) sgRNAs for that lobe. Only sgRNAs enriched in 2 or more lobes are shown. Main panel: Enlargement and gene labels for sgRNAs at the top of the list from the inset (boxed region). (E) Inset: All sgRNAs found in individual mouse (averaged across three dissected lobes) ordered by the percent of mice in which a particular sgRNA was amongst the significantly enriched (FDR < 0.2%) sgRNAs for that mouse. Only sgRNAs enriched in 2 or more mice are shown. Main panel: Enlargement and gene labels for sgRNAs at the top of the list from the inset (boxed region). (F) Bottom: Metastasis Primary Ratio (MPR) for the sgRNAs in mGeCKOa with enrichment in metastases over late tumor (MPR > 1) observed in at least 3 mice. The sgRNAs are sorted by the number of mice in which the MPR for the sgRNA is greater than 1. Top: Number of mice in which the MPR for this sgRNA is greater than 1. In both panels, individual sgRNAs are labeled by gene target. (G) Number of genes with 0, 1, 2 or 3 significantly enriched (FDR < 0.2% for at least one mouse) mGeCKOa sgRNAs in the lung metastases. For genes with 2 enriched sgRNAs, gene names are indicated in the colored bubble adjacent to the bar. (H) Number of mice and percentage of mice in which each sgRNA was enriched in the lung metastases for all genes with multiple enriched sgRNAs. (See also: Figures S4 and S5)
Figure 5
Figure 5
(A) Schematic representation of lentiviral transduction of Cas9-GFP KPD cells with single sgRNAs designed to target one gene or miR. After puromycin selection, the cell population was transplanted into Nu/Nu mice and also deep sequenced to examine the distribution of indels at the target site. After 5 weeks, the primary tumor and lungs are examined. (B) Histograms of indel sizes at the genomic locus targeted by a representative sgRNA for each gene/miR after 3 days of puromycin selection. Indels from sgRNAs targeting the same gene were pooled (6 sgRNAs for each protein-coding gene, 4 sgRNAs for each miR). (C) Representative H&E staining of lung lobes from uninjected mice (n = 3 mice), mice transplanted with cells transduced with Cas9 only (n = 5), and mice transplanted with cells containing Cas9 and a single sgRNA (n = 6). Single sgRNAs are either control/non-targeting sgRNAs (n = 6 mice for control sgRNAs, 3 distinct control sgRNAs with 2 mice each) or targeting sgRNAs (n = 6 mice for each gene/miR target, 3 sgRNAs per target with 2 mice each). Blue arrows indicate lung metastases. Scale bar: 10 μm. (D) Percent of lung lobes with metastases after 6 weeks for the mice in (C). (E) Primary tumor growth curve of Nu/Nu mice transplanted with NSCLC cells transduced with Cas9 only (n = 5) or single sgRNAs (n = 6 mice per gene/miR target, 3 sgRNAs per target with 2 mice each; n = 6 mice for control sgRNAs, 3 control sgRNAs with 2 mice each). (F) Correlation between primary tumor volume and percent of lobes with metastases for each gene in (D) and (E). Error bars indicate s.e.m.. (See also: Figure S6)
Figure 6
Figure 6
(A) Schematic representation of the loss-of-function metastasis minipool screen. Briefly, Cas9-GFP KPD cells were transduced with either validation minipool (524 gene-targeting + 100 non-targeting sgRNAs) or control minipool (624 non-targeting sgRNAs). After puromycin selection, the cell pools are transplanted into Nu/Nu mice. After 6 weeks, validation minipool sgRNAs are sequenced from primary tumor and lung samples. (B) Primary tumor growth curve of Nu/Nu mice transplanted with Cas9 vector + validation minipool cells (n = 5 mice) or Cas9 + control minipool cells (n = 5 mice). (C) Percent of lung lobes with metastases after 6 weeks for the mice in (B). C = control minipool. V = validation minipool. (D) Boxplot of the sgRNA normalized read counts for the plasmid library, cells before transplantation, primary tumor and lung metastases using the validation minipool. (E) Cumulative probability distribution of library sgRNAs in the validation plasmid pool, cells before transplantation, early tumor and lung metastases. Distributions of primary tumor and lung metastases are averaged across 5 mice. (See also: Figure S7)
Figure 7
Figure 7
(A) Pie charts of the most abundant sgRNAs in the primary tumor and the whole lung of two representative mice transplanted with validation minipool transduced Cas9-GFP KPD cells. The area for each sgRNA corresponds to the fraction of total reads from the tissue (primary tumor or lung metastases) for the sgRNA. All sgRNAs with ≥ 2% of total reads are plotted individually. (B) Scatterplot of normalized sgRNA read counts in primary tumor and lung metastases for all sgRNAs in the validation minipool for each mouse (different color dots indicate sgRNAs from different mice). log2 n.r., log2 normalized reads. (C) log2 ratio of sgRNA abundance in the lung metastases over the primary tumor (Metastasis-Primary Ratio, or MPR) plotted against the abundance in the lung metastases (n = 5 mice per sgRNA). Green dots are the 100 control sgRNAs. Dots with black outlines are non-control sgRNAs that target genes or miRs. Red dots indicate non-control sgRNAs for which more than one sgRNA targeting the same gene/miR is enriched in the lung metastases over the primary tumor (i.e. log2(MPR) > 0 ) and are labeled with the gene/miR targeted. The lung-primary ratio is calculated for individual mice and these quantities are averaged across mice. (D) Number of genes with 0 to 10 significantly enriched validation minipool sgRNAs in lung metastases. For genes/miRs with 2 or more enriched sgRNAs, genes/miRs are categorized by how many sgRNAs targeting that gene/miRs are enriched as indicated in the colored bubbles adjacent to each bar. (E) Schematic illustration of tumor growth and metastasis in the library-transduced NSCLC transplant model. The initially diverse set of loss-of-function mutations in the subcutaneously transplanted pool is selected over time for mutations that promote growth of the primary tumor. A subset of these mutants also dominate lung metastases. (See also: Figure S7)

Comment in

References

    1. Aceto N, Bardia A, Miyamoto DT, Donaldson MC, Wittner BS, Spencer JA, Yu M, Pely A, Engstrom A, Zhu H, et al. Circulating tumor cell clusters are oligoclonal precursors of breast cancer metastasis. Cell. 2014;158:1110–1122. - PMC - PubMed
    1. Barrangou R, Fremaux C, Deveau H, Richards M, Boyaval P, Moineau S, Romero DA, Horvath P. CRISPR provides acquired resistance against viruses in prokaryotes. Science. 2007;315:1709–1712. - PubMed
    1. Barretina J, Caponigro G, Stransky N, Venkatesan K, Margolin AA, Kim S, Wilson CJ, Lehar J, Kryukov GV, Sonkin D, et al. The Cancer Cell Line Encyclopedia enables predictive modelling of anticancer drug sensitivity. Nature. 2012;483:603–607. - PMC - PubMed
    1. Bolotin A, Quinquis B, Sorokin A, Ehrlich SD. Clustered regularly interspaced short palindrome repeats (CRISPRs) have spacers of extrachromosomal origin. Microbiology. 2005;151:2551–2561. - PubMed
    1. Cerami E, Gao J, Dogrusoz U, Gross BE, Sumer SO, Aksoy BA, Jacobsen A, Byrne CJ, Heuer ML, Larsson E, et al. The cBio cancer genomics portal: an open platform for exploring multidimensional cancer genomics data. Cancer discovery. 2012;2:401–404. - PMC - PubMed

Publication types

Substances

Associated data

LinkOut - more resources