

Coexpression analysis of CD133 and CD44 identifies proneural and mesenchymal subtypes of glioblastoma multiforme
- PMID: 25749043
- PMCID: PMC4467436
- DOI: 10.18632/oncotarget.3365
Coexpression analysis of CD133 and CD44 identifies proneural and mesenchymal subtypes of glioblastoma multiforme
Abstract
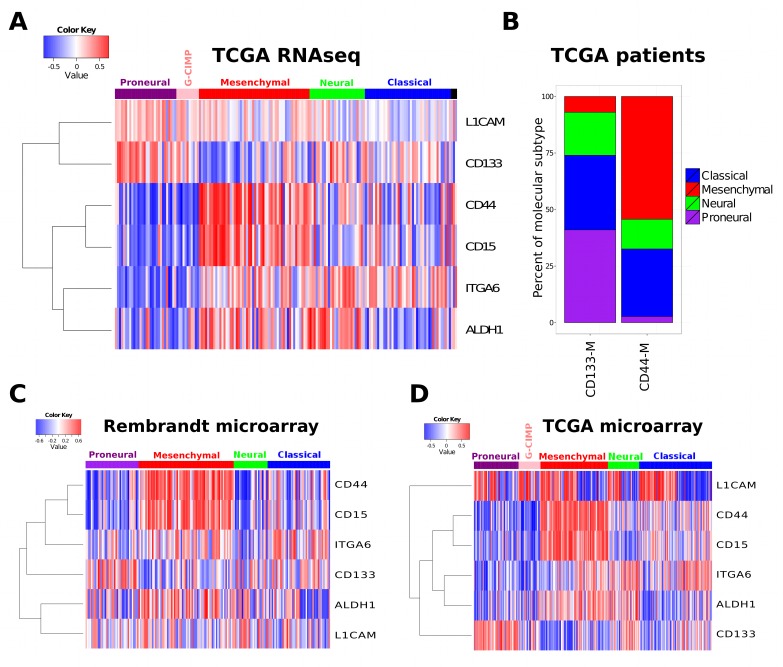
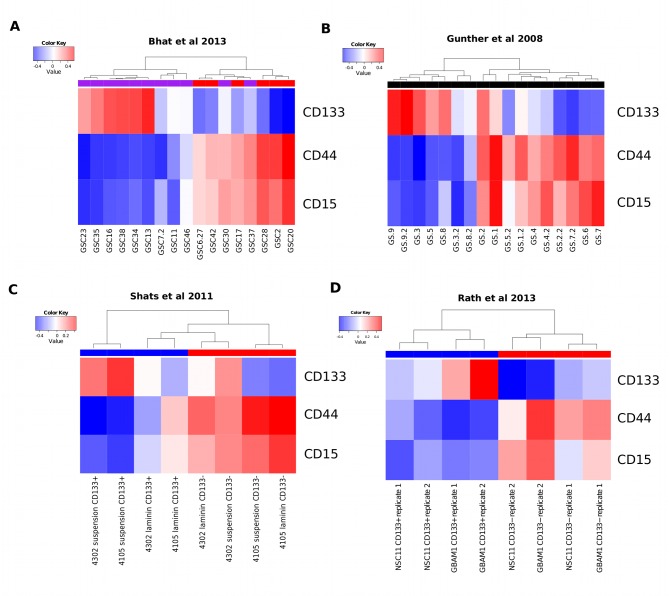
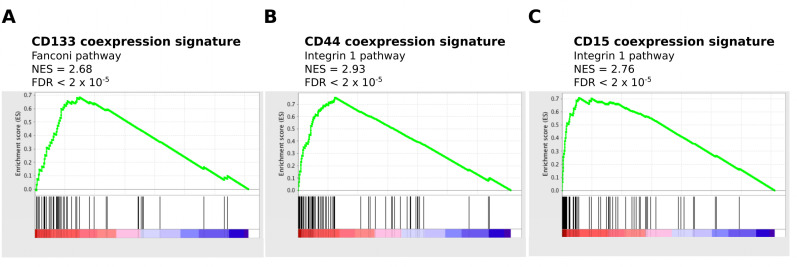
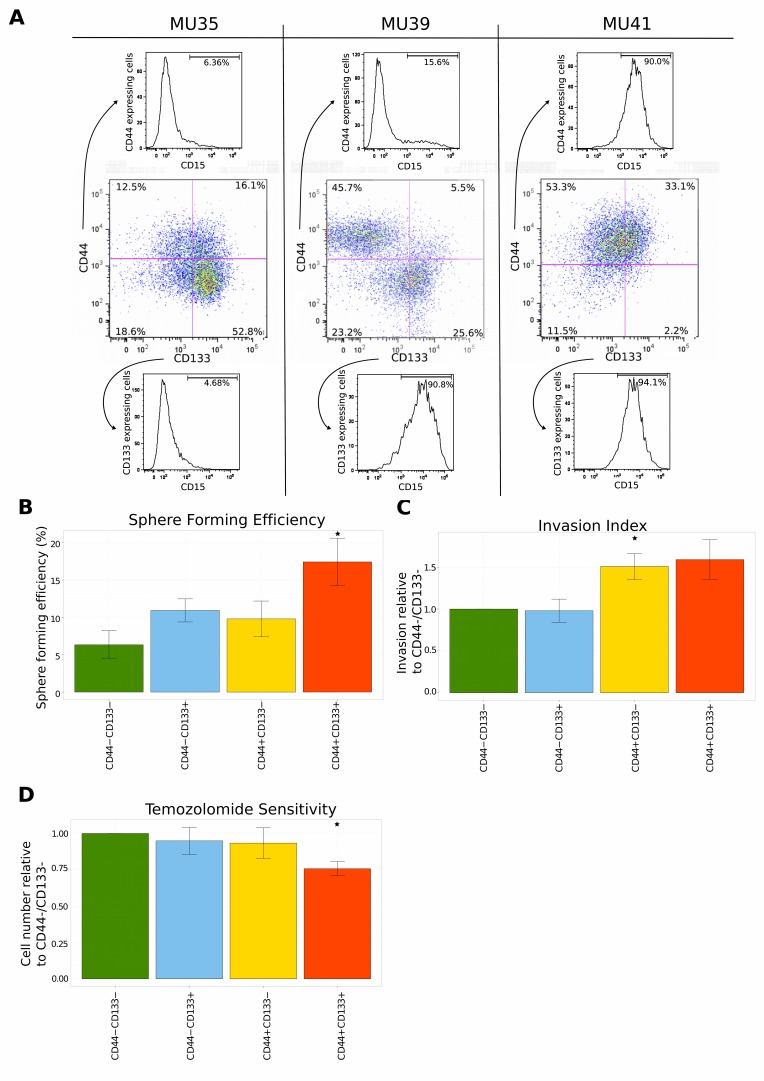
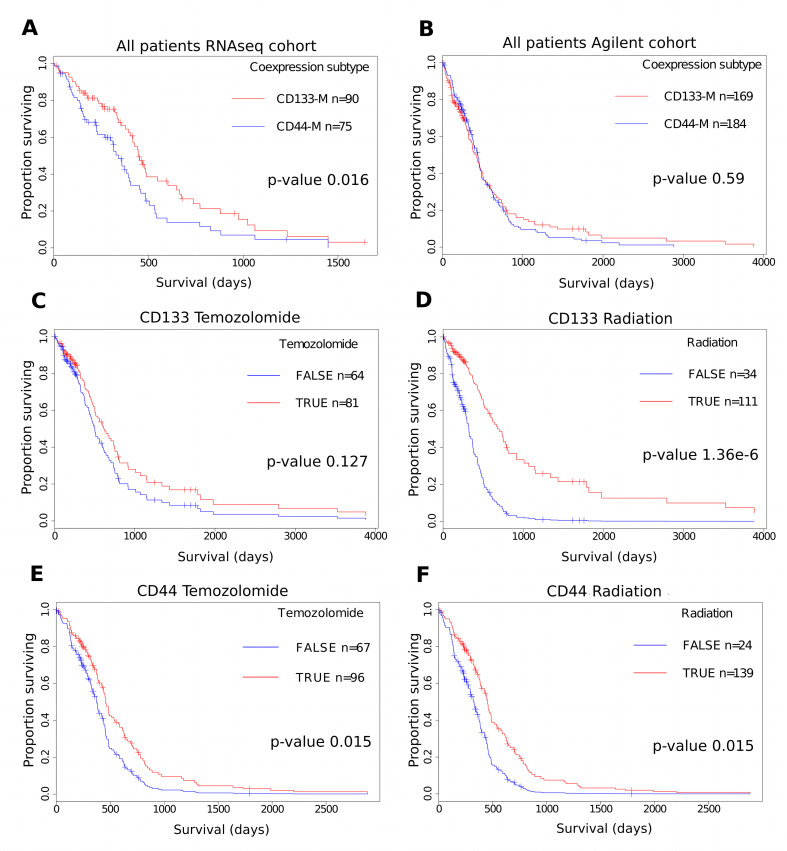
Accumulating evidence suggests that the stem cell markers CD133 and CD44 indicate molecular subtype in Glioblastoma Multiforme (GBM). Gene coexpression analysis of The Cancer Genome Atlas GBM dataset was undertaken to compare markers of the Glioblastoma Stem-Progenitor Cell (GSPC) phenotype. Pearson correlation identified genes coexpressed with stem cell markers, which were then used to build a gene signature that classifies patients based on a CD133 coexpression module signature (CD133-M) or CD44-M subtype. CD133-M tumors were enriched for the Proneural (PN) GBM subtype compared to Mesenchymal (MES) subtype for CD44-M tumors. Gene set enrichment identified DNA replication/cell cycle genes in the CD133-M and invasion/migration in CD44-M, while functional experiments showed enhanced cellular growth in CD133 expressing cells and enhanced invasion in cells expressing CD44. As with the 4 major molecular subtypes of GBM, there was no long-term survival difference between CD44-M and CD133-M patients, although CD44-M patients responded better to temozolomide while CD133-M patients benefited from radiotherapy. The use of a targeted coexpression approach to predict functional properties of surface marker expressing cells is novel, and in the context of GBM, supports accumulating evidence that CD133 and CD44 protein marker expression correlates with molecular subtype.
Keywords: cancer genome atlas; cancer stem cells; coexpression; glioblastoma; molecular subtype.
Figures
Similar articles
-
CD133 as a marker for regulation and potential for targeted therapies in glioblastoma multiforme.Neurosurg Clin N Am. 2012 Jul;23(3):391-405. doi: 10.1016/j.nec.2012.04.011. Epub 2012 Jun 5. Neurosurg Clin N Am. 2012. PMID: 22748652 Review.
-
CD133(+) and CD133(-) glioblastoma-derived cancer stem cells show differential growth characteristics and molecular profiles.Cancer Res. 2007 May 1;67(9):4010-5. doi: 10.1158/0008-5472.CAN-06-4180. Cancer Res. 2007. PMID: 17483311
-
Expression of CD133 and CD44 in glioblastoma stem cells correlates with cell proliferation, phenotype stability and intra-tumor heterogeneity.PLoS One. 2017 Feb 27;12(2):e0172791. doi: 10.1371/journal.pone.0172791. eCollection 2017. PLoS One. 2017. PMID: 28241049 Free PMC article.
-
Investigating the link between molecular subtypes of glioblastoma, epithelial-mesenchymal transition, and CD133 cell surface protein.PLoS One. 2013 May 29;8(5):e64169. doi: 10.1371/journal.pone.0064169. Print 2013. PLoS One. 2013. PMID: 23734191 Free PMC article.
-
Stem cell signature in glioblastoma: therapeutic development for a moving target.J Neurosurg. 2015 Feb;122(2):324-30. doi: 10.3171/2014.9.JNS132253. Epub 2014 Nov 14. J Neurosurg. 2015. PMID: 25397368 Review.
Cited by
-
Invasion of white matter tracts by glioma stem cells is regulated by a NOTCH1-SOX2 positive-feedback loop.Nat Neurosci. 2019 Jan;22(1):91-105. doi: 10.1038/s41593-018-0285-z. Epub 2018 Dec 17. Nat Neurosci. 2019. PMID: 30559479
-
Overexpression of CD44 is associated with a poor prognosis in grade II/III gliomas.J Neurooncol. 2019 Nov;145(2):201-210. doi: 10.1007/s11060-019-03288-8. Epub 2019 Sep 10. J Neurooncol. 2019. PMID: 31506754
-
Adapt to Persist: Glioblastoma Microenvironment and Epigenetic Regulation on Cell Plasticity.Biology (Basel). 2022 Feb 16;11(2):313. doi: 10.3390/biology11020313. Biology (Basel). 2022. PMID: 35205179 Free PMC article. Review.
-
Effect of Autophagy Inhibitors on Radiosensitivity in DNA Repair-Proficient and -Deficient Glioma Cells.Medicina (Kaunas). 2022 Jul 2;58(7):889. doi: 10.3390/medicina58070889. Medicina (Kaunas). 2022. PMID: 35888608 Free PMC article.
-
Chlorotoxin-directed CAR T cells for specific and effective targeting of glioblastoma.Sci Transl Med. 2020 Mar 4;12(533):eaaw2672. doi: 10.1126/scitranslmed.aaw2672. Sci Transl Med. 2020. PMID: 32132216 Free PMC article.
References
-
- Miller CR, Perry A. Glioblastoma: morphologic and molecular genetic diversity. Archives of pathology & laboratory medicine. 2007;131(3):397–406. - PubMed
-
- Smoll NR, Schaller K, Gautschi OP. Long-term survival of patients with glioblastoma multiforme (GBM) Journal of clinical neuroscience : official journal of the Neurosurgical Society of Australasia. 2013;20(5):670–675. - PubMed
-
- Phillips HS, Kharbanda S, Chen R, Forrest WF, Soriano RH, Wu TD, Misra A, Nigro JM, Colman H, Soroceanu L, Williams PM, Modrusan Z, Feuerstein BG, Aldape K. Molecular subclasses of high-grade glioma predict prognosis, delineate a pattern of disease progression, and resemble stages in neurogenesis. Cancer Cell. 2006;9(3):157–173. - PubMed
-
- Verhaak RGW, Hoadley KA, Purdom E, Wang V, Qi Y, Wilkerson MD, Miller CR, Ding L, Golub T, Mesirov JP, Alexe G, Lawrence M, O'Kelly M, Tamayo P, Weir BA, Gabriel S, et al. Integrated genomic analysis identifies clinically relevant subtypes of glioblastoma characterized by abnormalities in PDGFRA, IDH1, EGFR, and NF1. Cancer Cell. 2010;17(1):98–110. - PMC - PubMed
MeSH terms
Substances
LinkOut - more resources
Full Text Sources
Other Literature Sources
Medical
Research Materials
Miscellaneous
