. 2015;11(3):460-71.
doi: 10.1080/15548627.2015.1009797.

Retinoic acid-induced IgG production in TLR-activated human primary B cells involves ULK1-mediated autophagy

Affiliations

Retinoic acid-induced IgG production in TLR-activated human primary B cells involves ULK1-mediated autophagy

Agnete Bratsberg Eriksen et al. Autophagy. 2015.

Abstract

In the present study we have established a vital role of autophagy in retinoic acid (RA)-induced differentiation of toll-like receptor (TLR)-stimulated human B cells into Ig-secreting cells. Thus, RA enhanced autophagy in TLR9- and CD180-stimulated peripheral blood B cells, as revealed by increased levels of the autophagosomal marker LC3B-II, enhanced colocalization between LC3B and the lysosomal marker Lyso-ID, by a larger percentage of cells with more than 5 characteristic LC3B puncta, and by the concomitant reduction in the level of SQSTM1/p62. Furthermore, RA induced expression of the autophagy-inducing protein ULK1 at the transcriptional level, in a process that required the retinoic acid receptor RAR. By inhibiting autophagy with specific inhibitors or by knocking down ULK1 by siRNA, the RA-stimulated IgG production in TLR9- and CD180-mediated cells was markedly reduced. We propose that the identified prominent role of autophagy in RA-mediated IgG-production in normal human B cells provides a novel mechanism whereby vitamin A exerts its important functions in the immune system.

Keywords: ATG, autophagy-related; B lymphocytes; BDS, bright detail similarity; CD180; CD180, CD180 molecule; CVID, common variable immune deficiency; ELISA, enzyme-linked immunosorbent assay; IL, interleukin; Ig, immunoglobulin; MAP1LC3B/LC3B, microtubule-associated protein 1 light chain 3 β; MTOR, mechanistic target of rapamycin (serine/threonine kinase); PAMP, pathogen-associated molecular pattern, PML/RARA, promyelocytic leukemia/ retinoic acid receptor α; RA, all-trans retinoic acid; RAR, retinoic acid receptor; RP105; SQSTM1, sequestosome 1; TLR, toll-like receptor; TLR9; ULK1; ULK1, unc-51 like autophagy activating kinase 1; antibody secretion; autophagy; plasma cell differentiation; retinoic acid.


Figures
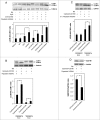
Figure 1.
Figure 1.
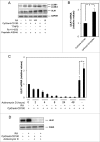
Retinoic acid enhances the level of LC3B-II and the LC3B-II/LC3B-I ratio in TLR-stimulated B cells. (A) CD19+ B cells (0.5 × 10⁶ /ml) were stimulated with CpG (1 μg/ml), anti-CD180 (1 μg/ml) and RA (100 nM) for 24 h before the lysosomal inhibitors pepstatin A (10 μg/ml) and E64d (10 μg/ml) were added. The cells were incubated for another 72 h, before the cells were lysed and subjected to western blot analysis of LC3B-I/II and TUBA1A as described in Materials and Methods. To visualize the weaker protein bands in the first 2 lanes (representing unstimulated cells and cells stimulated with RA alone) the exposure time during development of the blot was substantially increased compared to the exposure time required for visualizing the bands in the other lanes of the blot. The 2 different exposure times are separated by a vertical line in the blot. (B) B cells were stimulated as in panel (A) in the presence or absence of the lysosomal inhibitors added after 24 h of stimulation. Again the cells were incubated for another 72 h, before subjected to western blot analysis as described in panel (A). The protein bands in both panel (A) and (B) were quantified, and the LC3B-II/LC3B-I ratios were calculated and displayed in the lower diagram. The data represent the mean ± SEM of 5 independent experiments. *P < 0.05 (Wilcoxon signed-rank test, n=5). (C) B cells were stimulated in the same manner as in panel (A) in the presence and absence of the lysosomal inhibitors pepstatin A and E64d the last 3 h of a 96-h incubation. The cells were then subjected to western blot analysis and the LC3B-II/LC3B-I ratios were quantitated and displayed in the diagram below, *P < 0.05 (paired sample Student t test, n=3). (D) B cells were stimulated as in panel (A) without the presence of lysosomal inhibitors. The protein levels of SQSTM1 were detected by western blotting analysis after 96 h of stimulation. The SQSTM1/GAPDH ratios were quantitated and displayed in the lower diagram. *P < 0.05 (paired sample Student t test, n=3) All the blots were developed and quantified as described in Materials and Methods.
Figure 2.
Figure 2.
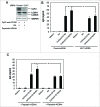
RA enhances the colocalization of LC3B-II and lysosomes. B cells were stimulated as described in Figure 1A, and 72 h after addition of the lysosomal inhibitors the cells were fixed, permeabilized, and stained with the lysosomal marker Lyso-ID and anti-LC3B antibody. (A) The cells were subjected to Image Stream analysis as described in Materials and Methods. The degree of colocalization between LC3B puncta and lysosomes was calculated, and the percentages of cells with high degree of colocalization (bright detail similarity [BDS] > 1.5) are presented in the diagram. The data represent the mean ± SEM of 5 independent experiments *P < 0.05 (Wilcoxon signed-rank test, n=5). (B) The upper panel presents representative images of cells with BDS < 1.5 and the lower panel presents representative images of cells with BDS>1.5 from the Image Stream analysis. (C) The cells were subjected to Image Stream analysis, and the percentages of cells with more than 5 LC3B-II puncta were estimated. The data represent the mean ± SEM of 5 independent experiments. *P < 0.05 (Wilcoxon signed-rank test, n=5) (D) In addition to staining the cells with anti-LC3B antibody and Lyso-ID, the nuclei were stained with DAPI. The degree of colocalization between LC3B and the lysosomal marker was visualized by confocal microscopy, using the 60 x objective.
Figure 3.
Figure 3.
RA induces LC3B-II and ULK1-expression in a time-dependent manner. (A) CD19+ B cells (0.5 x 10⁶ /ml) were stimulated with CpG (1 μg/ml), anti-CD180 (1 μg/ml) and RA (100 nM). The lysosomal inhibitors pepstatin A (10 μg/ml) and E64d (10 μg/ml) were added after 24 h, and the cells were harvested after 4, 24, 48, or 72 h, respectively. The cells were lysed and subjected to western blot analysis of LC3B-I/II, ULK1 or GAPDH, as described in Materials and Methods. The LC3B protein bands were quantitated, and the LC3B-II/LC3B-I ratios were calculated and displayed in the lower diagram. (B) B cells were stimulated with CpG (1 μg/ml), anti-CD180 (1 μg/ml) and RA (100 nM) and in the absence of lysosomal inhibitors. The cells were subjected to western blot analysis of ULK1, ATG5, ATG7, and GAPDH after 96 h. The lower diagram presents the quantification of the bands representing ULK1. The data represent the mean ± SEM of 5 independent experiments. *P < 0.05 (Wilcoxon signed-rank test, n=5). (C) B cells were stimulated with combinations of CpG (1 μg/ml), anti-CD180 (1 μg/ml) and RA (100 nM) for 48 h before the cells were lysed and subjected to western blot analysis. The ULK1 and CANX levels were quantitated and their ratio displayed in the lower diagram. *P < 0.05 (paired sample Student t test, n=3).
Figure 4.
Figure 4.
RA induces ULK1 and LC3B-II formation in both memory and naïve B cells. (A) CD19+ B cells were separated into CD27+ and CD27 fractions and cells from both populations were stimulated with CpG (1 μg/ml), anti-CD180 (1 μg/ml) and RA with and without the lysosomal inhbitors pepstatin A (10 μg/ml) and E64d (10 μg/ml) for the last 72 h of a 96 h incubation. Cells were harvested and subjected to western blot analysis where the levels of LC3B and CANX were detected. The diagram below shows the quantification of the LC3B-II/LC3B-I ratios. *P < 0.05 (paired sample Student t test, n=3) (B) CD27+ and CD27 cells were stimulated for 48 h in the same manner as in A without lysosomal inhibitors. The levels of ULK1 and CANX were detected by western blot analysis. *P < 0.05 (paired sample Student t test, n=3).
Figure 5.
Figure 5.
RA induces LC3B-II-formation via RAR-mediated gene expression. (A) B cells were stimulated with CpG (1 μg/ml) and anti-CD180 (1 μg/ml) in the presence or absence of increasing concentrations of RA (1, 10, or 100 nM), with the RAR-agonist TTNPB (100 nM), or with the RAR-antagonist Ro-41–4253 (5000 nM) in the presence of 10 nM of RA. Lysosomal inhibitors were added after 24 h, and the proteins were subjected to western blot analysis of LC3B-I/II, ULK1, and GAPDH after further culturing for 72 h. (B) B cells were stimulated as in A, and RNA was collected after 48 h as described in Materials and Methods. cDNA was synthesized, and the samples were subjected to quantitative real-time PCR by using primers specific for ULK1 and the controls TBP and ACTB. The diagrams represent the mean ± SEM of 5 independent experiments. *P < 0.05 (Wilcoxon signed-rank test, n=5). (C) B cells were pretreated with CpG (1 μg/ml) and anti-CD180 for 24 h before the transcriptional inhibitor actinomycin D (1 μg/ml) was added to the cell cultures. RA (100 nM) was added after another 2 h and cells were harvested at 0, 2, 4, 8, 24, and 48 h after the addition of actinomycin D. The 2 right columns are controls pretreated with CpG and anti-CD180 for 24 h and then stimulated with RA for another 48 h, all in the absence of actinomycin D. *P < 0.05 (paired sample Student t test, n=4) (D) B cells were pretreated with CpG (1 μg/ml) and anti-CD180 for 24 h before the transcriptional inhibitor actinomycin D (1 μg/ml) was added to the cell cultures. RA (100 nM) was added after another 2 h and the cells were further cultured for 48 h, before the pellets were harvested. The levels of ULK1 and CANX were detected by western blot analysis.
Figure 6.
Figure 6.
Knockdown of ULK1 inhibits RA-mediated IgG-secretion. B cells were transfected with siRNA (1.6 mM) against ULK1 or control siRNA (1.6 mM) and stimulated with CpG (1 μg/ml), anti-CD180 (1 μg/ml) and RA (100 nM). (A) After 48 h of stimulation, the cells were subjected to western blot analysis as described in Materials and Methods. (B) After 72 h of stimulation supernatant fractions were collected and subjected to analysis of IgG by ELISA assays. The data represent the mean ± SEM of 10 individual experiments. *P < 0.05 (Wilcoxon signed-rank test, n=10). (C) B cells were stimulated with combinations of CpG (1 μg/ml), anti-CD180 (1 μg/ml) and RA (100 nM) in the presence or absence of the lysosomal inhibitors pepstatin A (10 μg/ml) and E64d (10 μg/ml) added after 24 h of stimulation. The cells were cultured for another 48 h before supernatant fractions were collected and subjected to analysis of IgG by ELISA assays. The data represent the mean ± SEM of 5 independent experiments. *P < 0.05 (Wilcoxon signed-rank test, n=5).

Similar articles

Cited by

References

    1. Klionsky DJ. Autophagy: from phenomenology to molecular understanding in less than a decade. Nat Rev Mol Cell Biol 2007; 8:931-7; PMID:17712358; http://dx.doi.org/10.1038/nrm2245 - DOI - PubMed
    1. Deretic V. Autophagy in immunity and cell-autonomous defense against intracellular microbes. Immunol Rev 2011; 240:92-104; PMID:21349088; http://dx.doi.org/10.1111/j.1600-065X.2010.00995.x - DOI - PMC - PubMed
    1. Levine B, Mizushima N, Virgin HW. Autophagy in immunity and inflammation. Nature 2011; 469:323-35; PMID:21248839; http://dx.doi.org/10.1038/nature09782 - DOI - PMC - PubMed
    1. Chaturvedi A, Pierce SK. Autophagy in immune cell regulation and dysregulation. Curr Allergy Asthma Rep 2009; 9:341-6; PMID:19671376; http://dx.doi.org/10.1007/s11882-009-0050-1 - DOI - PubMed
    1. McLeod IX, He Y. Roles of autophagy in lymphocytes: reflections and directions. Cell Mol Immunol 2010; 7:104-7; PMID:20118969; http://dx.doi.org/10.1038/cmi.2009.115 - DOI - PMC - PubMed

Publication types

MeSH terms

LinkOut - more resources