Comparative Study
. 2015 Mar 9:5:8889.
doi: 10.1038/srep08889.

Irisin - a myth rather than an exercise-inducible myokine

Affiliations
Comparative Study

Irisin - a myth rather than an exercise-inducible myokine

Elke Albrecht et al. Sci Rep. .

Abstract

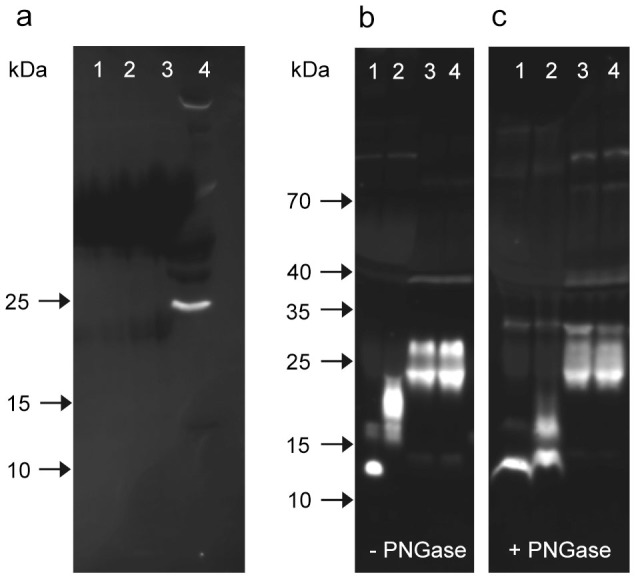
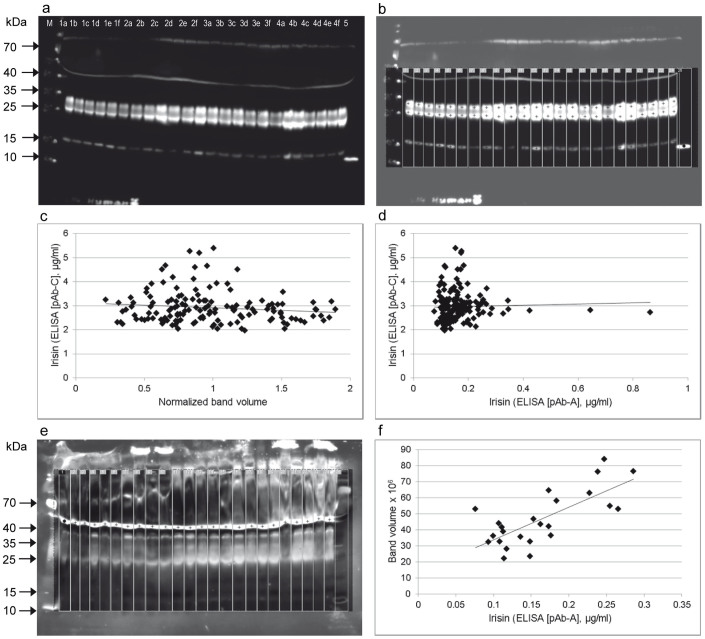
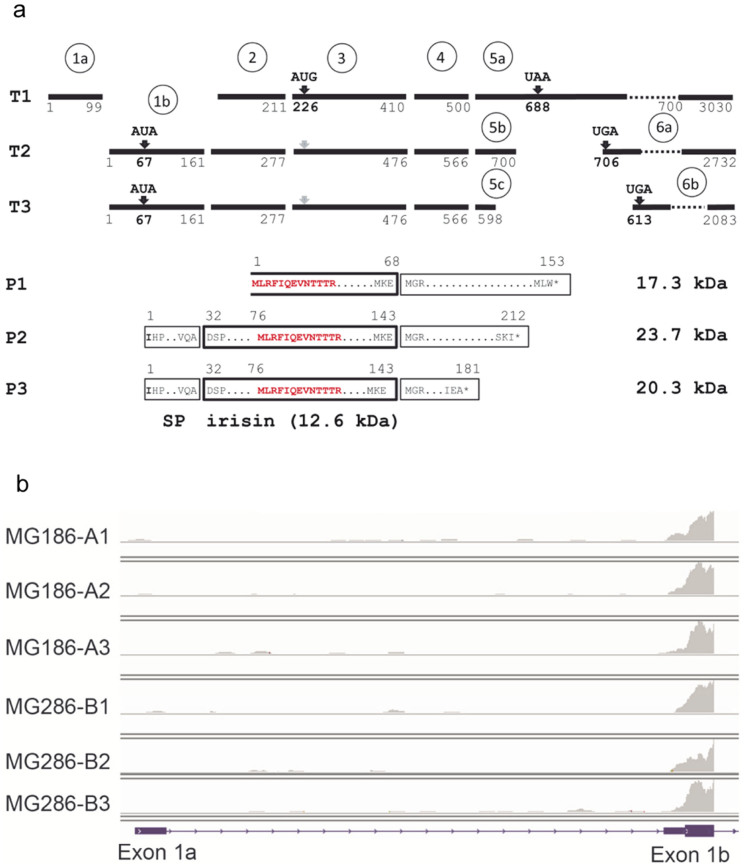
The myokine irisin is supposed to be cleaved from a transmembrane precursor, FNDC5 (fibronectin type III domain containing 5), and to mediate beneficial effects of exercise on human metabolism. However, evidence for irisin circulating in blood is largely based on commercial ELISA kits which are based on polyclonal antibodies (pAbs) not previously tested for cross-reacting serum proteins. We have analyzed four commercial pAbs by Western blotting, which revealed prominent cross-reactivity with non-specific proteins in human and animal sera. Using recombinant glycosylated and non-glycosylated irisin as positive controls, we found no immune-reactive bands of the expected size in any biological samples. A FNDC5 signature was identified at ~20 kDa by mass spectrometry in human serum but was not detected by the commercial pAbs tested. Our results call into question all previous data obtained with commercial ELISA kits for irisin, and provide evidence against a physiological role for irisin in humans and other species.


Figures

Figure 1
Figure 1. Western blot of dilution series of rNG-irisin, using pAb-A.
(a) rNG-irisin was diluted into PBS (lanes 1–8; absolute amounts 20, 4, 2, 1, 0.5, 0.25, 0.125, 0.0625 ng irisin/lane) or diluted in bovine plasma (lanes 9–16; identical amounts). Two samples of mouse serum (lanes 17, 18) and samples of human serum (lanes 19–24) are included. Mouse muscle protein extract is in lane 25. (b) pAb-A was blocked with 5-fold amount rNG-irisin prior to staining the blot. Images were taken after 2 (a) and 4 (b) min exposure to adjust for different background chemiluminescence, and were equally enhanced in contrast. (c) Band volumes of recombinant NG-irisin (lanes 9–15 in (a)) were densitometrically analyzed and plotted against irisin amount (ng) in bovine serum. The highest (20 ng) and lowest (0.0625 ng) concentrations were omitted from this analysis.
Figure 2
Figure 2. Western blots for detection of FNDC5 and irisin.
(a) pAb-E, which reacts with a C-terminal peptide (outside the irisin domain) was used to detect full-length FNDC5. This pAb-E detected no band in human serum samples (lanes 1–3), but mouse muscle extract showed a sharp band at ~25 kDa.(lane 4). (b, c) pAb-C was used to stain rNG-irisin (lane 1), G-irisin (lane 2) and human serum samples (lanes 3, 4) before (b) and after (c) deglycosylation with PNGase. All images were taken after 10 min of exposure without contrast enhancement.
Figure 3
Figure 3. Western blot of serum or plasma samples of different species with irisin antibodies pAb-A (a) and pAb-C (b).
Images were taken after 10 min (a) and 20 min (b) exposure and equally enhanced in contrast. Boxes indicate bands of rNG-irisin (rNGI), rG-irisin (rGI), and synthetic (SI) irisin. Samples in lanes 20–25 differ between (a) and (b).
Figure 4
Figure 4. Semi-quantitative analysis of western blots with pAb-C and comparison with ELISA data (based on pAb-A and pAb-C).
(a) Western blot (pAb-C) of serum samples of 4 individuals (lanes 1–4) at 6 time points (lanes a–f). RNG-irisin was included as positive control (lane 5). The image was taken after 10 min exposure. (b) Quantification of chemiluminescence of targeted bands (crosses) in marked lanes. Note that contrast enhancement in the region of measurement is only for visualization and does not influence the results. This measurement was done in all 156 samples from 26 individuals of a previous study. (c) Plot of normalized, combined band volumes against irisin levels measured with ELISA based on pAb-C. (d) Plot of irisin levels measured with ELISA based on pAb-A against ELISA based on pAb-C. (e) Quantification of a band (crosses) at 50 kDa detected by western blot of human serum samples with pAB-A. Samples were arbitrarily chosen from the previous study. (f) Volume of the non-specific 50 kDa band was plotted against irisin concentration measured with ELISA based on pAb-A.
Figure 5
Figure 5. Identification of proteins by mass spectrometry.
(a) Western blot of human and caprine serum before (lanes 1, 4) and after (lanes 2, 3) immuno-precipitation with pAb-C. Bands of interest are within white boxes. (b) Coomassie-stained gel with the same samples. After immuno-precipitation, target bands (black boxes) were cut out of the gel and analyzed. (c) Coomassie-stained gel with 500 ng rNG-irisin in PBS (lane 1), 500 ng and 100 ng rNG-irisin added to human serum (lanes 2 and 3) and human serum without addition (lane 4). Serum samples were albumin-depleted prior to electrophoresis. Gel pieces within black boxes were cut out and analyzed. (d) Addition of rG-irisin instead of rNG-irisin. Samples and procedure are as in (c). M: molecular weight marker.
Figure 6
Figure 6. FNDC5 transcripts and deduced peptides.
(a) Transcript structure of human FNDC5 (T1: NM_001171941.2, T2: NM_153756.2, T3: NM_001171940.1) and deduced peptide structure (P1–P3). Numbers refer to nucleotides (T1-3) or amino acids (P1–3). Black bars represent exons. Exon numbers are given in circles. Start and stop codons are indicated above the bars. The irisin peptide is marked by a bold box. The open box marks the truncated irisin peptide in P1 theoretically resulting from transcript T1. The size of irisin and FNDC5 protein variants is given. The peptide signature identified by mass spectrometry is marked in red. SP: signal peptide. (b) Example for detection of FNDC5 transcripts by RNA-sequencing of skeletal muscle biopsies. Exon 1a is specific for transcript T1 whereas exon 1b is part of transcripts T2 and T3. The panels represent results for one individual before (A1–A3) and after 12 weeks of training intervention (B1–B3). A1 and B1 were measured before, A2 and B2 immediately after, and A3 and B3 2 hours after acute exercise.

References

    1. Boström P. et al. A PGC1-α-dependent myokine that drives brown-fat-like development of white fat and thermogenesis. Nature 481, 463–468 (2012). - PMC - PubMed
    1. Ivanov I. P., Firth A. E., Michel A. M., Atkins J. F. & Baranov P. V. Identification of evolutionarily conserved non-AUG-initiated N-terminal extensions in human coding sequences. Nucleic Acids Res. 39, 4220–4234 (2011). - PMC - PubMed
    1. Raschke S. et al. Evidence against a beneficial effect of irisin in humans. PLOS ONE 8, e73680 (2013). - PMC - PubMed
    1. Timmons J. A., Baar K., Davidsen P. K. & Atherton P. J. Is irisin a human exercise gene? Nature 488, E9–10 (2012). - PubMed
    1. Huh J. Y. et al. FNDC5 and irisin in humans: I. Predictors of circulating concentrations in serum and plasma and II. mRNA expression and circulating concentrations in response to weight loss and exercise. Metabolism 61, 1725–1738 (2012). - PMC - PubMed

Publication types