

Human primordial germ cell commitment in vitro associates with a unique PRDM14 expression profile
- PMID: 25750208
- PMCID: PMC4406649
- DOI: 10.15252/embj.201488049
Human primordial germ cell commitment in vitro associates with a unique PRDM14 expression profile
Abstract
Primordial germ cells (PGCs) develop only into sperm and oocytes in vivo. The molecular mechanisms underlying human PGC specification are poorly understood due to inaccessibility of cell materials and lack of in vitro models for tracking the earliest stages of germ cell development. Here, we describe a defined and stepwise differentiation system for inducing pre-migratory PGC-like cells (PGCLCs) from human pluripotent stem cells (PSCs). In response to cytokines, PSCs differentiate first into a heterogeneous mesoderm-like cell population and then into PGCLCs, which exhibit minimal PRDM14 expression. PGC specification in humans is similar to the murine process, with the sequential activation of mesodermal and PGC genes, and the suppression of neural induction and of de novo DNA methylation, suggesting that human PGC formation is induced via epigenesis, the process of germ cell specification via inductive signals from surrounding somatic cells. This study demonstrates that PGC commitment in humans shares key features with that of the mouse, but also highlights key differences, including transcriptional regulation during the early stage of human PGC development (3-6 weeks). A more comprehensive understanding of human germ cell development may lead to methodology for successfully generating PSC-derived gametes for reproductive medicine.
Keywords: BLIMP1; human pluripotent stem cells; primordial germ cell precursors; primordial germ cell specification.
© 2015 The Authors. Published under the terms of the CC BY NC ND 4.0 license.
Figures
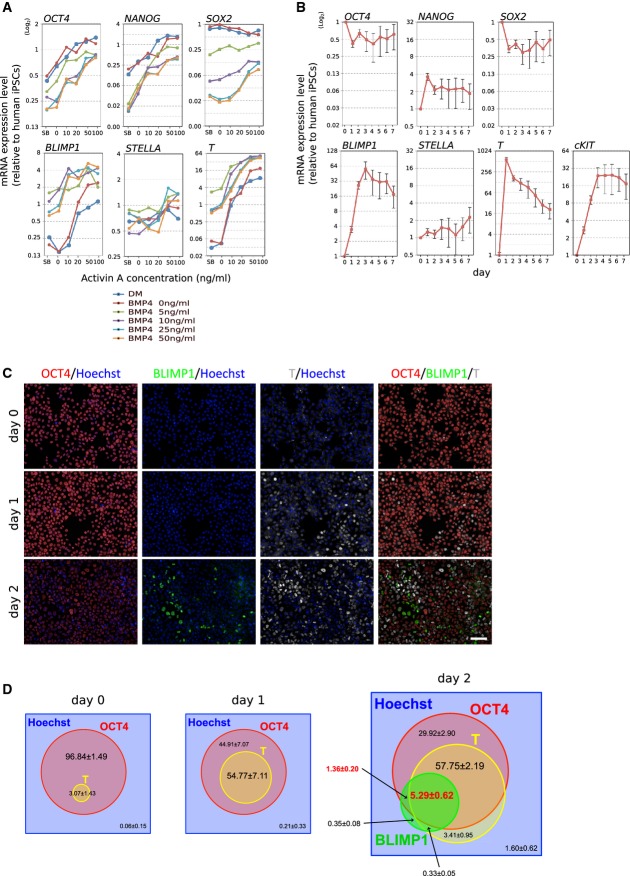
Effects of ActA and BMP4 on the expression of selected pluripotency, PGC, and mesodermal genes during PGC-precursor induction. DM: dorsomorphin, SB: SB431542. Samples were calibrated with iPSC values, and iPSC values depict 1. Y-axes are in log2 scale.
Gene expression dynamics of selected pluripotency, PGC, and mesodermal genes during prolonged PGC-precursor induction of up to day 7. Y-axes are in log2 scale.
Immunofluorescence analysis for OCT4 (red), BLIMP1 (green), and T (white) on days 0, 1, and 2. Nuclei were stained with Hoechst (blue). The culture contained BMP4 (5 ng/ml), Activin A (50 ng/ml), and bFGF (20 ng/ml). Scale bar: 100 μm.
Quantification of respective cell populations shown in (C).

Schematic presentation of PGC-precursor and PGCLC induction.
FACS analysis of the concentration-dependent effect of BMP4 on TRA-1-81+/cKIT+ PGCLCs on day 4. B25: 25 ng/ml BMP4; B50: 50 ng/ml BMP4; B100: 100 ng/ml BMP4.
FACS analysis of TRA-1-81 and cKIT during PGC induction of up to day 8.
Gene expression analysis of selected PGC markers in TRA-1-81+/cKIT+ and SSEA1+/cKIT+ FACS fractions of d4 PGCLCs. Samples were calibrated with iPSC values, and iPSC values depict 1.
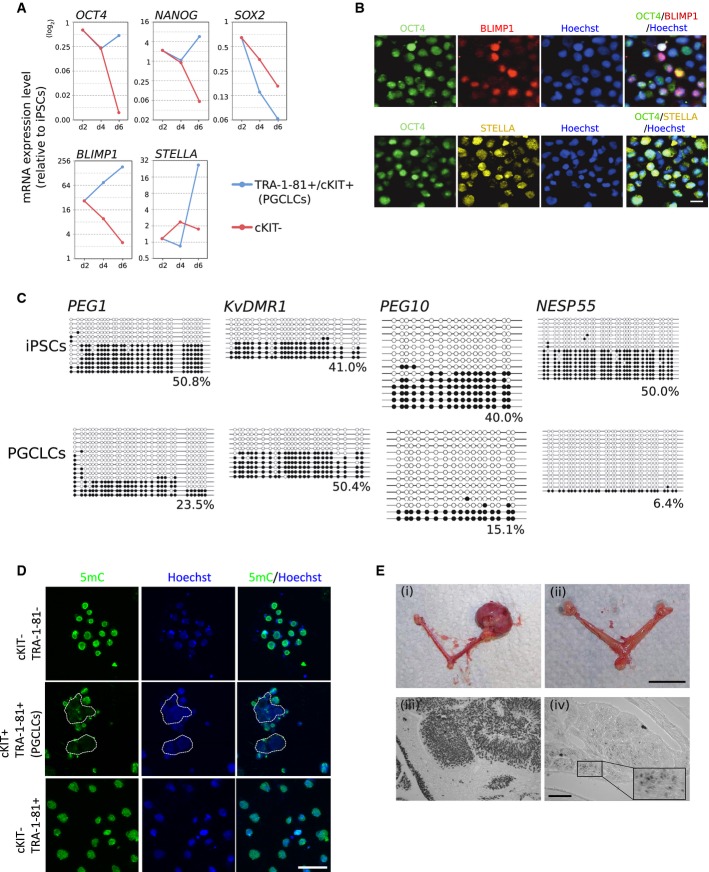
Gene expression dynamics of selected pluripotency and PGC genes in FACS-sorted, specified cells during PGC induction. The value for iPSCs is set as 1, and values are on log2 scale.
Immunofluorescence analysis for OCT4 (green), BLIMP1 (red), and STELLA (yellow) in TRA-1-81+/cKIT+ PGCLCs on day 6. Nuclei were stained with Hoechst (blue). Scale bar: 15 μm.
Bisulfite sequence analysis of DMRs of the imprinted genes (PEG1, KvDMR1, PEG10, and NESP55) in iPSCs (top) and d6 TRA-1-81+/cKIT+ PGCLCs (bottom). White and black circles represent unmethylated and methylated CpG sequences, respectively.
Immunofluorescence analysis for 5mC in d6 PGCLCs.Nuclei were stained with Hoechst (blue). Scale bar: 50 μm.
Transplantation of human iPSCs and PGCLCs into ovaries of recipient mice. (i) left ovary: control ovary without transplantation; right ovary: teratoma from iPSC-reconstituted ovary; (ii) PGCLC-reconstituted ovaries. Note that no teratomas had formed. Bottom panels: Immunohistochemical analysis for NUMA in sections of iPSC- and PGCLC-reconstituted ovaries. (iii) iPSC-induced teratoma shown in (i); (iv) ovary containing NUMA+ cells shown in (ii). Insert: higher magnification of selected area. Scale bars: (i) and (ii), 0.5 cm; (iii) and (iv), 50 μm.

Effects of KSR and WNT3A during PGC-precursor induction on the expression of selected pluripotency, PGC, and a mesodermal gene of d2 cultures. The value for iPSCs is set as 1, and values are on log2 scale. Data are presented as means ± SD (n = 3).
Effects of KSR and WNT3A on the induction of d6 PGCLCs as analyzed by FACS gated for TRA-1-81 and cKIT.
Gene expression analysis of selected PGC and hematopoietic markers in d6 PGCLCs that were cultured in 0% (control) or 20% KSR (KSR) condition during PGC-precursor induction. Samples were calibrated with iPSC values, and iPSC values depict 1. Data are presented as means ± SD (n = 3).
Immunofluorescence analysis for OCT4 (red), BLIMP1 (green), and T (yellow) in d2 precursors cultured in increasing KSR concentrations. Nuclei were stained with Hoechst (blue). Scale bar: 100 μm.
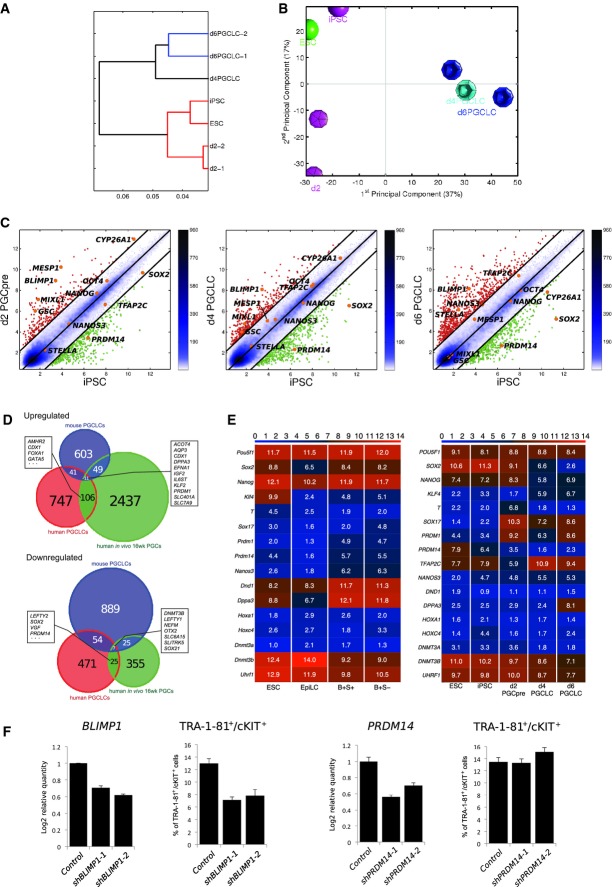
Unsupervised hierarchical clustering of HuES6 ESCs, 383.2 iPSCs, d2 PGC-precursor cultures, and FACS-sorted PGCLCs.
Principal component analysis of HuES6 ESCs, 393.2 iPSCs, d2 PGC-precursor cultures, and FACS-sorted PGCLCs.
Scatter plots of global gene expression microarrays comparing d2 PGC-precursor cultures, or d4 or d6 FACS-sorted PGCLCs with iPSCs.
Venn diagrams of the transcriptomics meta-analysis with the intersections of the DEGs of mouse in vitro PGCLCs, human in vivo PGCs, and human in vitro PGC-like cells in relation to their respective pluripotent counterparts in their respective platforms.
Heatmap of pluripotent, germ cell, mesodermal, and chromatin-related markers in mouse (left) and human (right) transcriptomics samples (Tfap2c is not targeted in the Illumina MouseRef-8 v2). The color bars codify the gene expression in log2 scale. Red corresponds to high gene expression. Blimp1+/Stella+ PGCLCs are denoted “B+S+”, and Blimp1+/Stella− PGCLCs are denoted “B+S−”.
Effect of knockdown of BLIMP1 and PRDM14 on PGCLC induction. Knockdown of BLIMP1 (F) and PRDM14 (G) was done using the lentiviral system with two individual shRNA vectors for each gene. The knockdown efficiencies were assessed by qPCR (left panel, each). The induction of d4 PGCLCs analyzed by FACS, gated for TRA-1-81 and cKIT (right panel, each). Data are presented as means ± SD (n = 3).
Comment in
-
Human germline differentiation charts a new course.EMBO J. 2015 Apr 15;34(8):975-7. doi: 10.15252/embj.201591447. Epub 2015 Mar 18. EMBO J. 2015. PMID: 25787856 Free PMC article.
References
-
- Aramaki S, Hayashi K, Kurimoto K, Ohta H, Yabuta Y, Iwanari H, Mochizuki Y, Hamakubo T, Kato Y, Shirahige K, Saitou M. A mesodermal factor, T, specifies mouse germ cell fate by directly activating germline determinants. Dev Cell. 2013;27:516–529. - PubMed
-
- Ashburner M, Ball CA, Blake JA, Botstein D, Butler H, Cherry JM, Davis AP, Dolinski K, Dwight SS, Eppig JT, Harris MA, Hill DP, Issel-Tarver L, Kasarskis A, Lewis S, Matese JC, Richardson JC, Ringwald M, Rubin GM, Sherlock G. Gene ontology: tool for the unification of biology. Nat Genet. 2000;25:25–29. - PMC - PubMed
-
- Brons IG, Smithers LE, Trotter MW, Rugg-Gunn P, Sun B, Chuva de Sousa Lopes SM, Howlett SK, Clarkson A, Ahrlund-Richter L, Pedersen RA, Vallier L. Derivation of pluripotent epiblast stem cells from mammalian embryos. Nature. 2007;448:191–195. - PubMed
-
- Bucay N, Yebra M, Cirulli V, Afrikanova I, Kaido T, Hayek A, Montgomery AM. A novel approach for the derivation of putative primordial germ cells and sertoli cells from human embryonic stem cells. Stem Cells. 2009;27:68–77. - PubMed
Publication types
MeSH terms
Substances
LinkOut - more resources
Full Text Sources
Other Literature Sources
Molecular Biology Databases
