. 2015 May;14(5):454-73.
doi: 10.1128/EC.00262-14. Epub 2015 Mar 6.

Neospora caninum Recruits Host Cell Structures to Its Parasitophorous Vacuole and Salvages Lipids from Organelles

Affiliations

Neospora caninum Recruits Host Cell Structures to Its Parasitophorous Vacuole and Salvages Lipids from Organelles

Sabrina J Nolan et al. Eukaryot Cell. 2015 May.

Abstract

Toxoplasma gondii and Neospora caninum, which cause the diseases toxoplasmosis and neosporosis, respectively, are two closely related apicomplexan parasites. They have similar heteroxenous life cycles and conserved genomes and share many metabolic features. Despite these similarities, T. gondii and N. caninum differ in their transmission strategies and zoonotic potential. Comparative analyses of the two parasites are important to identify the unique biological features that underlie the basis of host preference and pathogenicity. T. gondii and N. caninum are obligate intravacuolar parasites; in contrast to T. gondii, events that occur during N. caninum infection remain largely uncharacterized. We examined the capability of N. caninum (Liverpool isolate) to interact with host organelles and scavenge nutrients in comparison to that of T. gondii (RH strain). N. caninum reorganizes the host microtubular cytoskeleton and attracts endoplasmic reticulum (ER), mitochondria, lysosomes, multivesicular bodies, and Golgi vesicles to its vacuole though with some notable differences from T. gondii. For example, the host ER gathers around the N. caninum parasitophorous vacuole (PV) but does not physically associate with the vacuolar membrane; the host Golgi apparatus surrounds the N. caninum PV but does not fragment into ministacks. N. caninum relies on plasma lipoproteins and scavenges cholesterol from NPC1-containing endocytic organelles. This parasite salvages sphingolipids from host Golgi Rab14 vesicles that it sequesters into its vacuole. Our data highlight a remarkable degree of conservation in the intracellular infection program of N. caninum and T. gondii. The minor differences between the two parasites related to the recruitment and rearrangement of host organelles around their vacuoles likely reflect divergent evolutionary paths.


Figures

FIG 1
FIG 1
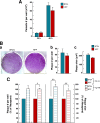
Growth specificity of Nc-Liv in vitro. (A) Comparison of the replication rate of Nc-Liv in BT24 cells and HFF. Cell monolayers of BT24 cells and HFF seeded in six-well plates were infected with the same-sized inocula of Nc-Liv and then washed after 2 h. Cells were scraped 24 h or 48 h p.i., and the total number of parasites in each well was assessed using a hemocytometer. Data are means ± SD (n = 3 separate assays). (B) Comparison of the growth rate of Nc-Liv in BT24 cells and HFF using plaque assays. Panel a illustrates the representative area of monolayers of BT24 cells or HFF destroyed by the parasite. The mean numbers (b) and areas (c) of the plaques ± SD were calculated from three independent experiments. (C) Comparison of the growth rate of Nc-Liv and T. gondii (RH) in BT24 cells and HFF using plaque assays. The mean numbers and areas of the plaques ± SD are expressed as a percentage relative to the control value (infection with Nc-Liv), which was set as 100%, for three independent experiments. Results were statistically significant (*, P < 0.05; **, P < 0.01).
FIG 2
FIG 2
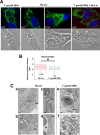
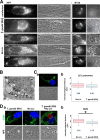
Host mitochondria interaction with the PV of Nc-Liv. (A) Immunofluorescence assays (IFA) of host mitochondria in T. gondii (RH)- or Nc-Liv-infected cells. HFF or BT24 cells were infected with T. gondii (RH) and/or Nc-Liv, fixed, and stained with 4′,6′-diamidino-2-phenylindole (DAPI; blue, nucleus) and antibodies against Tom20 (green, mitochondria). In a coinfection assay, the antibody 21H7A was used to identify Nc-Liv (red, PV). An asterisk identifies a coinfected cell. Representative extended-focus images are shown. Arrowheads and arrows pinpoint the PV of T. gondii (RH) and Nc-Liv, respectively. (B) Quantitative comparison of mitochondrion recruitment by Nc-Liv and T. gondii (RH) by MetaScopics analysis. Box plots show the average distances, weighted by intensity, of the host mitochondria to the PV boundary, as calculated for host mitochondrial profiles included in a 7-μm radius of the PV (data from 94 infected HFF at 24 h p.i.). The lines inside the box are the median values; the numbers written under the plot are the mean fluorescence intensities. A comparison between the values for the two parasites is statistically significant (*, P < 0.004). (C) Ultrastructural analysis of the host mitochondrion-PV interaction. EM of Nc-Liv-infected BT24 cells (a to d) and T. gondii (RH)-infected HFF (e and f) showing the distribution of host mitochondria (hm) relative to the PV. a, amylopectin granule. Scale bar, 0.5 μm.
FIG 3
FIG 3
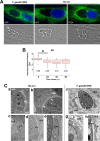
Host ER interaction with the PV of Nc-Liv. (A) IFA of host ER in T. gondii (RH)- or Nc-Liv-infected cells. HFF or BT24 cells were infected with T. gondii (RH) or Nc-Liv, fixed, and stained with 4′,6′-diamidino-2-phenylindole (DAPI; blue, nucleus) and antibodies against KDEL (green, ER). Representative extended-focus images are shown. Arrowheads and arrows pinpoint the PV of T. gondii (RH) and Nc-Liv, respectively. (B) MetaScopics analysis of the kinetics of host ER recruitment by Nc-Liv. Box plots show the average distance, weighted by intensity, of host ER to the PV boundary, as calculated for host ER profiles detected within a 7-μm radius of the PV (data from 158 infected HFF at 24 h p.i.). The lines inside the box are the median values; the numbers written under the plot are the mean fluorescence intensities. A comparison between the values for the ER distributions at 8 h and 24 h is statistically significant (*, P < 0.0001). (C) Ultrastructural analysis of host ER-PV interaction. EM of Nc-Liv-infected BT24 cells (a to e) and T. gondii (RH)-infected HFF (f to h) showing the distribution of host ER (hER) relative to the PV. Arrowheads show the distribution of ribosomes on the ER side facing the host cytoplasm and not the T. gondii (RH) PV membrane. Scale bar, 0.5 μm.
FIG 4
FIG 4
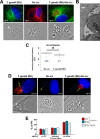
Host microtubules and MTOC association with the PV of Nc-Liv. (A) IFA of host microtubules in T. gondii (RH)- and/or Nc-Liv-infected cells. HFF were infected with T. gondii (RH) or Nc-Liv, fixed, and stained with 4′,6′-diamidino-2-phenylindole (DAPI; blue, nucleus), and antibodies against α-tubulin (green or red, microtubules) during mono-infection and during a coinfection with anti-GRA7 antibodies to identify T. gondii (RH) (red, PV). Representative extended-focus images are shown. Arrowheads and arrows pinpoint the PV of T. gondii (RH) and Nc-Liv, respectively. (B) EM of a view of a PV of Nc-Liv in BT24 cells showing host microtubules (hMT) aligned along the PV membrane. Scale bar, 0.5 μm. (C) Quantitative comparison of microtubule recruitment by Nc-Liv and T. gondii (RH) by MetaScopics analysis. Box plots show the average distances, weighted by intensity, of the host microtubules to the PV boundary, as calculated for host microtubules in a 7-μm radius of the PV (data from 26 infected HFF at 24 h p.i.). The lines inside the box are the median values; the numbers written under the plot are the mean fluorescence intensities. A comparison between the results for the two parasites is statistically significant (*, P < 0.01). (D) IFA of host MTOC in T. gondii (RH)- and/or Nc-Liv-infected cells. BT24 cells or HFF were infected with T. gondii (RH) or Nc-Liv, fixed, and stained with DAPI (blue, nucleus), antibodies against γ-tubulin as a marker of the MTOC (green), indicated by yellow arrows during mono-infection, and GRA7 to identify T. gondii (RH) (red, PV) in a coinfected cell. Note that the anti-γ-tubulin antibodies also label the MTOC/centrosome of Nc-Liv. Representative extended-focus images are shown. Arrowheads and arrows pinpoint the PV of T. gondii (RH) and Nc-Liv, respectively. (E) Quantification of the distribution of the PV of Nc-Liv or T. gondii (RH) relative to the host nucleus (hNuc). The distribution of the host MTOC has been classified as follows: on the PV, equidistant to the PV and the host nucleus, and close to the host nucleus. Data, expressed as a percentage of the PV population, are means ± SD of three independent assays for Nc-Liv and means for a representative experiment for T. gondii (RH), with a minimum of 150 vacuoles counted in each experiment.
FIG 5
FIG 5
Host endosomal organelle interaction with the PV of Nc-Liv. (A) Live fluorescence microscopy of cells incubated with LysoTracker. HFF or BT24 cells, uninfected or infected with T. gondii (RH) or Nc-Liv, were incubated for 1 h with LysoTracker before observation by live fluorescence microscopy. Arrowheads and arrows pinpoint the PV of T. gondii (RH) and Nc-Liv, respectively. (B) Ultrastructural analysis of Nc-Liv incubated with LDL-labeled organelles. Nc-Liv-infected CHO cells incubated with LDL-gold particles for 24 h show the concentration of host LDL-containing endolysosomes (hE-L) at the PV membrane. Scale bar, 0.5 μm. (C) IFA of host endocytic structures in Nc-Liv-infected HFF is shown in panel a. HFF were infected with Nc-Liv, fixed, and stained with 4′,6′-diamidino-2-phenylindole (DAPI; blue, nucleus) and antibodies against LAMP1 (green, late endosomes/lysosomes). Panel b shows a quantitative comparison of host late endosome (LE)-lysosome recruitment by Nc-Liv and T. gondii (RH) by MetaScopics analysis. Box plots show the average distance, weighted by intensity, of LAMP1-positive structures to the PV boundary, as calculated for all of these host organelles within in a 7-μm radius of the PV (data from 26 infected cells at 24 h p.i.). (D) Panel a shows an IFA of host multivesicular bodies (MVBs) in T. gondii (RH)- and/or Nc-Liv-infected HFF. HFF were infected with T. gondii (RH) or Nc-Liv, fixed, and stained with DAPI (blue, nucleus) and antibodies against CD63 (green, MVB) during mono-infection and during a coinfection with anti-GRA7 antibodies to identify T. gondii (RH) (red, PV). Arrowheads and arrows pinpoint the PV of T. gondii (RH) and Nc-Liv, respectively. Panel b shows a quantitative comparison of host MVB recruitment by Nc-Liv and T. gondii (RH) by MetaScopics analysis. Box plots show the average distance, weighted by intensity, of MVB to the PV boundary, as calculated for all of the MVB within in a 7-μm radius of the PV (data from 68 infected HFF at 24 h p.i.). The lines inside the box are the median values; the numbers written under the plot are the mean fluorescence intensities. A comparison between the results for the two parasites is statistically significant (*, P < 0.002).
FIG 6
FIG 6
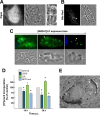
Cholesterol uptake and storage by Nc-Liv. (A) Fluorescence microscopy of Nc-Liv-infected HFF labeled with filipin. HFF were infected with Nc-Liv for 24 h, fixed, and stained with the fluorescent dye filipin for sterols, which shows strong fluorescence associated with the PV (arrow) and the parasite's plasma membrane and rhoptries (arrowhead). (B) Fluorescence microscopy of Nc-Liv-infected HFF labeled with Nile Red. HFF were infected with Nc-Liv for 24 h, fixed, and stained with Nile Red for lipid bodies (arrowhead). (C) Live fluorescence microscopy of Nc-Liv-infected HFF incubated with exogenous fluorescent cholesterol. HFF infected with Nc-Liv for 24 h (arrows) were incubated with NBD-cholesterol incorporated into lipoproteins ([NBD-C]LP) for 5 to 20 min prior to observation by live fluorescence microscopy, which shows cholesterol on the plasma membrane and then in lipid bodies (arrowheads). (D) Influence of exogenous lipoproteins on Nc-Liv proliferation. Uracil incorporation by Nc-Liv at 18 h or 36 h p.i. in either CHO cells grown in medium containing 10% FBS (CHO ctl), 10% delipidated FBS (LPDS), or 10% LPDS supplemented with 1 mg/ml of LDL (LDL) or in CHO cells with defective NPC1 (NPC1mut). Data are percentages ± SD relative to the control (set as 100%) from four separate experiments done in triplicate. Differences between the results for the control and experimental groups were statistically significant (*, P < 0.05). (E) Ultrastructural analysis of Nc-Liv-infected NPC1 mutant cells. EM of Nc-Liv (P) incubated for 36 h in CHO cells lacking functional NPC1. Small PV size with parasite membrane defects and abnormal lipid accumulation in the PV lumen (arrows) were observed. Scale bar, 0.5 μm.
FIG 7
FIG 7
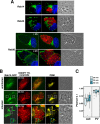
Host Golgi apparatus interaction with the PV of Nc-Liv. (A) IFA of host Golgi apparatus in Nc-Liv-infected cells. HeLa cells, HFF, or BT24 cells were infected with Nc-Liv at the indicated times, fixed, and stained with 4′,6′-diamidino-2-phenylindole (DAPI; blue, nucleus) and with antibodies against giantin (red, cis- and medial Golgi apparatus) and either 21H7A (green, panels a and b) or NcP1-S (green, panel c) to stain the parasite. Representative extended-focus images are shown. Arrows pinpoint the PV of Nc-Liv. (B) Ultrastructural analysis of host Golgi apparatus-PV interaction. EM of Nc-Liv-infected BT24 cells showing the gathering of small Golgi stacks (arrows) around the PV. Scale bar, 0.5 μm. (C) Quantitative measurement of Golgi apparatus recruitment by Nc-Liv using MetaScopics. Box plots show the average distance from the host Golgi complex centroid to the nearest PV boundary. In BT24 cells, the host Golgi complex centroid distance to the PV decreased progressively as the PV size increased (data from 90 infected BT24 cells at 24 h p.i.). In HFF, the host Golgi complex centroid distance to the PV decreased progressively in a statistically significant manner between 24 h, 32 h, and 48 h p.i. (157 infected HFF at the indicated times) (*, P < 0.001).
FIG 8
FIG 8
Sphingolipid uptake by Nc-Liv. Live fluorescence microscopy images of HFF incubated with fluorescent ceramides are shown. HFF, uninfected or infected with Nc-Liv for 24 h, were incubated with NBD-C6-ceramide complexed to BSA at the indicated times and washed before live microscopy observations. Staining was gradually observed on the host cell Golgi (Go) apparatus from 15 min, on the PV (arrows) from 30 min, on the parasite's plasma membrane from 1 h, and on the parasite's Golgi apparatus (4 h, double arrows). In parallel assays, infected HFF were treated with 10 μM pyrimethamine (+pyr) for 24 h prior to the addition of fluorescent ceramides for 2 h, which produced negligible PV staining (arrows). Egressed parasites also displayed fluorescent staining in internal structures (4 h).
FIG 9
FIG 9
Interception of host Golgi apparatus-derived vesicles by Nc-Liv. (A) Fluorescence microscopy of Nc-Liv-infected HFF expressing GFP-Rab14, -Rab43, or -Rab30. HFF expressing the GFP-Rab constructs (green) were infected for 24 h or 30 h with Nc-Liv, fixed, and stained with 4′,6′-diamidino-2-phenylindole (DAPI; blue, nucleus) and antibodies against NcP1-S (red, parasite). The distribution of GFP-Rab-positive vesicles around individual PV (arrows), in mono- or multi-infected cells, is shown in extended-focus images. (B) HFF expressing GFP-Rab14 (green), either uninfected or infected with Nc-Liv for 24 h, were incubated in the presence of BODIPY TR C5-ceramide (red) at the indicated times. An optical z-slice is shown for the merged, BODIPY TR C5-ceramide and GFP-Rab14 channels plus the positive PDM. The white and blue boxes highlight GFP-Rab14 vesicles inside the PV (arrows) and along the PV membrane, respectively. (C) Box plots showing the values of the PCC for colocalization of vesicles containing GFP-Rab14 and BODIPY TR C5-ceramide in either the entire cell or solely in the PV membrane and lumen at 20, 30, and 40 min of BODIPY TR C5-ceramide exposure.

References

    1. Dubey JP, Barr BC, Barta JR, Bjerkas I, Bjorkman C, Blaqburn BJ, Bowman DD, Buxton D, Ellis JT, Gottstein B, Hemphill A, Hill DE, Howe DK, Jenkins MC, Kobayashi Y, Koudela B, Marsh AE, Mattsson JG, McAllister MM, Modrý D, Omata Y, Sibley LD, Speer CA, Trees AJ, Uggla A, Upton SJ, Williams DJ, Lindsay DS. 2002. Redescription of Neospora caninum and its differentiation from related coccidia. Int J Parasitol 32:929–946. doi:10.1016/S0020-7519(02)00094-2. - DOI - PubMed
    1. Reid AJ, Vermont SJ, Cotton JA, Harris D, Hill-Cawthorne GA, Könen-Waisman S, Latham SM, Mourier T, Norton R, Quail MA, Sanders M, Shanmugam D, Sohal A, Wasmuth JD, Brunk B, Grigg ME, Howard JC, Parkinson J, Roos DS, Trees AJ, Berriman M, Pain A, Wastling JM. 2012. Comparative genomics of the apicomplexan parasites Toxoplasma gondii and Neospora caninum: Coccidia differing in host range and transmission strategy. PLoS Pathog 8:e1002567. doi:10.1371/journal.ppat.1002567. - DOI - PMC - PubMed
    1. Tenter AM, Heckeroth AR, Weiss LM. 2000. Toxoplasma gondii: from animals to humans. Int J Parasitol 30:1217–1258. doi:10.1016/S0020-7519(00)00124-7. - DOI - PMC - PubMed
    1. Luft BJ, Remington JS. 1992. Toxoplasmic encephalitis in AIDS. Clin Infect Dis 15:211–222. doi:10.1093/clinids/15.2.211. - DOI - PubMed
    1. Kieffer F, Wallon M. 2013. Congenital toxoplasmosis. Handb Clin Neurol 112:1099–1101. doi:10.1016/B978-0-444-52910-7.00028-3. - DOI - PubMed

Publication types

LinkOut - more resources