. 2014 Dec 1;112(24):3173-3182.
doi: 10.1080/00268976.2014.934313.

Insights into copper coordination in the EcoRI-DNA complex by ESR spectroscopy

Affiliations

Insights into copper coordination in the EcoRI-DNA complex by ESR spectroscopy

Ming Ji et al. Mol Phys. .

Abstract

The EcoRI restriction endonuclease requires one divalent metal ion in each of two symmetrical and identical catalytic sites to catalyse double-strand DNA cleavage. Recently, we showed that Cu2+ binds outside the catalytic sites to a pair of new sites at H114 in each sub-unit, and inhibits Mg2+ -catalysed DNA cleavage. In order to provide more detailed structural information on this new metal ion binding site, we performed W-band (~94 GHz) and X-band (~9.5 GHz) electron spin resonance spectroscopic measurements on the EcoRI-DNA-(Cu2+ )2 complex. Cu2+ binding results in two distinct components with different gzz and Azz values. X-band electron spin echo envelope modulation results indicate that both components arise from a Cu2+ coordinated to histidine. This observation is further confirmed by the hyperfine sub-level correlation results. W-band electron nuclear double resonance spectra provide evidence for equatorial coordination of water molecules to the Cu2+ ions.

Keywords: Cu2+ inhibition; ESEEM; W-band ENDOR; metal ion coordination; restriction endonuclease.


Figures

Figure A1
Figure A1
The experimental (solid line) and simulated (dotted line) three pulse ESEEM time domain data and spectra of the Cu2+ –EcoRI–DNA complex at external magnetic field 3369 G (a and b), 3189 G (c and d), 3116 G (e and f), and 3050 G (g and h). In the simulation, only signal from cp1 is included.
Figure A2
Figure A2
The experimental (solid line) and simulated (dotted line) three pulse ESEEM time domain data and spectra of the Cu2+ -EcoRI–DNA complex at external magnetic field 3369 G (a and b), 3189 G (c and d), 3116 G (e and f), and 3050 G (g and h). In the simulation, only signal from cp2 is included.
Figure 1
Figure 1
The definition of the relative orientation between external magnetic field and PAS of g-tensor, PAS of A-tensor and g-tensor, and PAS of Q-tensor and g-tensor. The relative orientation between external magnetic field and PAS of g-tensor is described by θ and ϕ. The relative orientations between the PAS of Q-tensor and g-tensor and between the PAS of A-tensor and g-tensor are described by two sets of Euler angles (α1, β1, γ1) and (α2, β2, γ2), respectively.
Figure 2
Figure 2
(a) The experimental (black solid line) and simulated (black dashed line) W-band (~94 GHz) FS-ESE spectrum of the Cu2+ -EcoRI–DNA complex at 20 K. (b) The first derivative of the W-band FS-ESE spectrum in (a). Experimental result is shown by the black solid line and simulated result is shown by the black dashed line. The best-fitting simulations were obtained with the following parameters: (cp 1) gxx = gyy = 2.055, gzz = 2.289, Axx = Ayy = 20 G, Azz = 163 G and (cp2) gxx = 2.072, gyy = 2.035, gzz = 2.227, Axx =Ayy = 20 G, Azz = 143 G. The relative ratio of the two components is close to 1:1.
Figure 3
Figure 3
(a) and (b) Two Cu2+ coordination environments postulated from the MD simulations, described in detail by Yang et al. [7]; (c) W-band 1H Davies (32,610 G) and Mims ENDOR (30,130 G and 29,500 G) spectra in H2O and simulated spectra (dashed and dotted lines) for equatorial and axially coordinated water. The inset is the W-band FS-ESE spectrum of the Cu2+ –EcoRI–DNA complex. The magnetic fields at which the ENDOR data were collected are indicated by arrows in the inset.
Figure 4
Figure 4
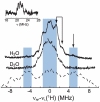
1H Davies ENDOR spectra of the Cu2+ –EcoRI–DNA sample in H2O (solid line) and D2O (dotted line) at 32,610 G. The dashed line shows the scaled-up 2H Mims ENDOR spectrum. The inset is the unscaled 2H Mims ENDOR spectrum.
Figure 5
Figure 5
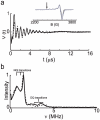
The experimental (solid line) and simulated (dashed line) three pulse ESEEM time domain data and spectrum of the Cu2+ –EcoRI–DNA complex at 2810G.
Figure 6
Figure 6
The experimental (solid line) and simulated (dashed line) three pulse ESEEM time domain data and spectra of the Cu2+ –EcoRI–DNA complex at external magnetic field 3369 G (a and b), 3189 G (c and d), 3116 G (e and f), and 3050 G (g and h).
Figure 7
Figure 7
The experimental (a, c and e) and simulated (b, d, and f) HYSCORE spectra of the Cu2+ –EcoRI–DNA complex at external magnetic field 3369 G (a and b), 3189 G (c and d), 3116 G (e and f). The intensity of the simulated spectra is graded from black (0.05) to white (0.5).

References

    1. Pingoud A, Fuxreiter M, Pingoud V, Wende W. Cell. Mol. Life Sci. 2005;62(685) - PMC - PubMed
    1. Lesser DR, Kurpiewski MR, Jen-Jacobson L. Science. 1990;250(776) - PubMed
    1. Sapienza PJ, dela Torre CA, McCoy WH, IV, Jana SV, Jen-Jacobson L. J. Mol. Biol. 2005;348(307) - PubMed
    1. Kurpiewski MR, Engler LE, Wozniak LA, Kobylanska A, Koziolkiewicz M, Stec WJ, Jen-Jacobson L. Structure. 2004;12(1775) - PubMed
    1. Sapienza PJ, Niu T, Kurpiewski MR, Grigorescu A, Jen-Jacobson L. J. Mol. Biol. 2014;426(84) - PMC - PubMed