. 2015 Feb 20:9:96.
doi: 10.3389/fnhum.2015.00096. eCollection 2015.

Comparing different stimulus configurations for population receptive field mapping in human fMRI

Affiliations

Comparing different stimulus configurations for population receptive field mapping in human fMRI

Ivan Alvarez et al. Front Hum Neurosci. .

Abstract

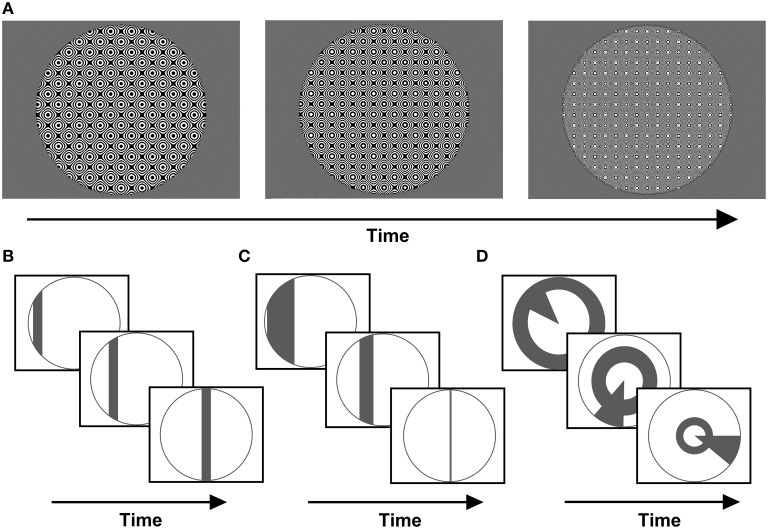
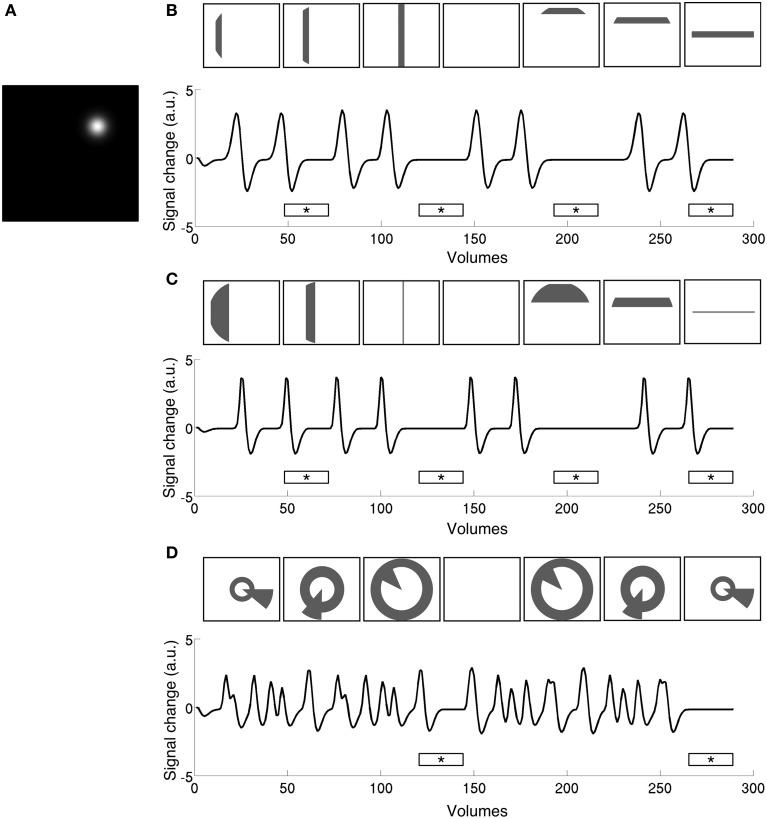
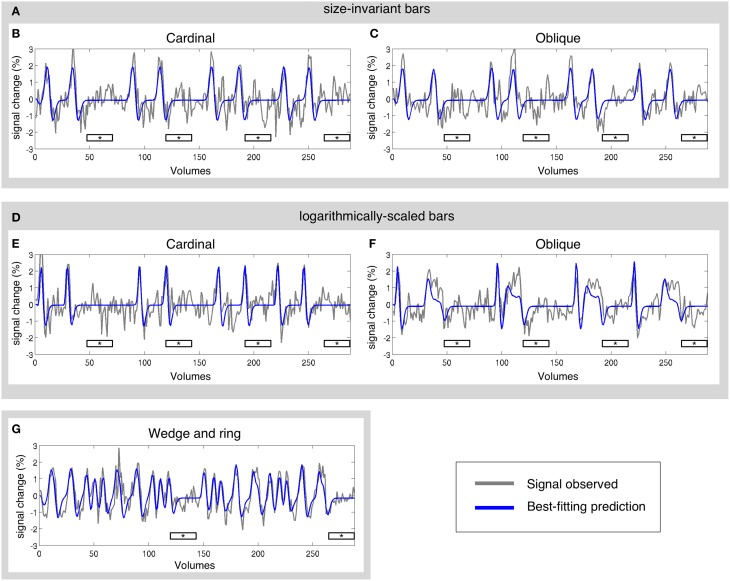
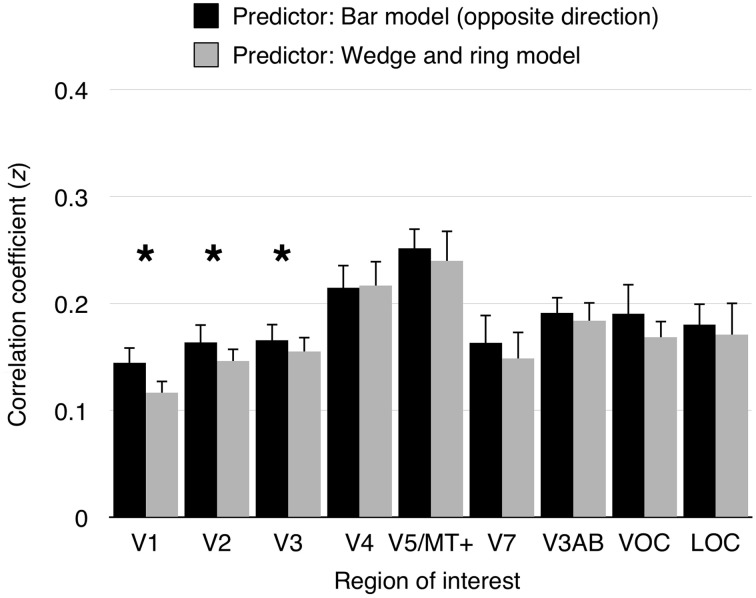
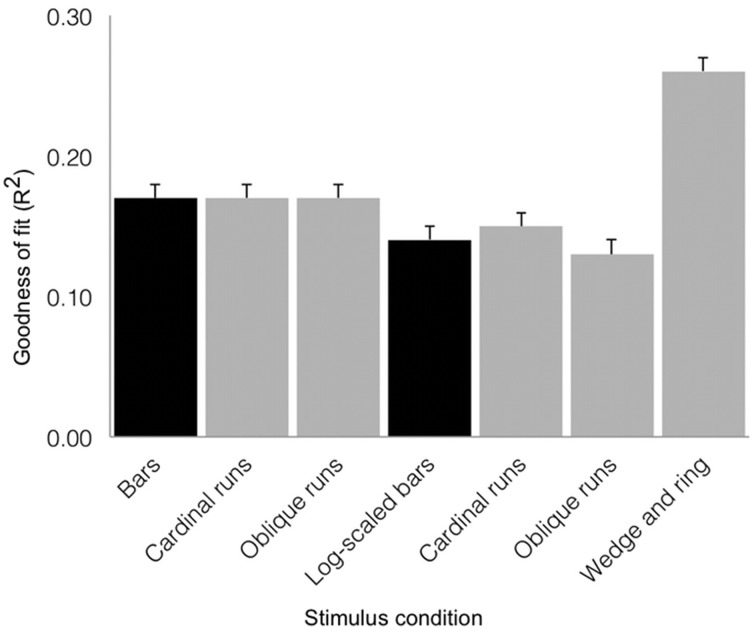
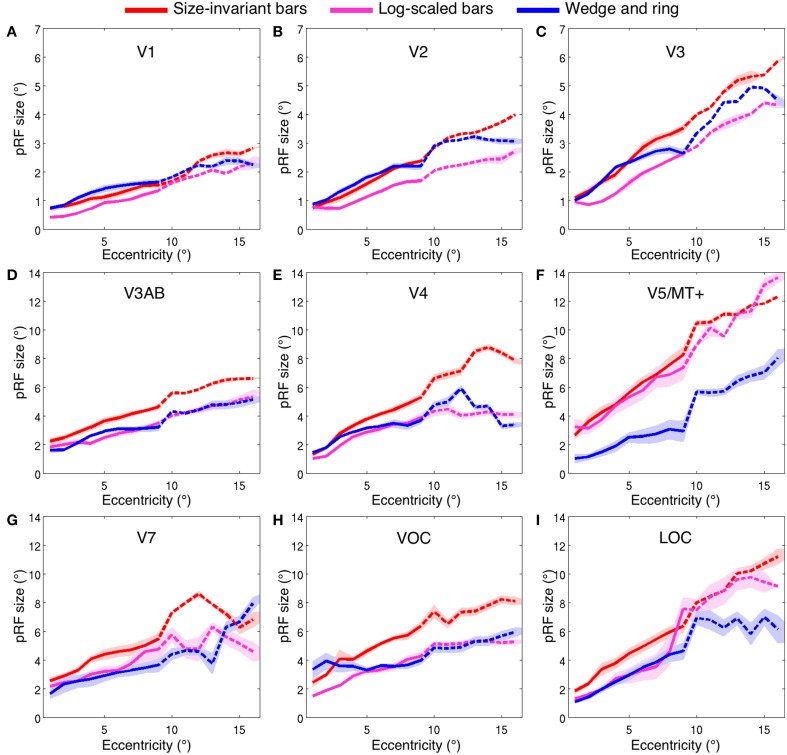
Population receptive field (pRF) mapping is a widely used approach to measuring aggregate human visual receptive field properties by recording non-invasive signals using functional MRI. Despite growing interest, no study to date has systematically investigated the effects of different stimulus configurations on pRF estimates from human visual cortex. Here we compared the effects of three different stimulus configurations on a model-based approach to pRF estimation: size-invariant bars and eccentricity-scaled bars defined in Cartesian coordinates and traveling along the cardinal axes, and a novel simultaneous "wedge and ring" stimulus defined in polar coordinates, systematically covering polar and eccentricity axes. We found that the presence or absence of eccentricity scaling had a significant effect on goodness of fit and pRF size estimates. Further, variability in pRF size estimates was directly influenced by stimulus configuration, particularly for higher visual areas including V5/MT+. Finally, we compared eccentricity estimation between phase-encoded and model-based pRF approaches. We observed a tendency for more peripheral eccentricity estimates using phase-encoded methods, independent of stimulus size. We conclude that both eccentricity scaling and polar rather than Cartesian stimulus configuration are important considerations for optimal experimental design in pRF mapping. While all stimulus configurations produce adequate estimates, simultaneous wedge and ring stimulation produced higher fit reliability, with a significant advantage in reduced acquisition time.

Keywords: fMRI; pRF; population receptive field modeling; primary visual cortex (V1); retinotopy; stimulus design; visual cortex.


Figures

Figure 1
Figure 1
(A) Example frames from the stimulus carrier, a checkerboard-like, luminance-modulated pattern varying in spatial frequency, described in full in the methods section. Stimuli were presented with either (B) size-invariant bar apertures, (C) bars logarithmically-scaled with eccentricity, or (D) a simultaneous “wedge and ring” aperture, cycling at different frequencies and scaled logarithmically with eccentricity (again, example frames are shown for each stimulus type).
Figure 2
Figure 2
Time series predictions for stimulation to a single pRF (A) under size-invariant bars (B), logarithmically-scaled bars (C), and simultaneous wedge and ring (D), stimulus configurations. Use of a standard bar design produces large baseline zones that are uninformative to the model as to pRF location and spread. In contrast, the simultaneous wedge and ring stimulus based on polar angle coordinates stimulates the pRF more frequently, providing more elicited events fitted by the model. Stimulus frames are illustrative and do not correspond to specific time points along the time-series. Mean luminance periods indicated by asterisk bars.
Figure 3
Figure 3
Sample time-series and best-fitting model prediction for one vertex (cortical surface element) in area V2 from a representative participant. Time-series are presented for three main conditions and four sub-conditions; (A) size-invariant bars, including its (B) cardinal and (C) oblique sweep directions; (D) logarithmically-scaled bars, including its (E) cardinal and (F) oblique sweep directions; and finally (G) simultaneous wedge and ring stimulation. Mean luminance periods indicated by asterisk bars. All conditions were fitted independently.
Figure 4
Figure 4
Polar angle maps overlaid on inflated left hemisphere for a representative participant. Polar angle estimates were derived independently from population receptive field modeling under stimulation by (A) size-invariant bars, (B) logarithmically-scaled bars and (C) simultaneous wedge and ring stimuli. (D) In addition, phase-encoded analysis of simultaneous wedge and ring stimulus is presented. Regions of interest are labeled and boundaries highlighted for the size invariant bars condition, which was used to identify those regions. Color corresponds to visual field position, as indicated by the color wheel in the upper right corner.
Figure 5
Figure 5
Model cross-validation. Cardinal and oblique orientations of size-invariant bars were predicted by a pRF model derived from either opposite bar direction or simultaneous wedge and ring stimulation. Model prediction were correlated with the signal observed in the predicted condition. Data from cardinal bars predicted from the oblique bars pRF model and oblique bars predicted from the cardinal bars pRF model were collapsed into “opposite bar direction” predictions. Similarly, predictions of either cardinal or oblique bars signal predicted from the simultaneous wedge and ring pRF model were collapsed into simultaneous wedge and ring predictions. Correlation coefficients were transformed to z-values (Fisher's z-transformation). A significant difference in prediction was observed in areas V1 (z difference = 0.03), V2 (z difference = 0.02), and V3 (z difference = 0.01), but not in higher visual areas. Asterisk indicates significant difference between conditions (p < 0.05).
Figure 6
Figure 6
Group average goodness of fit (R2) for the three stimulus configurations as derived from sum of squared residuals between the observed time series and model predictions for regions V1, V2, and V3 combined (error bars correspond to standard errors of the mean). Black shading denotes estimates from 576 volumes acquired and gray shading denotes estimates derived from 288 volumes acquired. Simultaneous wedge and ring stimulation produced better data fits, while requiring half the data compared to size-invariant or logarithmically-scaled bars collapsed across bar directions.
Figure 7
Figure 7
Population receptive field size (σ, in degrees of visual angle) across two ranges of visual field eccentricities; 9° (solid line, six participants) and 16° (dashed line, two participants). Vertices were binned and averaged across participants in steps of 1° of eccentricity and plotted for three stimulus configurations; size-invariant bars (red), logarithmically-scaled bars (magenta) and simultaneous wedge and ring stimulus (blue). Nine bilateral regions of interest displayed; (A) V1, (B) V2, (C) V3, (D) V3AB, (E) V4, (F) V5/MT+, (G) V7, (H) VOC and (I) LOC. Shaded area corresponds to standard error of the mean.
Figure 8
Figure 8
(A) Comparison of eccentricity estimates by pRF and phase-encoded methods for regions V1, V2, and V3. Each point represents a single surface vertex in a single participant, only vertices with goodness of fit R2 > 0.05 displayed. (A) The maximum eccentricity of the stimulus differed between participants (16° display in red and 9° display in blue), reproduced in the eccentricity estimates where two distinct populations are seen. (B) Values normalized by maximum eccentricity show a similar discrepancy for phase-encoded estimates relative to the pRF estimates, independent of maximum stimulus size. Dashed line denotes identity; i.e., a perfect correspondence between the pRF and phase-encoded estimates of eccentricity. Solid line in (B) denotes best-fitting second-level polynomial over all subjects.

References

    1. Amano K., Wandell B. A., Dumoulin S. O. (2009). Visual field maps, population receptive field sizes, and visual field coverage in the human MT+ complex. J. Neurophysiol. 102, 2704–2718. 10.1152/jn.00102.2009 - DOI - PMC - PubMed
    1. Andersson J., Hutton C., Ashburner J., Turner R., Friston K. J. (2001). Modelling geometric deformations in EPI time series. Neuroimage 13, 903–919. 10.1006/nimg.2001.0746 - DOI - PubMed
    1. Ashburner J., Friston K. J. (1997). Spatial transformation of images, in Human Brain Function, eds Frackowiak R. S., Friston K. J., Frith C. D., Dolan R. J., Mazziotta J. C. (Waltham, MA: Academic Press; ), 43–58.
    1. Ashburner J., Friston K. J. (2005). Unified segmentation. Neuroimage 26, 839–851. 10.1016/j.neuroimage.2005.02.018 - DOI - PubMed
    1. Baseler H. A., Gouws A., Haak K. V., Racey C., Crossland M. D., Tufail A., et al. . (2011). Large-scale remapping of visual cortex is absent in adult humans with macular degeneration. Nat. Neurosci. 14, 649–655. 10.1038/nn.2793 - DOI - PubMed

LinkOut - more resources