. 2015 Mar 9;10(3):e0119587.
doi: 10.1371/journal.pone.0119587. eCollection 2015.

Accumulation of advanced glycation end-products and activation of the SCAP/SREBP Lipogenetic pathway occur in diet-induced obese mouse skeletal muscle

Affiliations

Accumulation of advanced glycation end-products and activation of the SCAP/SREBP Lipogenetic pathway occur in diet-induced obese mouse skeletal muscle

Raffaella Mastrocola et al. PLoS One. .

Abstract

Aim of this study was to investigate whether advanced glycation end-products (AGEs) accumulate in skeletal myofibers of two different animal models of diabesity and whether this accumulation could be associated to myosteatosis. Male C57Bl/6j mice and leptin-deficient ob/ob mice were divided into three groups and underwent 15 weeks of dietary manipulation: standard diet-fed C57 group (C57, n = 10), high-fat high-sugar diet-fed C57 group (HFHS, n = 10), and standard diet-fed ob/ob group (OB/OB, n = 8). HFHS mice and OB/OB mice developed glycometabolic abnormalities in association with decreased mass of the gastrocnemius muscle, fast-to-slow transition of muscle fibers, and lipid accumulation (that occurred preferentially in slow compared to fast fibers). Moreover, we found in muscle fibers of HFHS and OB/OB mice accumulation of AGEs that was preferential for the lipid-accumulating cells, increased expression of the lipogenic pathway SCAP/SREBP, and co-localisation between AGEs and SCAP-(hyper)expressing cells (suggestive for SCAP glycosylation). The increased expression of the SCAP/SREBP lipogenic pathway in muscle fibers is a possible mechanism underlying lipid accumulation and linking myosteatosis to muscle fiber atrophy and fast-to-slow transition that occur in response to diabesity.


Conflict of interest statement

Competing Interests: The authors have declared that no competing interests exist.

Figures

Fig 1
Fig 1. Oral glucose tolerance test.
OGTT was performed on 6-hours fasted standard diet fed-C57 mice (C57, n = 10), high-fat high-sucrose fed-C57 mice (HFHS, n = 10), and standard diet-fed leptin-deficient mice (OB/OB, n = 8). Glycemic values before (Basal) and 15, 30, 60, 120 minutes after glucose loading are reported. Results are means ± SD. *P<0.05, **P<0.01, ***P<0.005 vs C57 # P<0.05, ### P<0.005 vs HFHS.
Fig 2
Fig 2. Gastrocnemius intramyocellular lipid accumulation, triglyceride content, and SCAP/SREBP pathway analysis.
(A) Representative 20x magnification photomicrographs of Oil Red staining on gastrocnemius sections from C57, HFHS, and OB/OB mice performed on 8–10 mice per group. (B) Triglyceride (TG) content in gastrocnemius homogenates of the three groups. (C) Representative western blotting analysis for SCAP, mSREBP1c, ACC, pACC, and FASN. (D) Histograms report densitometric analyses of 8–10 mice per group (results were normalized with respect to alpha-tubulin densitometric value). *P<0.05, **P<0.01, ***P<0.005 vs C57; ## P<0.01, ### P<0.005 vs HFHS.
Fig 3
Fig 3. Gastrocnemius myosin heavy chain isoform composition.
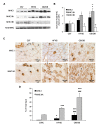
(A) Representative western blotting analysis for the expression of MHC I, MHC IIA, MHC IIB isoforms and total MHC on gastrocnemius total protein extracts from C57, HFHS, and OB/OB mice. (B) Histograms report densitometric analyses of MHC isoforms normalized for the total MHC content of 8–10 mice per group. (C) Representative 20x magnification photomicrographs of immunohistochemistry analysis for MHC I and MHC IIA on gastrocnemius frozen sections of the three groups. MHC I positive myofibers are marked with a in serial sections; MHC IIA positive myofibers are marked with b in serial sections. (D) Histograms report the percentage of MHC I and MHC IIA positive fibers counted on 200–500 fibers per animal (8–10 mice per group). *P<0.05, **P<0.01, ***P<0.005 vs C57; # P<0.05, ### P<0.005 vs HFHS.
Fig 4
Fig 4. Gastrocnemius colocalization of IMCL and oxidative MHC isoforms.
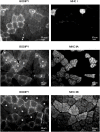
The fluorescent stain BODIPY was used to visualize IMCL accumulation in association with immunofluorescence analysis for MHC I, MHC IIA and MHC IIB on gastrocnemius sections from HFHS and OB/OB mice (5 mice per group). Representative 32x magnification photomicrographs of an HFHS mouse showing IMCL overlapping only with MHC I and IIA isoforms. Double fluorescent staining was performed on the same section and the MHC isoform positive myofibers shown on the right image are starred on the left image.
Fig 5
Fig 5. Gastrocnemius levels of glycated proteins and AGEs receptors expression.
Representative western blotting analysis for CML and CEL modified-proteins (A) and for RAGE and AGE-R1 expression (B) performed on gastrocnemius total protein extracts from C57, HFHS, and OB/OB mice. (C,D) Histograms report densitometric analyses of 8–10 mice per group. *P<0.05, ***P<0.005 vs C57; # P<0.05, ## P<0.01 vs HFHS.
Fig 6
Fig 6. Gastrocnemius localization of AGEs.
Representative 10x/40x magnification photomicrographs of immunofluorescence analyses for CML, CEL, and RAGE on gastrocnemius sections from C57, HFHS, and OB/OB mice performed on 8–10 mice per group.
Fig 7
Fig 7. Gastrocnemius colocalization of IMCL and AGEs.
BODIPY stain was used to visualize IMCL in association with immunofluorescence analysis for CML and CEL on gastrocnemius sections from HFHS and OB/OB mice (5 mice per group). Representative 32x/63x magnification photomicrographs of an HFHS mouse show wide overlapping between IMCL positive myofibers (left panels) and CML- or CEL-positive myofibers (right panels).
Fig 8
Fig 8. Gastrocnemius colocalization between SCAP and CML.
Double immunfluorescent analysis for CML and SCAP was performed on gastrocnemius sections from HFHS and OB/OB mice (5 mice per group). Representative 32x/100x photomicrographs of an HFHS mouse show wide overlapping between CML and SCAP in the cytosolic compartment of myofibers.

References

    1. Bifulco M, Caruso MG. From the gastronomic revolution to the new globesity epidemic. J Am Diet Assoc. 2007;107: 2058–2060. - PubMed
    1. Yamagishi S, Matsui T. Advanced glycation end products, oxidative stress and diabetic nephropathy. Oxid Med Cell Longev. 2010;3: 101–108. 10.4161/oxim.3.2.11148 - DOI - PMC - PubMed
    1. Yuan Y, Zhao L, Chen Y, Moorhead JF, Varghese Z, Powis SH, et al. Advanced glycation end products (AGEs) increase human mesangial foam cell formation by increasing Golgi SCAP glycosylation in vitro. Am J Physiol Renal Physiol. 2011;301: F236–243. 10.1152/ajprenal.00646.2010 - DOI - PubMed
    1. Yamagishi S. Role of advanced glycation end products (AGEs) and receptor for AGEs (RAGE) in vascular damage in diabetes. Exp Gerontol. 2011;46: 217–224. 10.1016/j.exger.2010.11.007 - DOI - PubMed
    1. Chilelli NC, Burlina S, Lapolla A. AGEs, rather than hyperglycemia, are responsible for microvascular complications in diabetes: a "glycoxidation-centric" point of view. Nutr Metab Cardiovasc Dis. 2013;23: 913–919. 10.1016/j.numecd.2013.04.004 - DOI - PubMed

Publication types

MeSH terms

Substances