. 2015 Apr;33(4):395-401.
doi: 10.1038/nbt.3121. Epub 2015 Mar 9.

ChIP-nexus enables improved detection of in vivo transcription factor binding footprints

Affiliations

ChIP-nexus enables improved detection of in vivo transcription factor binding footprints

Qiye He et al. Nat Biotechnol. 2015 Apr.

Abstract

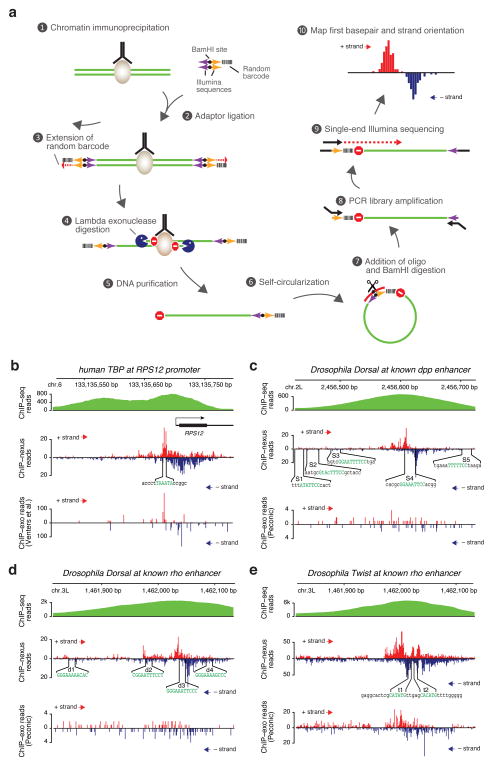
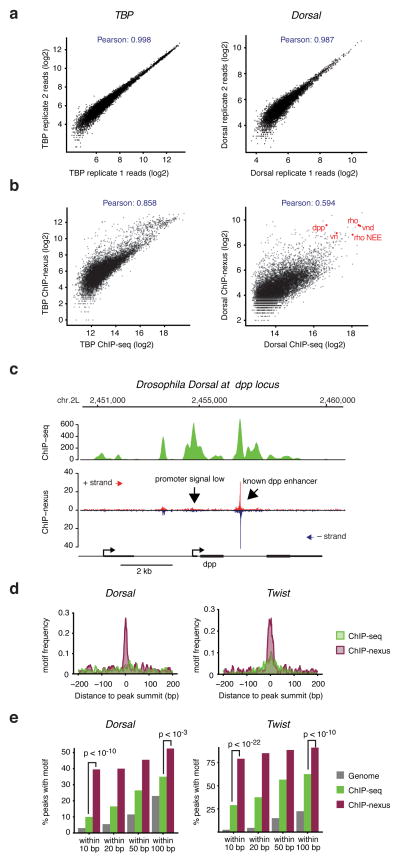
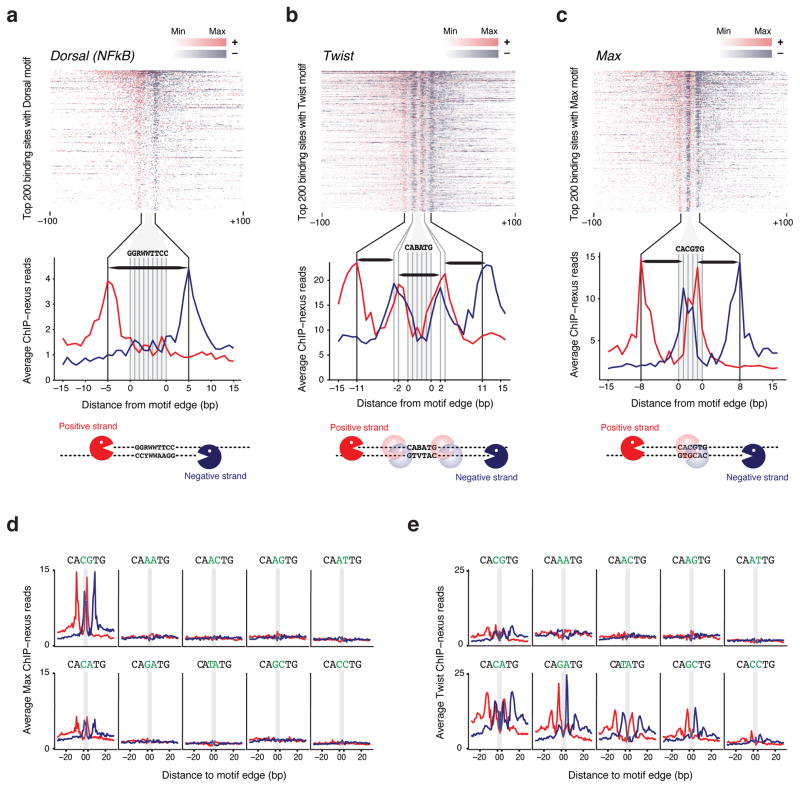
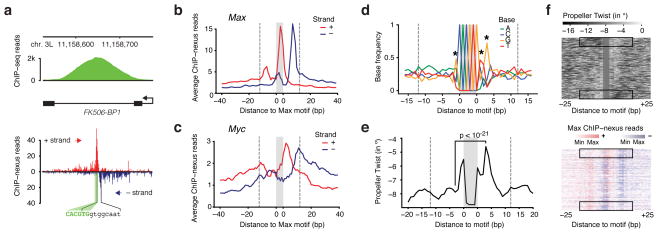
Understanding how eukaryotic enhancers are bound and regulated by specific combinations of transcription factors is still a major challenge. To better map transcription factor binding genome-wide at nucleotide resolution in vivo, we have developed a robust ChIP-exo protocol called ChIP-nexus (chromatin immunoprecipitation experiments with nucleotide resolution through exonuclease, unique barcode and single ligation), which utilizes an efficient DNA self-circularization step during library preparation. Application of ChIP-nexus to four proteins--human TBP and Drosophila NFkB, Twist and Max--shows that it outperforms existing ChIP protocols in resolution and specificity, pinpoints relevant binding sites within enhancers containing multiple binding motifs, and allows for the analysis of in vivo binding specificities. Notably, we show that Max frequently interacts with DNA sequences next to its motif, and that this binding pattern correlates with local DNA-sequence features such as DNA shape. ChIP-nexus will be broadly applicable to the study of in vivo transcription factor binding specificity and its relationship to cis-regulatory changes in humans and model organisms.


Figures

Figure 1
Figure 1. Superior performance of ChIP-nexus in discovering relevant binding footprints for transcription factors
(a) Outline of ChIP-nexus 1) The transcription factor of interest (brown) is immunoprecipitated from chromatin fragments with antibodies in the same way as during conventional ChIP-seq experiments. 2) While still bound to the antibodies, the DNA ends are repaired, dA-tailed and then ligated to a special adaptor that contains a pair of sequences for library amplification (arrows indicate the correct orientation for them to be functional), a BamHI site (black dot) for linearization, and a 9-nucleotide barcode containing 5 random bases and 4 fixed bases to remove reads resulting from over-amplification of library DNA. The barcode is part of a 5′ overhang, which reduces adaptor-adaptor ligation. 3) After the adaptor ligation step, the 5′ overhang is filled, copying the random barcode and generating blunt ends for lambda exonuclease digestion. 4) Lambda exonuclease (blue Pacman) digests until it encounters a physical barrier such as a cross-linked protein-DNA complex (‘Do not enter’ sign = ‘stop base’). 5) Single-stranded DNA is eluted and purified. 6) Self-circularization places the barcode next to the ‘stop base’. 7) An oligonucleotide (red arc) is paired with the region around the BamHI site for BamHI digestion (black scissors). 8) The digestion results in re-linearized DNA fragments with suitable Illumina sequences on both ends, ready for PCR library amplification. 9) Using single-end sequencing with the standard Illumina primer, each fragment is sequenced: first the barcode, then the genomic sequence starting with the ‘stop base’. 10) After alignment of the genomic sequences, reads with identical start positions and identical barcodes are removed. The final output is the position, number and strand orientation of the ‘stop’ bases. The frequencies of ‘stop’ bases on the positive strand are shown in red, while those on the negative strand are shown in blue. (b–e) Comparison of conventional ChIP-seq data (extended reads), ChIP-nexus data (raw stop base reads) and data generated using the original ChIP-exo protocol (raw stop base reads). (b) TBP profiles in human K562 cells at the RPS12 promoter. Although ChIP-nexus and ChIP-exo generally agree on TBP binding footprints, ChIP-nexus provides better coverage and richer details than ChIP-exo, which shows signs of over-amplification as large numbers of reads accumulate at a few discreet bases. (c) Dorsal profiles at the D. melanogaster decapentaplegic (dpp) enhancer. Five “Strong” dorsal binding sites (S1–S5) were previously mapped by in vitro DNase footprinting . Note that ChIP-nexus identifies S4 as the only site with significant Dorsal binding in vivo. At the same time, ChIP-exo performed by Peconic did not detect any clear Dorsal footprint within the enhancer, in part due to the low read counts obtained. (d) Dorsal profiles at the rhomboid (rho) NEE enhancer. Four Dorsal binding sites (d1–d4) were previously mapped by in vitro DNase footprinting . Note that ChIP-nexus identifies d3 as the strongest dorsal binding site in vivo, consistent with its close proximity to two Twist binding sites. Again, the original ChIP-exo protocol did not detect any clear Dorsal footprint within the enhancer. (e) Twist profiles at the same rho enhancer. Note that ChIP-nexus shows strong Twist footprints surrounding the two Twist binding sites (t1, t2) . In this case, ChIP-exo performed by Peconic identified a similar Twist footprint. This shows that the Peconic experiments, which were performed with the same chromatin extracts as the Dorsal experiments, worked in principle but were less robust than our ChIP-nexus experiments.
Figure 2
Figure 2. High reproducibility, resolution and specificity of ChIP-nexus as compared to ChIP-seq
(a) Comparisons between biological ChIP-nexus replicates were performed by calling peaks using MACS 2 in replicate 1 (200 bp centered on the peak summit, up to 10,000 peaks as arbitrary cutoff) and by plotting the average raw reads for each peak in both replicates. A tight line is observed for all factors, corresponding to Pearson correlations of 0.98–0.99. TBP, which has the highest correlation, is shown on the left, whereas Dorsal, which has the lowest correlation, is shown on the right. (b) Comparison between ChIP-seq and ChIP-nexus. Peaks were called in the ChIP-seq data as in (a) and reads in these peaks from ChIP-seq and ChIP-nexus data are shown as a scatter plot. As can be seen for both TBP and Twist, there is an overall good correlation between the bulk data (Pearson correlations between 0.5–0.9). However, the ChIP-nexus data show an increased signal for a fraction of peaks. (c) Examination of individual examples shows that the ChIP-nexus signal is indeed highly specific. For example, the known dpp enhancer as shown in Figure 2 has a strong ChIP-nexus footprint (arrow), whereas the signal at the dpp promoter, which is equally high in the ChIP-seq data, has much lower and more distributed ChIP-nexus reads without any typical footprint (arrow). (d) Frequency distribution of consensus motifs in peaks identified by ChIP-seq (green) and ChIP-nexus (purple). Shown are the examples of Dorsal (left), for which ChIP-nexus shows a dramatic increase in motifs directly at the summit of the peaks, as well as for Twist (right), for which ChIP-nexus shows a more moderate improvement in motif frequency over ChIP-seq. (e) Quantification of the motif frequency in random genomic regions, in ChIP-seq peaks and in ChIP-nexus peaks within increasing windows from the peaks’ summits for Dorsal and Twist. ChIP-nexus performs much better at a close interval to the peak summit (within 10 bp on either side, Chi2 test, Dorsal p<10−11, Twist p<10−14), underscoring the increased specificity of ChIP-nexus. But even at wider intervals (within 100 bp on either side of the summit), ChIP-nexus peaks contain more motifs (Chi2 test, Dorsal p<2×10⁻³, Twist p<10−5), suggesting that ChIP-nexus has higher specificity as compared to ChIP-seq.
Figure 3
Figure 3. Analysis of the Dorsal, Twist and Max in vivo footprint
(a–c) For each factor, the top 200 motifs with the highest ChIP-nexus read counts were selected and are shown in descending order as heat map. The footprints show a consistent boundary on the positive strand (red) and negative strand (blue) around each motif. The zoomed-in average profile below reveals that the footprints are wider than the motif. A schematic representation of the digestion pattern is shown below using Pacman symbols for lambda exonuclease. (a) The ChIP-nexus footprint for Dorsal (NFkB) on its canonical motif (GGRWWTTCC with up to one mismatch) extends on average 5 bp away from the motif edge. Thus, the average dorsal footprint is 18 bp long (horizontal black bar). (b) The Twist ChIP-nexus footprint on the E-box motif CABATG (no mismatch) has two outside boundaries, one at 11 bp, and one at 2 bp away from the motif edge, suggesting interactions with flanking DNA sequences. Each portion of the footprint is around 8–9bp long (horizontal black bar). (c) The Max ChIP-nexus footprint on its canonical E-box motif (CACGTG, no mismatch) has an outside boundary at 8 bp away from the motif edge, as well as a boundary inside the motif (at the A/T base), suggesting two partial footprints (horizontal black bars). (d, e) Average Max and Twist ChIP-nexus footprints at the top 200 sites for all possible E-box variants (CANNTG). Each variant profile includes its reverse complement. (d) Max binds specifically to the canonical CACGTG motif and to a lesser extent to the CACATG motif. Note that the Max footprint shape looks identical between the two motifs. (e) In contrast, the Twist binding specificity and the footprint shape is more complex. Notably, the outer boundary at -11bp is stronger at the CATATG and CACATG motif, whereas the inner boundary at -2 bp is stronger at the CAGATG motif.
Figure 4
Figure 4. Favored interaction side of Max at E-Box motifs correlates with DNA features in the flanking sequences
(a) Single-gene examples of the ChIP-nexus footprints show that the Max profile indeed consists of two separate footprints, one of which is frequently dominant. For example, in the Fk506-BP1 intron, the Max footprint (black brackets) is found to the right of the E-box motif (green). (b) Average Max ChIP-nexus profile at the top 200 CACGTG motifs after orienting each footprint such that the higher signal is to the right. The area of the motif is shaded in grey and the extended area of the footprint is demarcated with dotted lines from the motif (at 12 bp away from the motif to include most reads from the footprint). (c) Average Myc ChIP-nexus profile at the same motifs shown in (b) shows that Myc’s footprint is generally localized to the same side of the motif as Max. (d) Average base composition of the oriented E-box motifs from (b). Significant differences in nucleotides within the area of the footprint are marked with a star (Chi2 test, p < 10−24 for the G to the right and p < 10−12 for all others). The consensus sequence for orientation to the right is RCACGTGYTG. (e) The oriented sequences also show a marked difference in predicted DNA shape, notably the propeller twist score between a base pair (measured in degrees of rotation). At the third position from the motif, the difference is the highest (paired t-test, p<10−21). Note that on the favored interaction side, the predicted propeller twist is more neutral (seen as peak due to the negative scale). (f) Differences in DNA propeller twist in regions flanking the E-box motif correlate with Max ChIP-nexus footprint level. In the upper panel, the top 200 motifs were ordered by the difference in the mean DNA propeller twist measurements within the 6 bp flanking the E-box on both sides. The Max ChIP-nexus heatmap with the same order of motifs (lower panel) shows that the favored interaction side is most pronounced when there is an asymmetry in the DNA propeller twist around the motif (black boxes).

References

    1. Spitz F, Furlong EE. Transcription factors: from enhancer binding to developmental control. Nat Rev Genet. 2012;13:613–626. - PubMed
    1. Bardet AF, et al. Identification of transcription factor binding sites from ChIP-seq data at high resolution. Bioinformatics. 2013;29:2705–2713. - PMC - PubMed
    1. Rhee HS, Pugh BF. Comprehensive genome-wide protein-DNA interactions detected at single-nucleotide resolution. Cell. 2011;147:1408–1419. - PMC - PubMed
    1. Rhee HS, Pugh BF. ChIP-exo method for identifying genomic location of DNA-binding proteins with near-single-nucleotide accuracy. Curr Protoc Mol Biol. 2012;Chapter 21(Unit 21):24. - PMC - PubMed
    1. Rhee HS, Pugh BF. Genome-wide structure and organization of eukaryotic preinitiation complexes. Nature. 2012;483:295–301. - PMC - PubMed

Publication types

Associated data