. 2015 Apr;125(4):1620-36.
doi: 10.1172/JCI75417. Epub 2015 Mar 9.

KIM-1-mediated phagocytosis reduces acute injury to the kidney

KIM-1-mediated phagocytosis reduces acute injury to the kidney

Li Yang et al. J Clin Invest. 2015 Apr.

Abstract

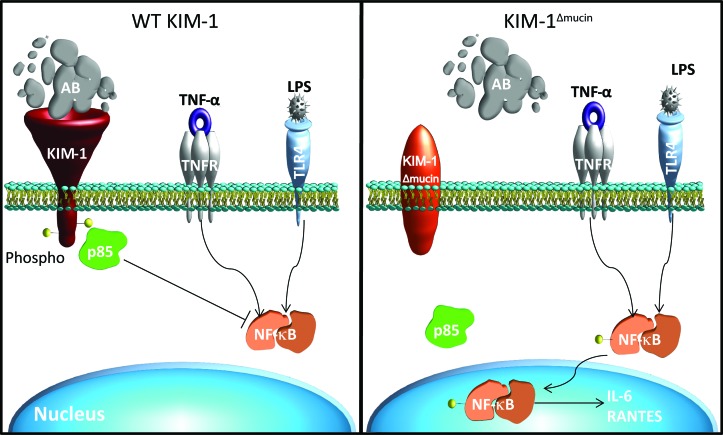
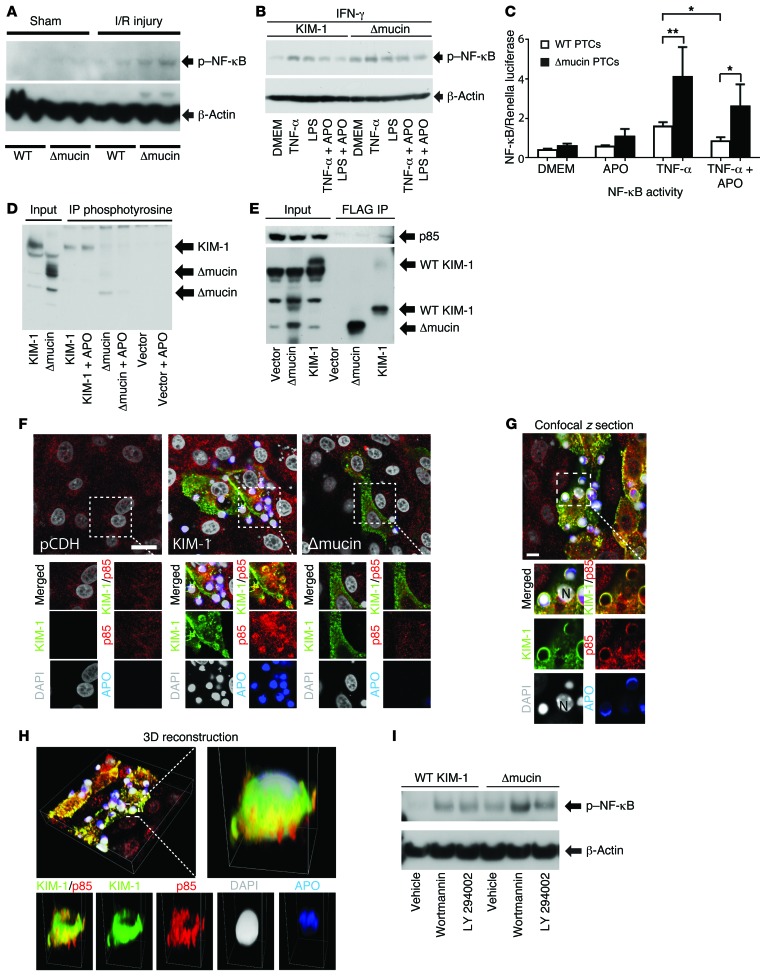
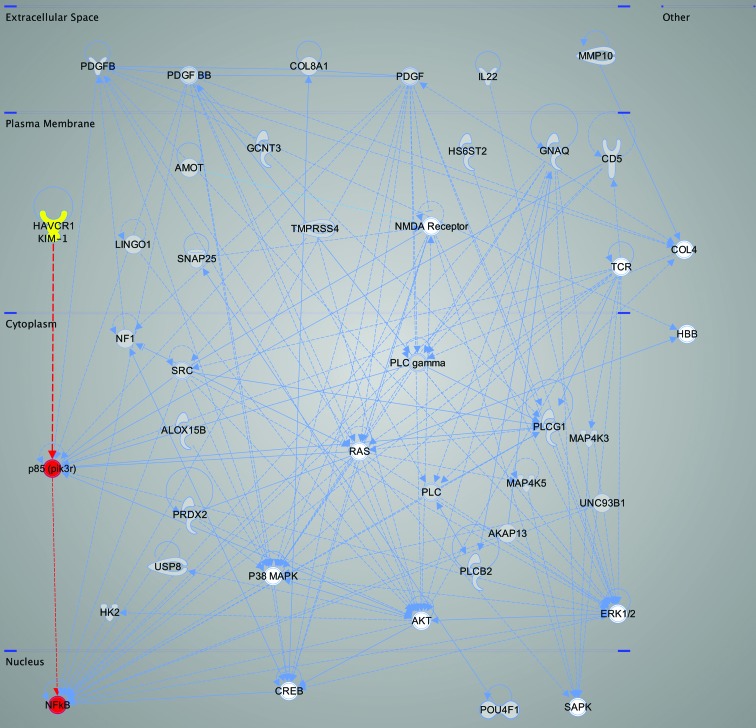
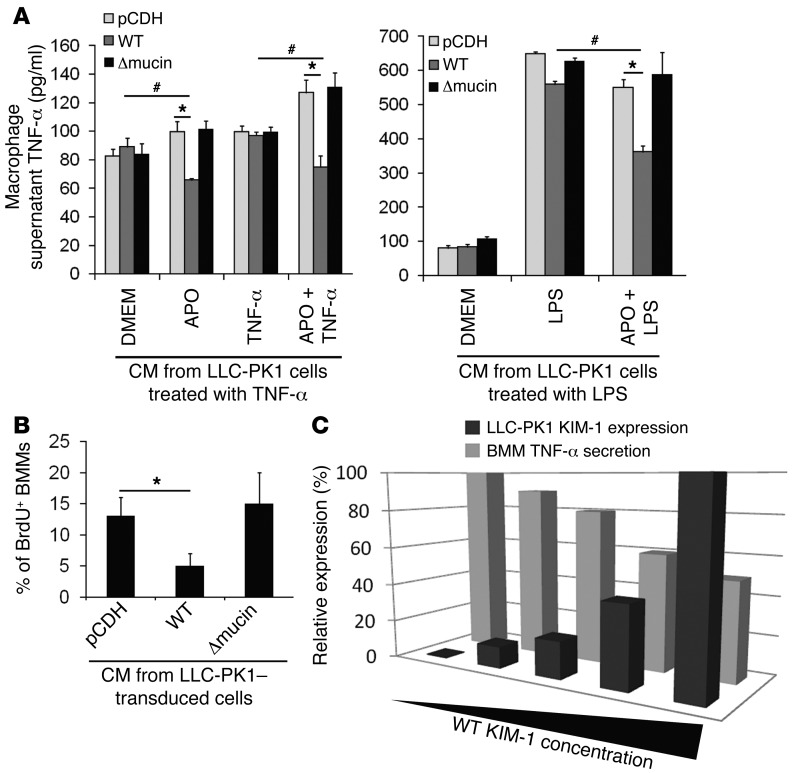
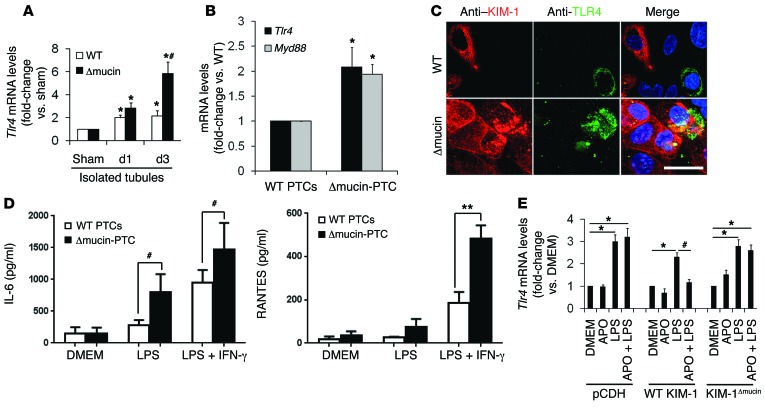
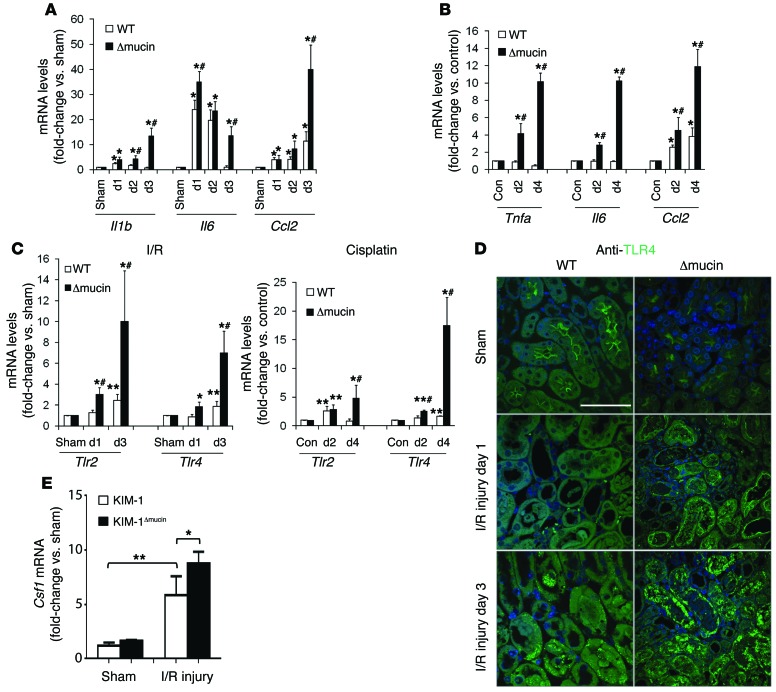
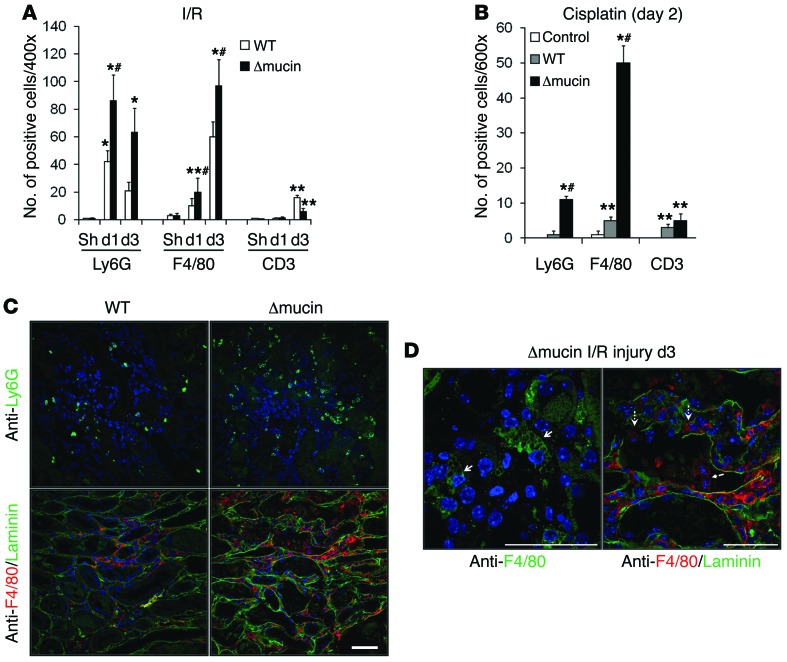
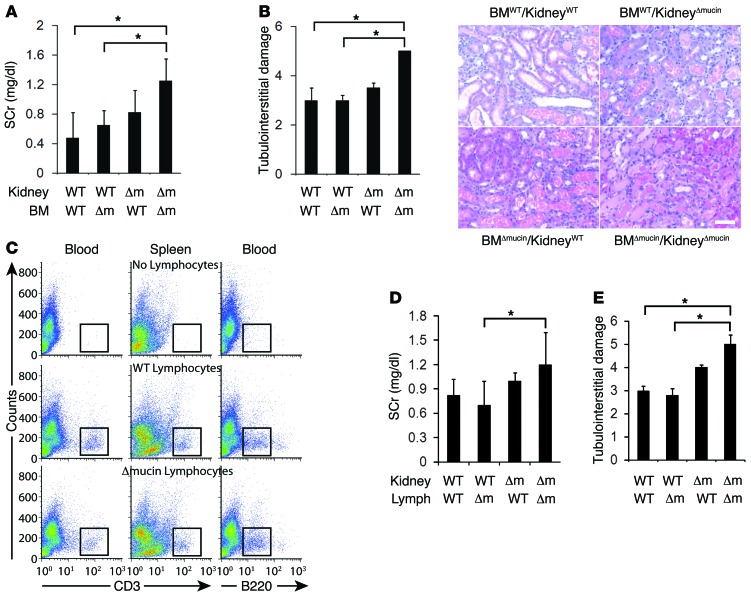
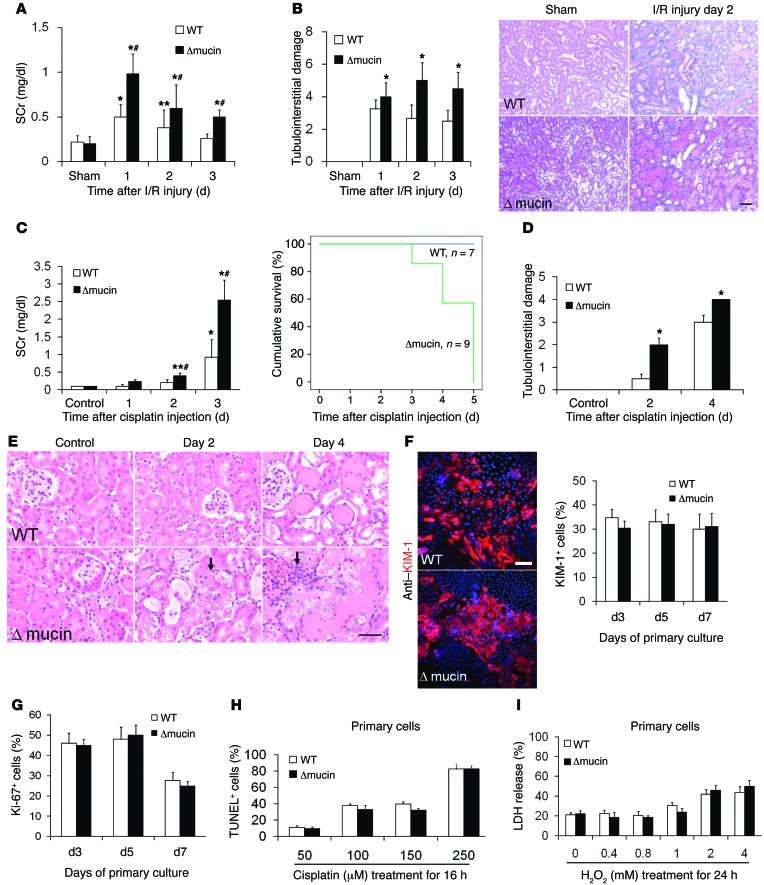
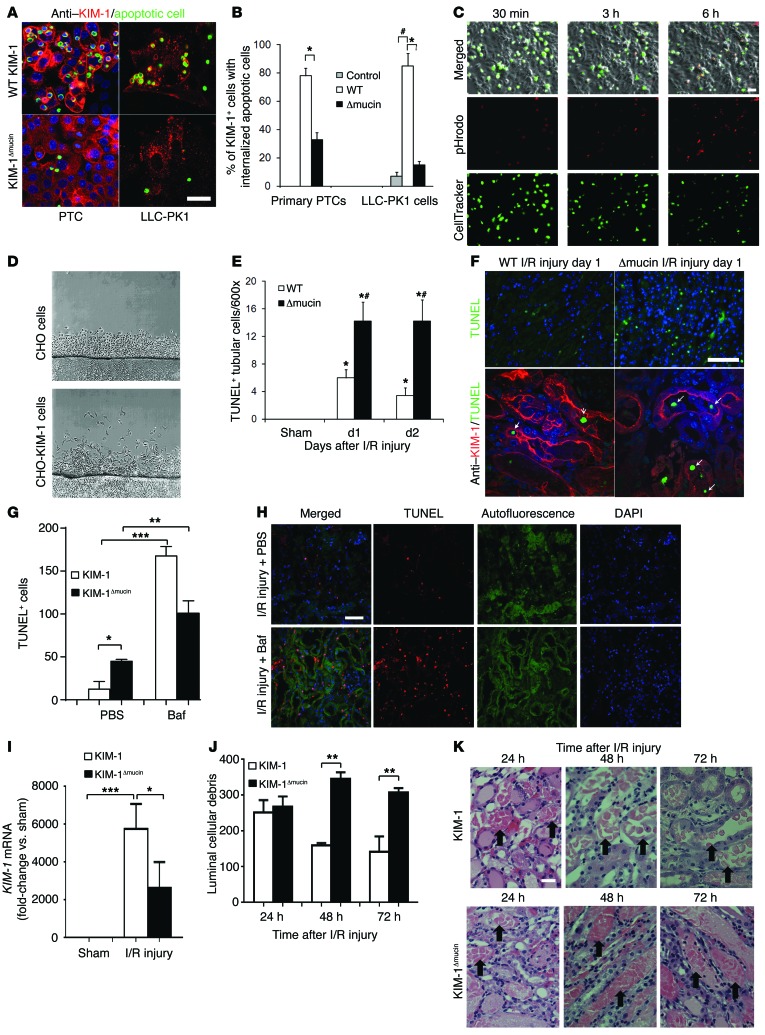
Kidney injury molecule 1 (KIM-1, also known as TIM-1) is markedly upregulated in the proximal tubule after injury and is maladaptive when chronically expressed. Here, we determined that early in the injury process, however, KIM-1 expression is antiinflammatory due to its mediation of phagocytic processes in tubule cells. Using various models of acute kidney injury (AKI) and mice expressing mutant forms of KIM-1, we demonstrated a mucin domain-dependent protective effect of epithelial KIM-1 expression that involves downregulation of innate immunity. Deletion of the mucin domain markedly impaired KIM-1-mediated phagocytic function, resulting in increased proinflammatory cytokine production, decreased antiinflammatory growth factor secretion by proximal epithelial cells, and a subsequent increase in tissue macrophages. Mice expressing KIM-1Δmucin had greater functional impairment, inflammatory responses, and mortality in response to ischemia- and cisplatin-induced AKI. Compared with primary renal proximal tubule cells isolated from KIM-1Δmucin mice, those from WT mice had reduced proinflammatory cytokine secretion and impaired macrophage activation. The antiinflammatory effect of KIM-1 expression was due to the interaction of KIM-1 with p85 and subsequent PI3K-dependent downmodulation of NF-κB. Hence, KIM-1-mediated epithelial cell phagocytosis of apoptotic cells protects the kidney after acute injury by downregulating innate immunity and inflammation.


Figures

Figure 10
Figure 10. Proposed model of KIM-1 regulation of NF-κB.
WT KIM-1 binding to apoptotic cells triggers KIM-1 phosphorylation and recruitment of p85, which then blocks the phosphorylation and activation of NF-κB. In cells expressing KIM-1Δmucin, KIM-1Δmucin does not bind apoptotic cells and has reduced phosphorylation. This leads to reduced recruitment of p85 and greater phosphorylation and activation of NF-κB. AB, apoptotic body; Phospho, phosphorylation.
Figure 9
Figure 9. Expression of WT KIM-1, but not KIM-1Δmucin, in PTCs downregulates NF-κB activity in a PI3K-dependent manner.
(A) Immunoblot analysis of p–NF-κB in I/R kidneys from WT KIM-1 or KIM-1Δmucin mice (n = 4 animals). (B) p–NF-κB expression in WT KIM-1 or KIM-1Δmucin primary PTCs (representative of 4 experiments). (C) NF-κB activity in LLC-PK1 cells expressing WT KIM-1 or KIM-1Δmucin plus NF-κB–responsive promotor driving luciferase (normalized to Renilla luciferase driven by a constitutive promotor) (n = 4). **P < 0.0001; *P < 0.01. (D and E) Representative immunoprecipitation analysis of KIM-1 phosphorylation and interaction with p85 from 4 experiments. (D) LLC-PK1 cell lysates from WT and KIM-1Δmucin–expressing cells were immunoprecipitated with an Ab against phosphorylated tyrosine residues and probed for KIM-1 by immunoblotting. (E) FLAG-tagged KIM-1 or KIM-1Δmucin was immunoprecipitated from lysates with anti-FLAG Abs and probed for p85 or KIM-1 by immunoblotting. (F) Representative images of LLC-PK1 cells expressing WT or KIM-1Δmucin incubated with apoptotic cells. Cells were stained for KIM-1 (green), p85 (red), and apoptotic cell proteins (blue). Scale bar: 10 μm. (G) Confocal z plane of WT KIM-1 cells stained as in E and imaged in a z series. N, LLC-PK1 cell nucleus. (H) 3D reconstruction of z series from G of KIM-1/p85 colocalization at a phagocytic event (upper right and individual channels in lower panels). Images in G and H are representative of 3 experiments. Scale bar: 5 μm (G and H). (I) Immunoblot analysis of p–NF-κB in KIM-1 or KIM-1Δmucin primary PTCs treated with vehicle or the PI3K inhibitors wortmannin or LY294002 (immunoblots are representative of 3 experiments). Groups were compared by ANOVA followed by Bonferroni’s post-hoc analysis.
Figure 8
Figure 8. IPA interaction network generated from microarrays comparing expression patterns between PC3 cells expressing KIM-1 and cells expressing β-galactosidase.
The network was generated from an analysis of the genes listed in Supplemental Tables 1 and 2. The genes labeled in gray and KIM-1 (HAVCR1) are from the microarray analysis. The genes labeled in white and red are predicted to be involved on the basis of IPA analysis.
Figure 7
Figure 7. Expression of WT KIM-1, but not KIM-1Δmucin, in kidney epithelial cells downregulates the activation of macrophages.
(A) TNF-α secretion by BMMs exposed to conditioned media (CM) collected from LLC-PK1 cells expressing pCDH, WT KIM-1, or KIM-1Δmucin incubated with apoptotic cells or not and then treated with TNF-α or LPS without apoptotic cells before incubation (n = 5). *P < 0.01; #P < 0.05. (B) Percentage of BrdU+ BMMs after a 24-hour treatment with conditioned media from LLC-PK1 cells expressing pCDH vector, WT KIM-1, or KIM-1Δmucin (n = 3). *P < 0.05. (C) Relationship between WT KIM-1 expression in LLC-PK1 cells and TNF-α secretion by BMMs treated with conditioned media from these cells. The control was set as the LLC-PK1 group that had the highest level of KIM-1 expression or the BMM group that had the highest TNF-α secretion levels. The conditioned media from LLC-PK1 cells expressing KIM-1 had a dose-dependent effect on the decrease in TNF-α secretion by BMMs (n = 3). r = 0.916; P = 0.04. Groups were compared by ANOVA followed by Bonferroni’s post-hoc analysis (A and B) and Spearman’s rank correlation test (C). CM, conditioned media.
Figure 6
Figure 6. Expression of functional KIM-1 downmodulates inflammatory cytokine production by kidney epithelial cells.
(A) Tlr4 mRNA levels in tubules isolated from KIM-1 (WT) and KIM-1Δmucin I/R-injured kidneys 1 and 3 days after injury (n = 3 mice/time point/group). *P < 0.05 vs. sham; #P < 0.05 vs. WT. (B) Tlr4 and Myd88 mRNA levels in primary cultured tubular cells isolated from KIM-1 and KIM-1Δmucin kidneys. *P < 0.01. (C) Coimmunostaining for KIM-1 (red) and TLR4 (green) in primary cultured tubular cells isolated from KIM-1 or KIM-1Δmucin mouse kidneys after exposure to LPS. WT KIM-1–expressing cells did not show obvious TLR4 expression, whereas KIM-1Δmucin–expressing cells showed increased intracellular TLR4 expression (images are representative of 3 independent experiments). Scale bar: 20 μm. (D) Secretion of IL-6 and RANTES by primary cultured tubular cells isolated from KIM-1 WT and KIM-1Δmucin kidneys. **P < 0.001; #P < 0.05 (n = 3). (E) Tlr4 mRNA levels in LLC-PK1 cells transfected with pCDH empty vector, WT KIM-1, or KIM-1Δmucin (n = 5). With LPS treatment, the pCDH cells had increased Tlr4 gene production, which did not change with apoptotic cell (APO) pre-feeding. Pre-feeding apoptotic cells to LLC-PK1 cells expressing WT KIM-1, but not KIM-1Δmucin, markedly decreased Tlr4 mRNA levels. *P < 0.01 and #P < 0.05. Statistical comparisons among groups were calculated by ANOVA followed by Bonferroni’s post-hoc analysis.
Figure 5
Figure 5. KIM-1Δmucin I/R-injured kidneys have greater inflammatory cytokine production.
(A) Il1b, Il6, and Ccl2 (IL-1β, IL-6, and MCP1) mRNA from whole I/R-injured kidneys, 1, 2, and 3 days after I/R and (B) Tnfa, Il6, and Ccl2 (TNF-α, IL6, and MCP1) mRNA levels in cisplatin-injured kidneys in KIM-1 WT and KIM-1Δmucin mice (n = 3 mice/time point/group). *P < 0.05 vs. sham or control; #P < 0.05 vs. WT. (C) mRNA levels of Tlr2 and Tlr4 in I/R- and cisplatin-injured kidneys in KIM-1 WT and KIM-1Δmucin mice (n = 3 mice/time point/group). *P < 0.01 and **P < 0.05 vs. sham; #P < 0.01 vs. WT. (D) Anti-TLR4 immunostaining of I/R-injured kidneys from KIM-1 WT and KIM-1Δmucin mice (images are representative of 3 independent experiments). Scale bar: 50 μm. (E) Csf1 mRNA levels in I/R-injured or sham kidneys from KIM-1 WT and KIM-1Δmucin mice. *P < 0.05; **P < 0.01 (n = 3). Statistical comparisons among groups were calculated by ANOVA followed by Bonferroni’s post-hoc analysis. Con, vehicle control.
Figure 4
Figure 4. KIM-1Δmucin I/R-injured kidneys have more innate immune inflammatory infiltrates.
Number of infiltrated granulocytes, macrophages, and T lymphocytes in I/R-injured kidneys on days 1 and 3 (A) and cisplatin-injured kidneys on day 2 (B) by immunostaining with anti-Ly6G, F4/80, and CD3 Abs (n = 3 mice/time point/group). *P < 0.001 and **P < 0.05 vs. sham; #P < 0.01 vs. WT. (C) Anti-Ly6G immunostaining and coimmuno­staining for F4/80 (red) and laminin (green) in I/R-injured kidneys from KIM-1 WT and KIM-1Δmucin mice. (D) Coimmunostaining for F4/80 (red) and laminin (green) in KIM-1Δmucin I/R kidneys showed tubulitis with vesicle-rich macrophages infiltrating into the tubular wall (arrows in left panel) and broken tubular basement membrane with macrophages present in the casts (arrows in right panel). Images in C and D are representative of 3 animals per condition. Scale bars: 50 μm. Statistical comparisons were calculated by ANOVA followed by Bonferroni’s post-hoc analysis. Sh, sham.
Figure 3
Figure 3. Kidney parenchymal cell KIM-1Δmucin expression predisposes to more severe I/R kidney injury.
(A) SCr levels and (B) H&E-stained histological images and quantification of tubulointerstitial damage 1 day after I/R in different BM-transplanted chimeric mice groups (n = 6 animals/group). *P < 0.05. Scale bar: 50 μm. (C) Flow cytometric assay showing the presence of T and B lymphocytes in blood and spleens from Rag1–/– KIM-1Δmucin mice transfused with lymphocytes from WT KIM-1 or KIM-1Δmucin mice (plots are representative of 3 mice). (D) SCr levels and (E) quantification of tubulointerstitial damage 1 day after I/R in different lymphocyte-transfused Rag1–/– chimeric mouse groups (n = 5 animals/group). *P < 0.05. Statistical comparisons were calculated by ANOVA followed by Bonferroni’s post-hoc analysis. Δm, KIM-1Δmucin; WT, WT KIM-1.
Figure 2
Figure 2. The KIM-1Δmucin mouse kidney is more susceptible to acute injury.
(A) Changes in SCr over time after I/R injury in WT KIM-1 and KIM-1Δmucin mice (n = 12/time point/group). *P < 0.001 and **P < 0.05 vs. sham; #P < 0.05 vs. KIM-1 WT. (B) Quantification of tubulointerstitial damage (n = 3/time point/group) and H&E-stained histological images of I/R kidneys. *P < 0.05. (C) Changes in SCr (n = 6/group) and mortality over time after cisplatin injection into KIM-1 and KIM-1Δmucin mice. *P < 0.001 and **P < 0.05 vs. control; #P < 0.05 vs. KIM-1 WT. (D and E) Cisplatin-induced acute toxic kidney injury. Quantification of tubulointerstitial damage is shown in D and H&E-stained histological images in E (n = 3/group). *P < 0.05. (F) KIM-1 immunostaining using Abs targeting the extracellular domain of KIM-1 and percentage of KIM-1+ cells in primary PTCs from KIM-1 and KIM-1Δmucin mice. Scale bar: 50 μm. (G) Percentage of Ki67+ primary PTCs from KIM-1 and KIM-1Δmucin mice over time in primary culture. (H) TUNEL in situ hybridization of PTCs after a 16-hour incubation with various doses of cisplatin. (I) LDH released from PTCs after exposure to H2O2 at various doses (n = 3). Statistical comparisons were calculated by ANOVA followed by Bonferroni’s post-hoc analysis. (FI) No statistical differences between WT KIM-1 and KIM-1Δmucin groups.
Figure 1
Figure 1. Decreased phagocytic function of KIM-1Δmucin in PTCs.
(A) Anti–KIM-1 immunostaining (red) in primary PTCs from both WT KIM-1 and KIM-1Δmucin mice (left panel) and LLC-PK1 cells transfected with empty vector (control), KIM-1 or KIM-1Δmucin (right panel) exposed to apoptotic lymphocytes (green). Scale bar: 20 μm. (B) The percentage of PTCs that internalized apoptotic lymphocytes was reduced in the KIM-1Δmucin PTCs (n = 3). *P < 0.01; #P < 0.001. (C) Representative time course from 5 experiments of the uptake and acidification (red) of apoptotic cells (green) by KIM-1–expressing LLC-PK1 cells. Scale bar: 30 μm. (D) Representative images of cell outgrowth from coverslips in CHO cells expressing empty vector or KIM-1 (images are representative of 3 experiments). (E) TUNEL+ tubular cells in I/R kidneys from WT KIM-1 and KIM-1Δmucin mice (n = 5 mice/time point/group).*P < 0.01 vs. sham; #P < 0.01 vs. WT KIM-1. (F) Colocalization of KIM-1 and TUNEL+ cells (arrows in the left panel show KIM-1–binding apoptotic bodies). Scale bar: 50 μm. (G) Quantification of TUNEL+ cells in WT KIM-1 and KIM-1Δmucin mice 24 hours after I/R injury plus vehicle or I/R injury plus Baf (n = 3). *P < 0.05; **P < 0.01; ***P < 0.001. (H) Representative images of apoptotic TUNEL+ cells in WT KIM-1 mice treated with Baf. Scale bar: 100 μm. (I) Quantification of KIM-1 mRNA expression in post–I/R injury KIM-1 and KIM-1Δmucin kidneys (n = 3). *P < 0.05; ***P < 0.001. (J) Quantification of luminal cellular debris in post–I/R injury WT KIM-1 and KIM-1Δmucin mice (n = 3). **P < 0.01. (K) Representative images of luminal debris (arrows) in KIM-1 and KIM-1Δmucin mice after I/R injury. Scale bar: 25 μm. Statistical comparisons were calculated by 2-tailed Student’s t test for the left 2 bars in B and by ANOVA followed by Bonferroni’s post-hoc analysis for all other panels. Δmucin, KIM-1Δmucin; WT, WT KIM-1.

Comment in

References

    1. Lameire N, Van Biesen W, Vanholder R. The changing epidemiology of acute renal failure. Nat Clin Pract Nephrol. 2006;2(7):364–377. doi: 10.1038/ncpneph0218. - DOI - PubMed
    1. Uchino S, et al. Acute renal failure in critically ill patients: a multinational, multicenter study. JAMA. 2005;294(7):813–818. doi: 10.1001/jama.294.7.813. - DOI - PubMed
    1. Hsu CY, Chertow GM, McCulloch CE, Fan D, Ordonez JD, Go AS. Nonrecovery of kidney function and death after acute on chronic renal failure. Clin J Am Soc Nephrol. 2009;4(5):891–898. doi: 10.2215/CJN.05571008. - DOI - PMC - PubMed
    1. Ishani A, et al. Acute kidney injury increases risk of ESRD among elderly. J Am Soc Nephrol. 2009;20(1):223–228. doi: 10.1681/ASN.2007080837. - DOI - PMC - PubMed
    1. Coca SG, Yusuf B, Shlipak MG, Garg AX, Parikh CR. Long-term risk of mortality and other adverse outcomes after acute kidney injury: a systematic review and meta-analysis. Am J Kidney Dis. 2009;53(6):961–973. doi: 10.1053/j.ajkd.2008.11.034. - DOI - PMC - PubMed

Publication types

MeSH terms