. 2015 Apr;10(4):361-9.
doi: 10.1038/nnano.2015.19. Epub 2015 Mar 9.

An endogenous nanomineral chaperones luminal antigen and peptidoglycan to intestinal immune cells

Affiliations

An endogenous nanomineral chaperones luminal antigen and peptidoglycan to intestinal immune cells

Jonathan J Powell et al. Nat Nanotechnol. 2015 Apr.

Abstract

In humans and other mammals it is known that calcium and phosphate ions are secreted from the distal small intestine into the lumen. However, why this secretion occurs is unclear. Here, we show that the process leads to the formation of amorphous magnesium-substituted calcium phosphate nanoparticles that trap soluble macromolecules, such as bacterial peptidoglycan and orally fed protein antigens, in the lumen and transport them to immune cells of the intestinal tissue. The macromolecule-containing nanoparticles utilize epithelial M cells to enter Peyer's patches, small areas of the intestine concentrated with particle-scavenging immune cells. In wild-type mice, intestinal immune cells containing these naturally formed nanoparticles expressed the immune tolerance-associated molecule 'programmed death-ligand 1', whereas in NOD1/2 double knockout mice, which cannot recognize peptidoglycan, programmed death-ligand 1 was undetected. Our results explain a role for constitutively formed calcium phosphate nanoparticles in the gut lumen and show how this helps to shape intestinal immune homeostasis.


Figures

Figure 1
Figure 1. Characterisation of endogenous mineral of the intestinal lumen
Distal small bowel contents from humans (a-c) and mice (d-f) visualised by electron microscopy (EM) and analysed for elemental composition (c and e) and crystallographic phase (f inset). a, b – SEM at low (a; scale bar, 1 μm) and high (b; scale bar, 500 nm) magnification with standardless X-ray microanalysis (c) of 11 separate particle regions (mean + SD). d, f – TEM at low (d; scale bar, 2 μm) and high (f; scale bar, 100 nm) magnification. Inset f – Selected area electron diffraction demonstrated the absence of any significant crystallinity. e – A typical energy dispersive X-ray microanalysis spectrum showing the elemental composition of an endogenous mineral particle (note the Cu signal is generated by the TEM specimen support grid and the C by the embedding resin).
Figure 2
Figure 2. Phenotypic and nanomineral characterisation of sub-epithelial dome (SED) cells in murine and human Peyer’s patches (PP)
a – Human PP SED stained for nuclei by propidium iodide (grey) and for mineralised calcium by calcein (green) and visualised by confocal microscopy. The gap between the epithelial cells (delineated apically by the broken white line) and cells of the SED is a consequence of frozen sectioning. Scale bar, 50 μm. b – The punctate nature of the stained mineral, shown from higher resolution 3D reconstructed confocal images, is consistent with localisation to distinct intracellular vesicles. Scale bar, 20 μm. c –Typical energy dispersive X-ray microanalysis of the mineral. d-m- Confocal micrographs of mouse SED stained with To-Pro-3 for nuclei (grey, images d and i), plus either anti-CD11b (red; image e) or anti-CD11c (red, images j), and calcein for endogenous mineral (green, images f and k). Overlay images in g and l confirms an APC phenotype (i.e. CD11b+ and Cd11c+) of the calcein+ cells. Scale bars, 50 μm. n-r – Phenotype of the calcein+ cells (green) of the SED in humans: n-q shows representative staining for CD68 (red), CD11b (red), CD11c (red) and HLA-DR (red), respectively. Scale bars; 50 μm. r – % calcein+ cells that express these markers (n = 6) again confirming an APC phenotype for these cells.
Figure 3
Figure 3. EM characterisation of murine endogenous nanomineral and 3D nanotomography
a – Examples by bright field TEM and b – HAADF STEM imaging of clusters of endogenous nanomineral within cells of the Peyer’s patch (PP) sub-epithelial dome (SED). Scale bar, 100 nm. c –Calcium, magnesium and phosphorus composition of endogenous nanomineral in PP SED (n = 20 separate regions, black) or the murine intestinal lumen (n = 22 separate regions, white), by standardless X-ray microanalysis, Mean + SD. d – A large cluster was imaged by HAADF STEM and e – a tilt series was reconstructed for 3D visualisation; XY orthoslice from the 3D reconstruction where particles and internal porosity are observed. Scale bars, 100 nm and 200 nm, respectively. f – Quantitative P:Ca ratios of the nanomineral of the SED by nuclear microscopy for mice on low (grey squares) and very low (black squares) Ca and P diets versus those on normal (open squares) or high (red squares) Ca and P diets. Horizontal bars represent the mean for each group. **** p< 0.0001 versus grey/black, Mann-Whitney test.
Figure 4
Figure 4. AMCP nanomineral uptake from the gut lumen into Peyer’s patches is substantially impeded in the absence of M cells in the follicle associated epithelium
a – Upper panels. Whole-mount immunohistochemistry showing that GP2-expressing M cells (green, arrows in lower panels) are absent in the follicle associated epithelium (FAE) of villin-cre+ RANKLFL/FL mice (right-hand panels) when compared to villin-cre RANKLFL/FL control mice (left-hand panels). Tissues are counterstained to detect F-actin (blue). Scale bars, 200 μm. Lower panels show immunohistochemistry analysis of frozen sections of Peyer’s patches from the same mice. Sections are counterstained with DAPI to detect cell nuclei (blue). Scale bars, 100 μm. Dashed lines indicate the boundary of the FAE. SED, sub-epithelial dome; V, villi. b – Calcein staining (green) for mineralised calcium (white arrows) in villin-cre+ RANKLFL/FL mice (right-hand panel) compared to staining in villin-cre-RANKLFL/FL control mice (left hand panel); sections are counterstained with ToPro3 to detect cell nuclei (grey) and c – quantification of staining in the two groups, ** p = 0.0025, Mann-Whitney test.
Figure 5
Figure 5. Endogenous nanomineral is co-localised with luminal peptidoglycan and dietary antigen in Peyer’s patch (PP) APC
a-k –Mice were fed a normal (a-f) or low (g-k) Ca/P diet plus fluorescently-labelled ovalbumin. (a-e and g-k) PP sections were stained with To-Pro-3 for nuclei (grey, images a and g), and with calcein for the endogenous nanomineral (green, images c and i). The fluorescent-labelled ovalbumin (red) is shown in b and h and the overlay of all three stains shows inseparable signals for ovalbumin and the nanomineral in d, e and j, k. Scale bar, 50 μm (a-e) and 100 μm (g-k). f – 3D stack, with Huygens Maximum Likelihood Estimation deconvolution, visualised with calcein staining for the endogenous nanomineral (green) and with antibody staining for ovalbumin (red). To-Pro-3 is the nuclear counterstain (grey). Both inseparable co-localisation (orange/yellow) as well as close separation of the protein and mineralised calcium signals are observed, consistent with the partial release of ovalbumin from the nanomineral as it dissolves in the cell lysosome. Scale bar, 20 μm. l-o – Human PP sections were stained with To-Pro-3 for nuclei (grey, l), with 2E9 antibody for peptidoglycan (red, m) and calcein for endogenous nanomineral (green, n). The overlay image in o shows the co-localisation of endogenous nanomineral and peptidoglycan implying that the nanomineral transports bacterial peptidoglycan as well as the protein antigen shown above. Scale bars, 25 μm.
Figure 6
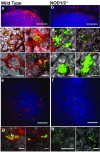
Figure 6. Peptidoglycan signalling is required for PD-L1 expression on nanomineral-positive APCs of the Peyer’s patch sub-epithelial dome and mesenteric lymph nodes
Confocal micrographs showing PD-L1 expression (red) of wild type mice and NOD1/2−/− mice in (a, b) the Peyer’s patch, (c, d) representative nanomineral+ cells (green) of the Peyer’s patch, (e, f) mesenteric lymph nodes (nanomineral in green) and (g, h) representative nanomineral+ cells of the mesenteric lymph nodes. Nuclei are shown in blue in low power images (a, b, e and f) and in grey in high power images (c, d g and h). Direct overlap of the green and red appears orange/yellow. Scale bars are 100 μm (a, b), 5 μm (c, d, g and h) and 50 μm (e, f).

Comment in

Similar articles

Cited by

References

    1. Powell JJ, Thoree V, Pele LC. Dietary microparticles and their impact on tolerance and immune responsiveness of the gastrointestinal tract. Br. J. Nutr. 2007;98(Suppl 1):S59–63. - PMC - PubMed
    1. Gomez-Morilla I, Thoree V, Powell JJ, Kirkby KJ, Grime GW. Identification and quantitative analysis of calcium phosphate microparticles in intestinal tissue by nuclear microscopy. Nucl. Instrum. Methods. Phys. Res. B. 2006;249:665–669.
    1. Powell JJ, Faria N, Thomas-McKay E, Pele LC. Origin and fate of dietary nanoparticles and microparticles in the gastrointestinal tract. J. Autoimmun. 2010;34:J226–233. - PubMed
    1. Geigy Scientific Tables. 8th edn Vol. 1. CIBA-GEIGY Limited; Basle, Switzerland: 1981.
    1. Schedl HP, Osbaldiston GW, Mills IH. Absorption, secretion, and precipitation of calcium in the small intestine of the dog. Am J Physiol. 1968;214:814–819. - PubMed

Publication types

MeSH terms