. 2015 Apr;29(4):542-57.
doi: 10.1210/me.2014-1273. Epub 2015 Mar 9.

Anti-incretin, Anti-proliferative Action of Dopamine on β-Cells

Affiliations

Anti-incretin, Anti-proliferative Action of Dopamine on β-Cells

Antonella Maffei et al. Mol Endocrinol. 2015 Apr.

Abstract

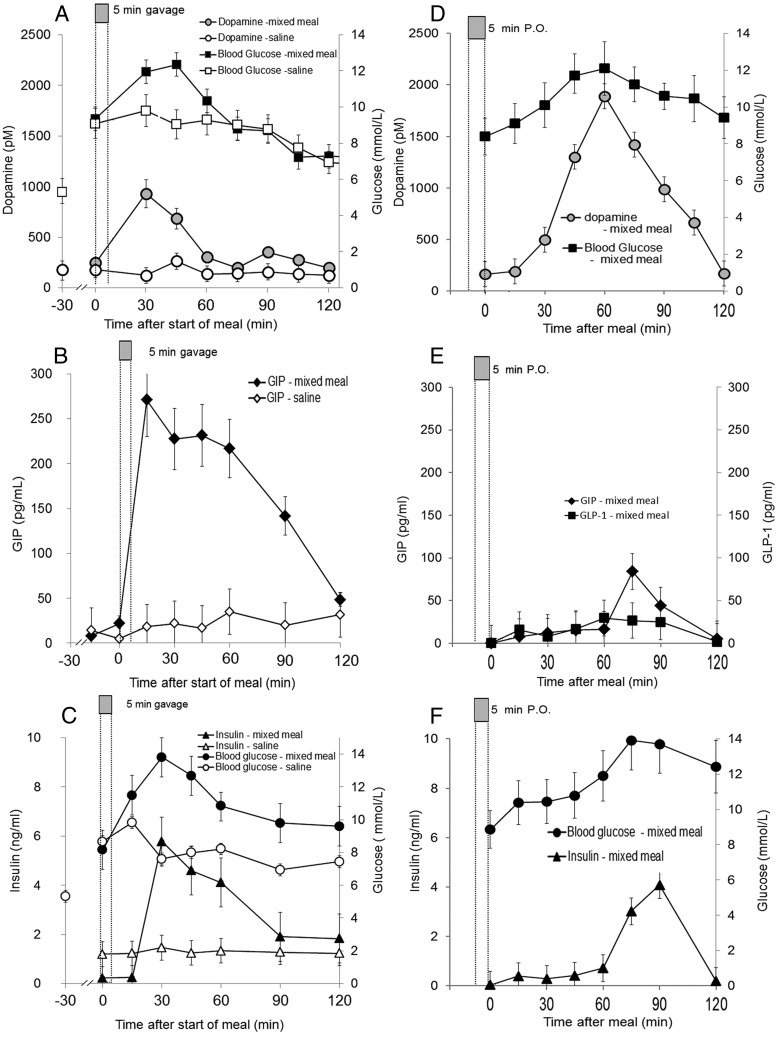
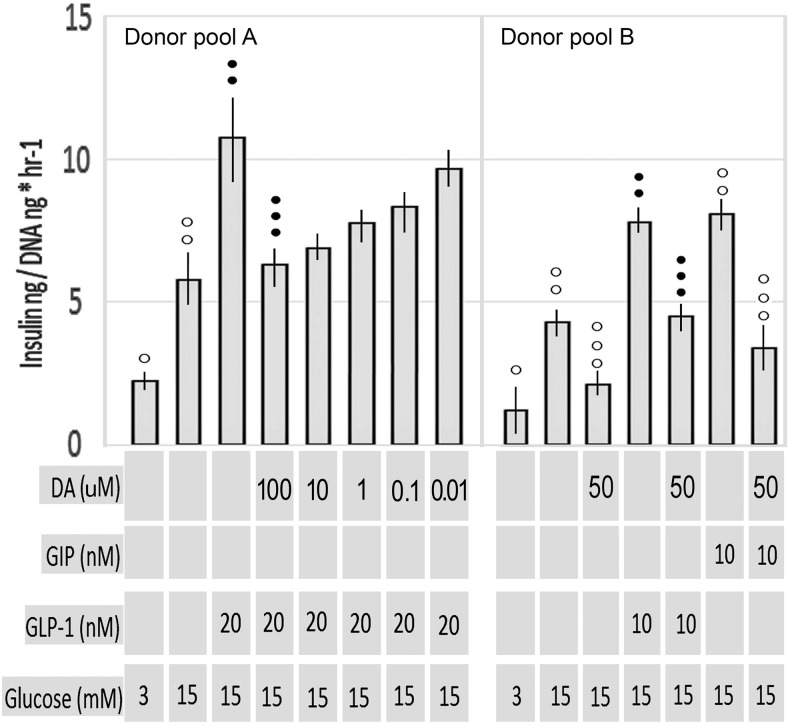
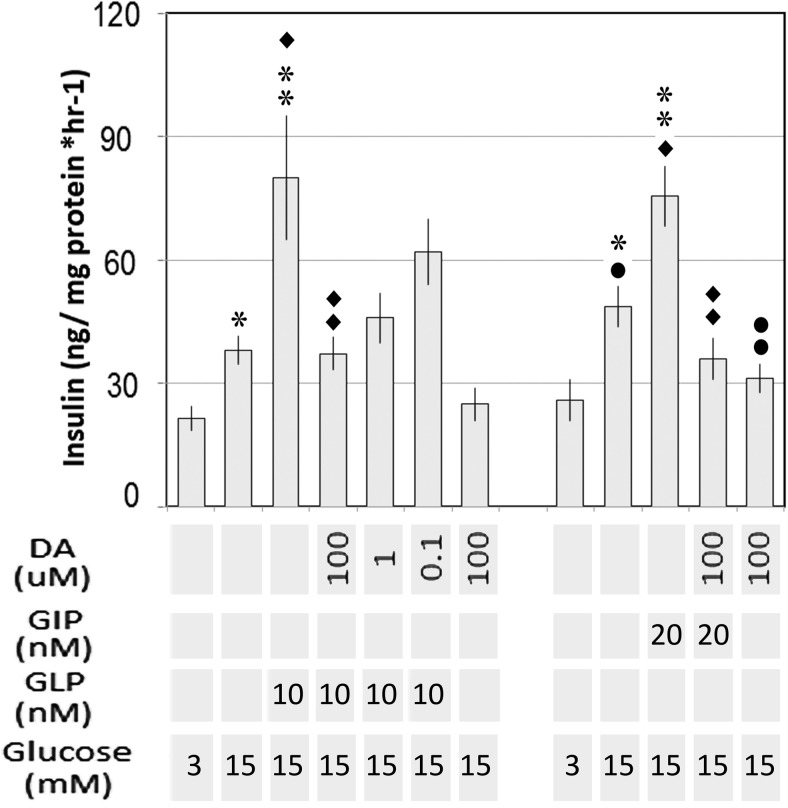
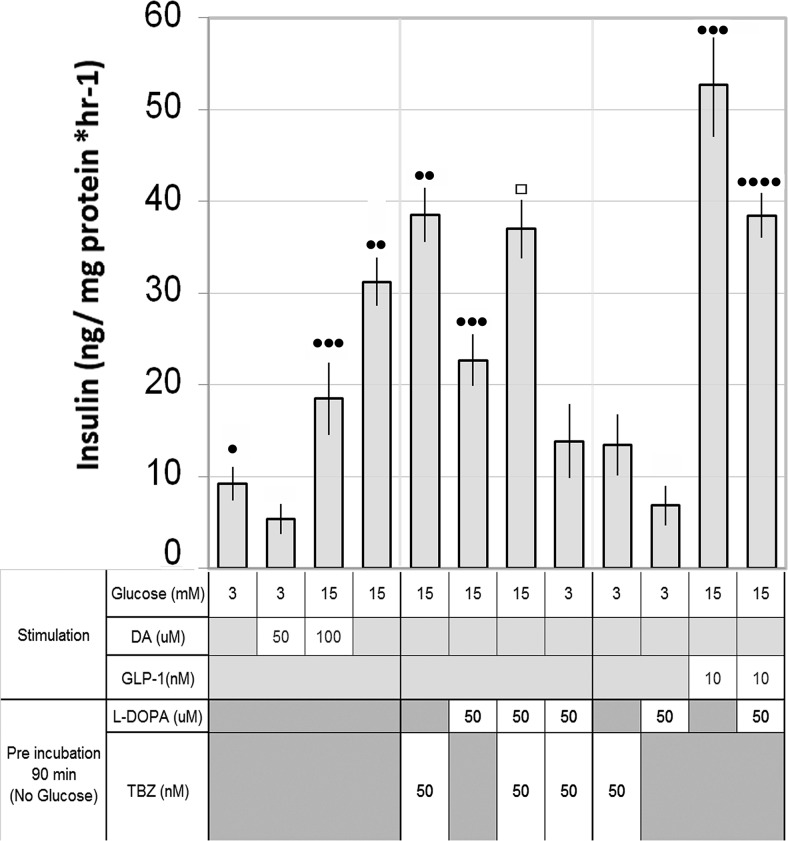
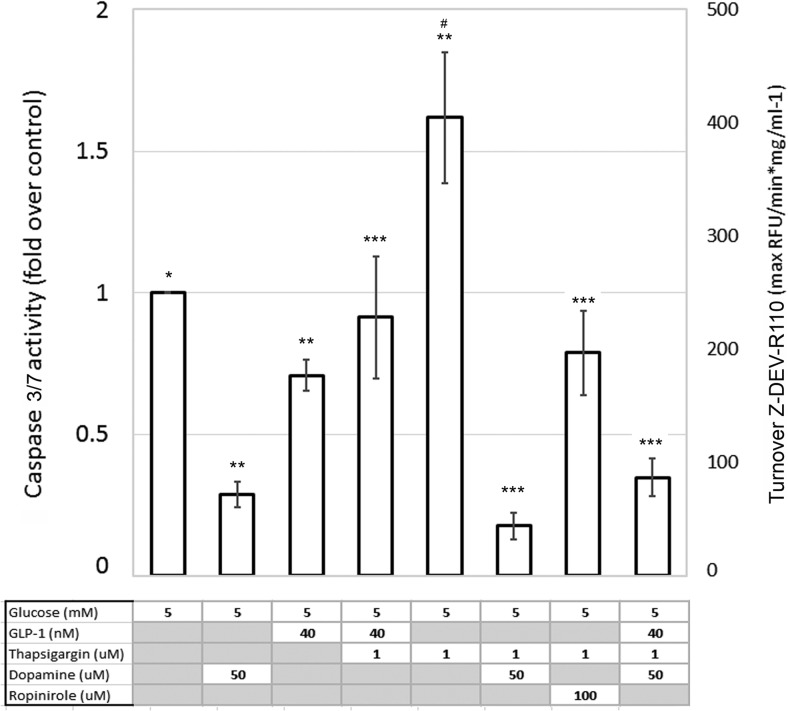
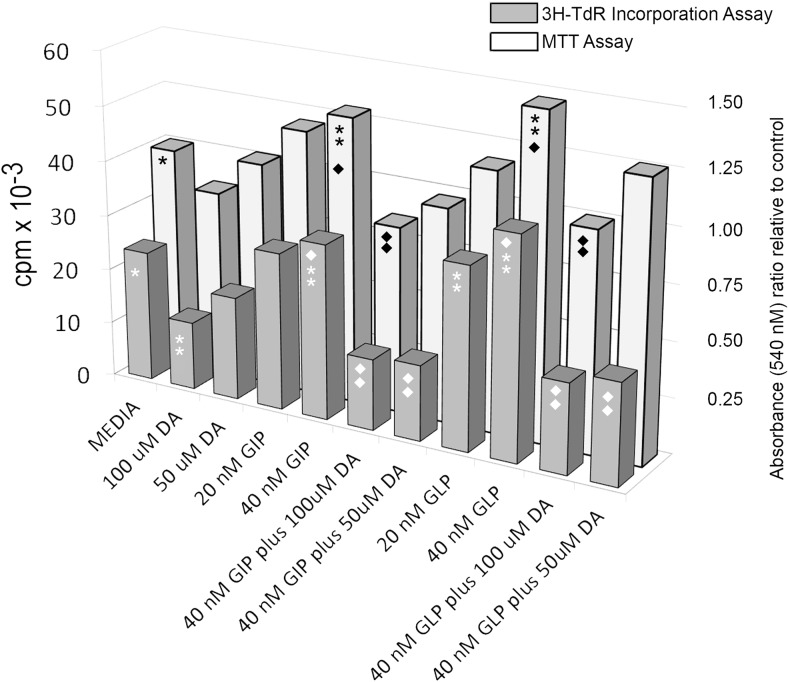
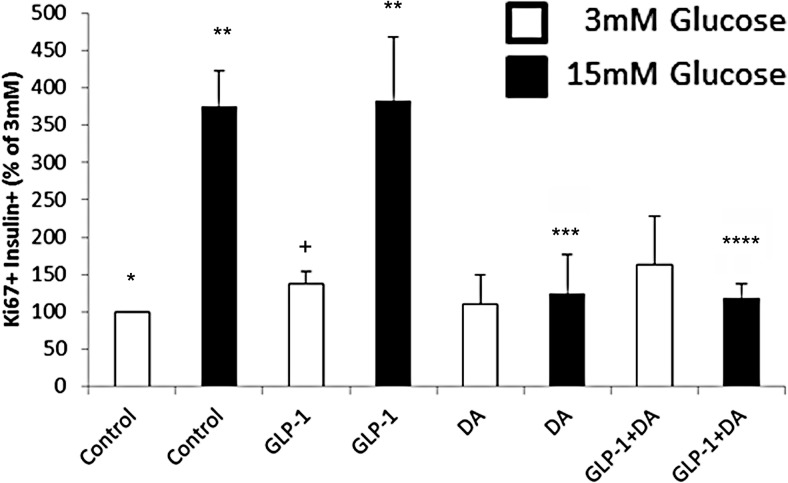
Human islet β-cells exploit an autocrine dopamine (DA)-mediated inhibitory circuit to regulate insulin secretion. β-Cells also express the DA active transporter and the large neutral amino acid transporter heterodimer enabling them to import circulating DA or its biosynthetic precursor, L-3,4-dihydroxyphenylalanine (L-DOPA). The capacity to import DA or L-DOPA from the extracellular space possibly indicates that DA may be an endocrine signal as well. In humans, a mixed meal stimulus is accompanied by contemporary serum excursions of incretins, DA and L-DOPA, suggesting that DA may act as an anti-incretin as postulated by the foregut hypothesis proposed to explain the early effects of bariatric surgery on type 2 diabetes. In this report, we take a translational step backwards and characterize the kinetics of plasma DA and incretin production after a mixed meal challenge in a rat model and study the integration of incretin and DA signaling at the biochemical level in a rodent β-cell line and islets. We found that there are similar excursions of incretins and DA in rats, as those reported in humans, after a mixed meal challenge and that DA counters incretin enhanced glucose-stimulated insulin secretion and intracellular signaling at multiple points from dampening calcium fluxes to inhibiting proliferation as well as apoptosis. Our data suggest that DA is an important regulator of insulin secretion and may represent 1 axis of a gut level circuit of glucose and β-cell mass homeostasis.


Figures

Figure 1.
Figure 1.
Mixed meal challenge evokes concurrent excursion of plasma DA and incretin. A, Anesthetized Sprague Dawley rats were gavaged with Ensure mixed meal (filled symbols) or saline (open symbols), and serial samples of blood were drawn for measurements of DA (circles), glucose (squares), (B) measurements of GIP (diamonds) in serial samples, or (C) measurements of insulin (circles) or glucose (triangles). Measurements in A and D were performed in different experiments than those shown in B and C or E and F (performed in the same sample set), because DA measurements required a large sample volume. D, The mixed meal was offered to rodents P.O. Once the meal was consumed, the rodents were anesthetized, and serial measurements of DA (filled circles) or glucose (filled squares) were made in the collected plasma. E and F, The mixed meal was offered to rodents P.O. Once the meal was consumed, the rodents were anesthetized, and serial measurements of GLP-1 (filled squares), GIP (filled diamonds), glucose (filled circles), or insulin (filled triangles) were made in the collected plasma. Error bars represent SEM from measurements made in 4 or more rats. Mean peak excursion values for the mixed meal challenges were significantly different (P < .05) from their corresponding time values for the saline challenge by Student's t testing.
Figure 2.
Figure 2.
Measurement of incretin enhanced GSIS in human islets in the presence of DA. Static incubation experiments were performed in pools of islets from 3 donors (mixed 1:1:1) in. Each pool was tested against 3.0mM glucose, 15mM glucose, and 15mM glucose with indicated concentration of incretin and/or DA in replicate wells (n = 6). After a 1-hour incubation, the insulin concentration in the buffer beyond the transwell membrane for each well was determined and normalized to the DNA content within the transwell. The mean normalized insulin concentration for replicate wells is indicated. Error bars indicate the SEM. ○○ or •• indicates significantly different from ○ or • (P < .05); ○○○ or ••• indicates significantly different from ○○ or • • (P < .05).
Figure 3.
Figure 3.
Rodent β-cell line INS-1E incretin enhanced GSIS is sensitive to exogenous DA. INS-1E cells were cultured in 24-well plates, rested in low glucose media, and then challenged with the indicated concentration of glucose, incretin, and DA. After incubation, the culture supernatants were collected and the insulin concentration determined by a homogenous time-resolved fluorescent immunoassay. Cell monolayers remaining in the well were lysed, and the protein concentration was determined. The insulin concentration was then normalized to the wells protein concentration, and the protein normalized insulin concentration from replicate wells (n = 6) was averaged. Results shown are means from a representative experiment in a series of 3. Error bars indicate the SEM. ** or ♦♦ indicates significantly different from * or ♦ (P < .01); •• indicates significantly different from • (P < .05).
Figure 4.
Figure 4.
Rat β-cell line INS-1E GSIS is sensitive to exogenous L-DOPA in a VMAT2-dependent manner. INS-1E cells were cultured in 24-well plates, rested in low glucose media overnight, and then preincubated indicated concentration of L-DOPA and TBZ, a known VMAT2 inhibitor, for 90 minutes, washed, and then challenged with the indicated concentrations of glucose, GLP-1, and DA for 1 hour. After incubation, the culture supernatants were collected and the insulin concentration was determined by a homogenous time-resolved fluorescent immunoassay. Cell monolayers remaining in the well were lysed, and the protein concentration was determined. The insulin concentration was then normalized to the wells protein concentration, and the protein normalized insulin concentration from replicate wells (n = 8) was averaged. Error bars indicate the SEM. •••• indicates significantly different from ••• (P < .05); ••• indicates significantly different from •• (P < .05); •• indicates significantly different from • (P < .05); □ indicates not significantly different from •• (P = .4).
Figure 5.
Figure 5.
Hierarchical clustering of INS-1E phosphorylated proteins in response to incretin enhanced GSIS in the presence of DA. Hierarchical clustering of the levels of expression of 13 phosphoprotein determined by a microarray sandwich immunoassay in lysates of INS-1E cells treated with 3mM glucose (G3), 15mM glucose (G15), 15mM glucose with 10nM GLP-1 (G15_GLP), 15mM glucose with 10nM GIP(G15_GIP), 15mM glucose with 10nM GLP-1 plus 100μM DA (G15_GLP_DA), or 15mM glucose with 10nM GIP plus 100μM DA (G15_GIP_DA) for 1 hour. Expression data for each condition represents the average value gathered from at least 5 replicate microarrays, each replicate derived from a separate lysate and INS-1E culture experiment. Red and green colors indicate high and low phosphoprotein expression relative to a median value. The dendrogram illustrates the similarity of each pattern of phosphoprotein evoked by the different culture conditions using Pearson's correlation coefficient as the metric (eg, the phosphoprotein expression pattern in cultures of INS-1E cells with 15mM glucose and 10nM GLP-1 was more similar to cultures of INS-1E cells with 15mM glucose and 10nM GIP than to cultures of INS-1E cells in 3mM glucose). The abbreviations used for the phosphoproteins on the vertical axis are p706K_t389, ribosomal protein S6 kinase-β-1 (threonine 389); AMPKa_t172, AMP-activated PK (threonine 172); AKT_s473, PKB (serine 473); PRAS40_t246: proline-rich AKT1 substrate 1 (threonine 246); Erk_t202/y204, ERK 1and 2 (threonine 202 and tyrosine 204); BAD_s112, Bcl-2-associated death promoter (serine 112); p706K_t421/s424, ribosomal protein S6 kinase-β-1 (threonine 412) and (serine 424); PDK1_s241, phosphoinositide-dependent PK1 (serine 241); RSK1_t421, ribosomal S6 kinases-1 (p90) (threonine421); GSK3b_s9, glycogen synthase kinase-3-β (serine 9); mTOR_s248, mammalian target of rapamycin (serine 248); GSK3a_s21, glycogen synthase kinase-3-α (serine 21); S6RP_s235, ribosomal protein S6 (serine 235).
Figure 6.
Figure 6.
DA enhances β-arrestin-1 phosphorylation in cultures of INS-1E cells. β-Arrestin-1 phosphorylation at serine 412 was analyzed in whole-cell lysates from cultures of INS-1E cells treated with the indicated concentrations of glucose, incretin, and/or DA. Representative immunoblots are shown. β-Arrestin-1 phosphorylation at serine 412 was quantified by digital densitometry and normalized to total β-arrestin. Results represent densitometry results from 3 separate experiments. Error bars are the SEM. **, significantly different from * (P = .03); ##, approaching significance from # (P = .08).
Figure 7.
Figure 7.
DA suppresses atypical PKC-ζ threonine 410 phosphorylation. PKC-ζ phosphorylation at threonine 410 was analyzed in whole-cell lysates from cultures of INS-1E cells treated with the indicated combinations of glucose, incretin, and/or DA for 1 hour. In some experiments (filled columns), INS-1E cells were treated with 15mM and GLP-1 for 45 minutes, followed by the addition of DA for the indicated time. Representative immunoblots are shown with approximate position of the molecular weight markers in the right hand margin. PKC-ζ phosphorylation at threonine 410 was quantified by digital densitometry and normalized to total PKC-ζ. Results represent densitometry results from 4 separate experiments. Error bars are the SEM. ** or ♦♦, significantly different from * or ♦ (P < .05).
Figure 8.
Figure 8.
DA suppresses GIP enhanced BAD phosphorylation at serine 122. Phosphorylated BAD was evaluated in whole-cell lysates from cultures of INS-1E cells treated with the indicated combinations of glucose, GIP, and/or DA for 1 hour. In some experiments, INS-1E cells were treated with 15mM and GIP-1 for 45 minutes as indicated. Representative immunoblots are shown with approximate position of the molecular weight markers in the right hand margin. Phospho-BAD and BAD were quantified by digital densitometry and the amount of phospho-BAD was normalized to total BAD. Results represent densitometry results from 3 separate experiments. Error bars are the SEM. *, significantly different from **; and **, significantly different from *** (P ≤ .05).
Figure 9.
Figure 9.
Caspase 3 and 7 activity in DA-treated INS-1E cells cultured in low glucose-low serum conditions. Cultures of INS-1E cells were treated with the indicated concentrations of glucose, GLP-1, DA, Ropinirole, and thapsigargin for 24 hours. Both adherent and nonadherent cells were harvested, washed, and lysed in hypotonic buffer with protease inhibitors and then cleared by centrifugation. The protein concentration was adjusted to 1 μg/mL and aliquots (25-μg protein) were incubated with rhodamine 110, bis-N-CBZL-aspartyl-L-glutamyl-L-valyl-L-aspartic acid amide (Z-DEVD-R110) in a caspase assay buffer at 37°C. The rate of the rhodamine-leaving group released was determined by monitoring fluorescence at 520 nm at 2-minute intervals over a 45-minute period. Results represent averages from 4 or more independent experiments. Error bars are the SEM. *, significantly different from ** (P ≤ .05); and #, significantly from *** (P ≤ .05).
Figure 10.
Figure 10.
DA suppresses incretin enhanced proliferation of INS-1E cells. Cell proliferation of INS-1E cells was assessed by measuring [3H]thymidine incorporation or total cell numbers in replicate wells using the MTT assay after incubation in media alone or the indicated combinations of incretin and/or DA. Results are from a representative experiment in a series of 4. ** or ♦♦, significantly different from * or ♦, respectively, (P < .05).
Figure 11.
Figure 11.
Effect of DA on β-cell proliferation in C57Bl/6J islets. Mouse islets were isolated, and cells dispersed and plated as previously described (27). Next day, medium was changed, and 3mM or 15mM glucose with GLP-1 or vehicle was added to the cells. Twenty-four hours later, islet cells were fixed and stained for insulin and Ki67. An average of 2300 β-cells were counted per sample. Results are the average from 4 separate experiments using duplicate samples per experimental condition. Error bas are the SEM. **, significantly different from * (P < .05); ***, significantly different from ** (P < .05); ****, significantly different from ** (P < .05); +, approached significance different from * (P = .08).

Similar articles

Cited by

References

    1. Ionut V, Burch M, Youdim A, Bergman RN. Gastrointestinal hormones and bariatric surgery-induced weight loss. Obesity (Silver Spring). 2013;21(6):1093–1103. - PMC - PubMed
    1. Buchwald H, Avidor Y, Braunwald E, et al. Bariatric surgery: a systematic review and meta-analysis. JAMA. 2004;292(14):1724–1737. - PubMed
    1. Pories WJ, MacDonald KG, Jr, Morgan EJ, et al. Surgical treatment of obesity and its effect on diabetes: 10-y follow-up. Am J Clin Nutr. 1992;55(2 suppl):582S–585S. - PubMed
    1. Guidone C, Manco M, Valera-Mora E, et al. Mechanisms of recovery from type 2 diabetes after malabsorptive bariatric surgery. Diabetes. 2006;55(7):2025–2031. - PubMed
    1. Pournaras DJ, Osborne A, Hawkins SC, et al. Remission of type 2 diabetes after gastric bypass and banding: mechanisms and 2 year outcomes. Ann Surg. 2010;252(6):966–971. - PubMed

Publication types

MeSH terms