. 2015 Mar 9;10(3):e0119170.
doi: 10.1371/journal.pone.0119170. eCollection 2015.

Prevalence and correlation of infectious agents in hospitalized children with acute respiratory tract infections in Central China

Affiliations

Prevalence and correlation of infectious agents in hospitalized children with acute respiratory tract infections in Central China

Jia Liu et al. PLoS One. .

Abstract

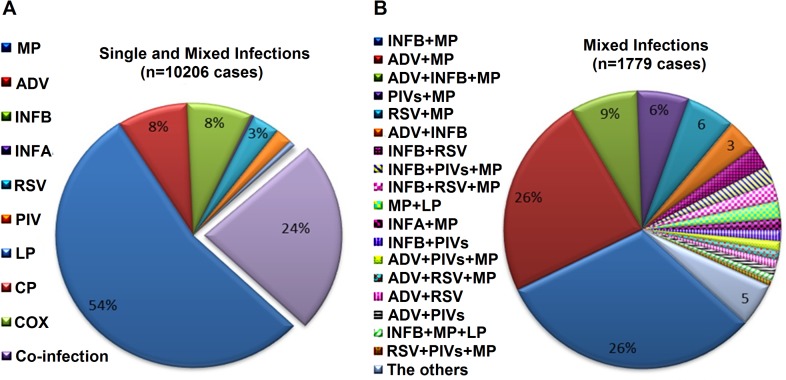
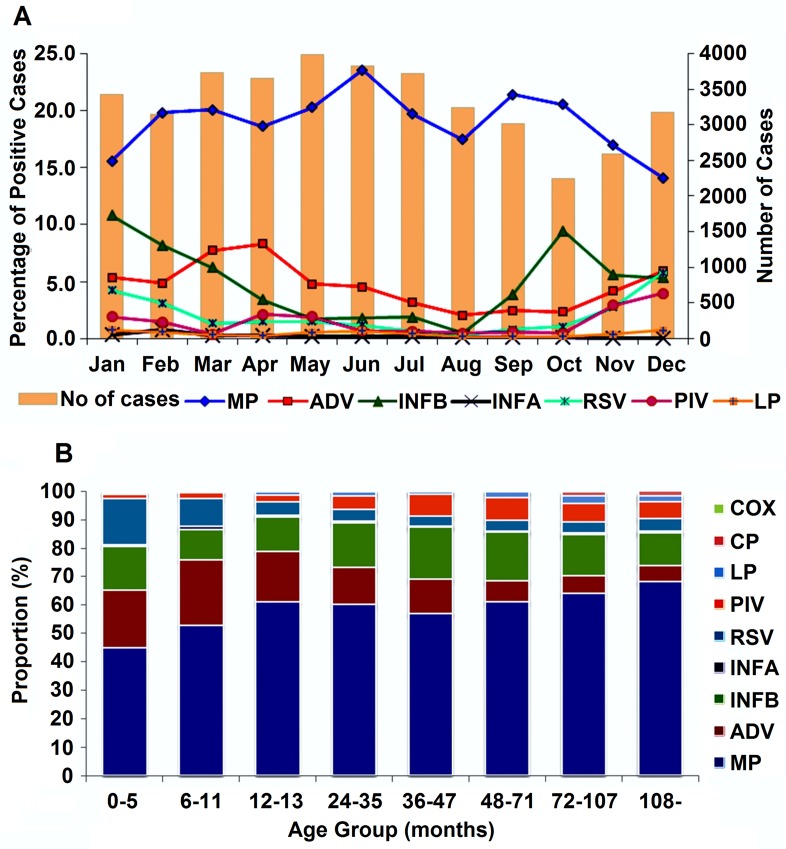
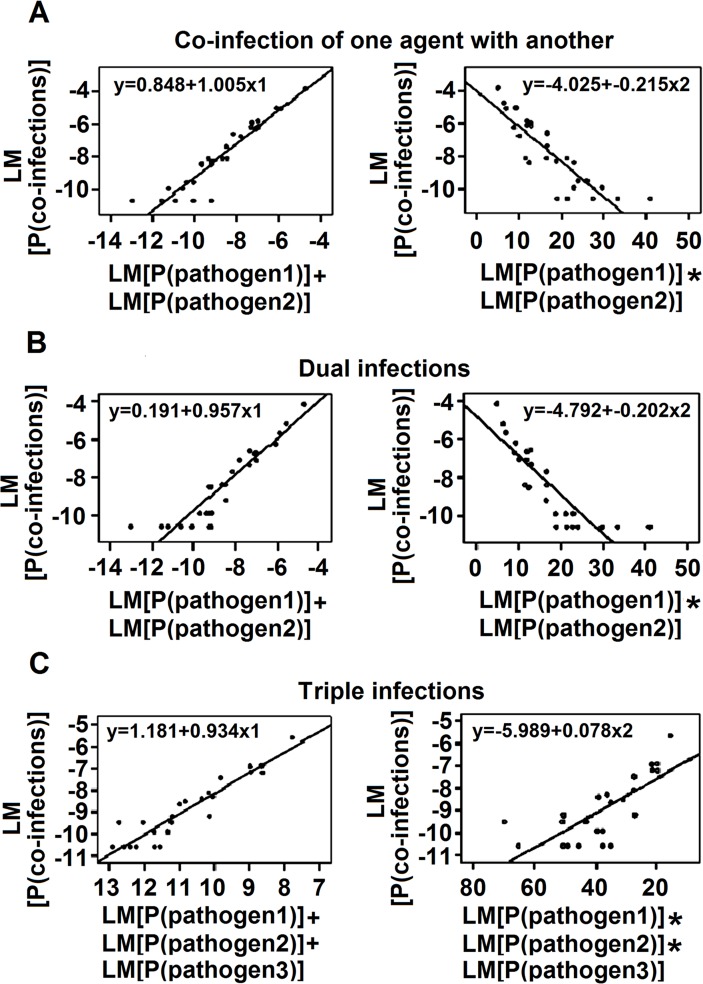
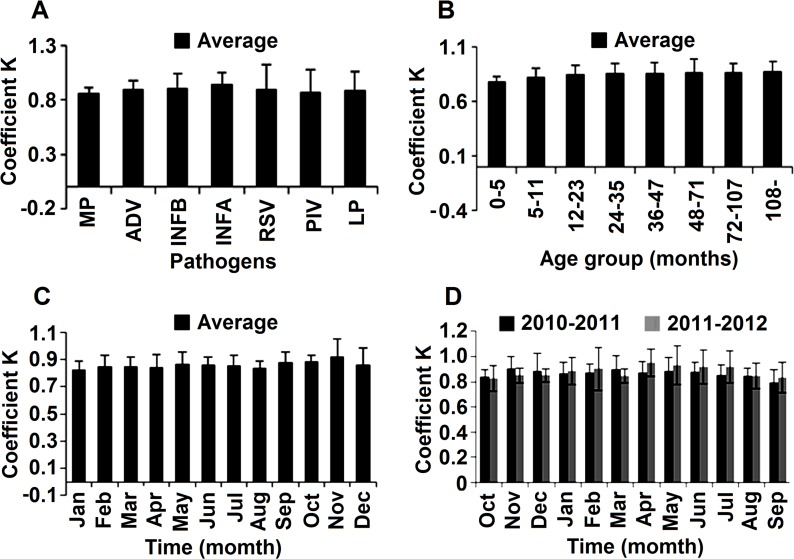
Acute respiratory tract infections (ARTIs) are associated with significant morbidity and mortality worldwide, especially in children under the age of 5 years. Almost 2 million children die from ARTIs each year, and most of them are from developing countries. The prevalence and correlation of pathogens in ARTIs are poorly understood, but are critical for improving case prevention, treatment, and management. In this study, we investigated the prevalence and correlation of infectious agents in children with ARTIs. A total of 39,756 children with one or more symptoms, including fever, cough, sore throat, tonsillitis, pharyngitis, herpangina, pneumonia, and bronchiolitis, were enrolled in the study. All patients were hospitalized in Wuhan Children's Hospital between October 1, 2010 and September 30, 2012, and were evaluated for infectious agents. Pathogens, including Mycoplasma pneumoniae, influenza A virus, influenza B virus, adenoviruses, respiratory syncytial virus, parainfluenza virus, Legionella pneumophila, Chlamydophila pneumoniae, and Coxiella burnetii, were screened simultaneously in patient blood samples using anti-pathogen IgM tests. Regression analysis was used to reveal correlations among the pathogens. Our results showed that one or more pathogens were identified in 10,206 patients, and that Mycoplasma pneumoniae, adenoviruses, and influenza B virus were the leading infectious agents. Mixed-infections of pathogens were detected in 2,391 cases, with Mycoplasma pneumoniae as the most frequent pathogen. The most common agents in the co-infections were Mycoplasma pneumoniae and influenza B virus. Regression analysis revealed a linear correlation between the proportion of mixed infections and the incidence of multi-pathogen infections. The prevalence of infectious agents in children with ARTIs was determined. Equations were established to estimate multiple infections by single-pathogen detection. This revealed a linear correlation for pathogens in children with ARTIs. This study provides useful information for improving case prevention and management.


Conflict of interest statement

Competing Interests: The authors have declared that no competing interests exist.

Figures

Fig 1
Fig 1. Prevalence of Respiratory Agents in Children with ARTIs.
(A) The spectra of single and mixed infections of diverse pathogens in children with ARTIs in Wuhan, China (10,206 cases). (B) The spectrum of mixed infections of diverse pathogens in children with ARTIs in Wuhan (1,779 cases). Note: *Others, including CP+MP (9 cases), INFB+LP (9 cases), AdV+IBV+PIV (9 cases), AdV+IBV+RSV+MP (9 cases), MP+COX (8 cases), AdV+IAV+MP (8 cases), RSV+MP+LP (7 cases), and others (54 cases). Abbreviations: MP, M. pneumonia; INFB, influenza B virus; INFA, influenza A virus; AdV, adenoviruses; RSV, respiratory syncytial virus; PIV, parainfluenza virus; LP, L. pneumophila; CP, C. pneumonia; and COX, C. burnetii.
Fig 2
Fig 2. Month and Age Distributions of ARTIs in Children from October 2010 to September 2012.
(A) Analysis of the percentage of ARTI cases positive for M. pneumoniae, adenoviruses, influenza B virus, influenza A virus, respiratory syncytial virus, parainfluenza virus, and L. pneumophila, and the number of positive ARTI cases in Wuhan, China each month from October 2010 to September 2012. (B) Proportions of different pathogens detected in 39,756 children aged 0 to 15 years (mean age 24.4±29.0 months) with ARTIs in Wuhan from October 2010 to September 2012. Abbreviations: MP, M. pneumonia; INFB, influenza B virus; INFA, influenza A virus; AdV, adenoviruses; RSV, respiratory syncytial virus; PIV, parainfluenza virus; LP, L. pneumophila.
Fig 3
Fig 3. The Linear Relationship between the Proportion of Mixed Infections and the Incidence of Each Pathogen Involved in the Infection.
(A) Mixed infections, including triple and quadruple pathogen infections. (B) Co-infections involving two pathogens. (C) Mixed infections involving three pathogens. Notes: Y{LN[P(co-infections)]} denotes the logarithm of the proportion of co-infections for pathogens 1 and 2 in all cases (39,756); X{LN[P(pathogen 1)]} denotes the logarithm of the proportion of pathogen 1 (including single and multiple infections) in all cases (39,756) and LN[P(pathogen 2)] that for pathogen 2; X1 denotes {LN[P(pathogen 1)]+LN[P(pathogen 2)]}; and X2 denotes {LN[P(pathogen 1)]*LN [P(pathogen 2)]}.
Fig 4
Fig 4. The Average K Coefficient(s) for the Linear Relationship.
(A) The average k coefficient for each pathogen. The k coefficients for different pathogens slightly differed from each other, but not significantly (p = 0.971). (B) Variations in the k coefficient by age group. The k coefficients for different age groups slightly differed from each other, ranging from 0.79–0.87 (P = 0.053). (C) The average k coefficient according to seasonal group. The k coefficients for different seasons were very similar (P = 0.285). The maximum D-value for k coefficients for the different seasons was 0.09. (D) Variation in k coefficient by month during the study period. The k coefficients for different months were similar, with no statistically significant differences (P = 0.499). Note k coefficients = y/x = LN[P(co-infections)] / (LN[P(pathogen 1)] + LN[(pathogen 2)]).

Similar articles

Cited by

References

    1. Williams BG, Gouws E, Boschi-Pinto C, Bryce J, Dye C. Estimates of world-wide distribution of child deaths from acute respiratory infections. Lancet Infect Dis. 2002;2: 25–32. - PubMed
    1. Zhou W, Lin F, Teng L, Li H, Hou J, Tong R, et al. Prevalence of herpes and respiratory viruses in induced sputum among hospitalized children with non-typical bacterial community-acquired pneumonia. PLoS One. 2013;8: e79477 10.1371/journal.pone.0079477 - DOI - PMC - PubMed
    1. McIntosh K. Community-acquired pneumonia in children. N Engl J Med. 2002;346: 429–437. - PubMed
    1. Dwigh A, Powell A. Mycoplasmal infection. In Nellson’ Textbook of Pediatrics, 1996; Vol, Chapter 196:824–827.
    1. Gonzalez-Del VM, Vena A, Valerio M, Marin M, Verde E, Muñóz P, et al. Coxiella burnetii infection in Hemodialysis and other vascular grafts. Medicine (Baltimore). 2014;93: 364–371. 10.1097/MD.0000000000000218 - DOI - PMC - PubMed