. 2015 Apr;22(4):312-8.
doi: 10.1038/nsmb.2990. Epub 2015 Mar 9.

NAD(+)-SIRT1 control of H3K4 trimethylation through circadian deacetylation of MLL1

Affiliations

NAD(+)-SIRT1 control of H3K4 trimethylation through circadian deacetylation of MLL1

Lorena Aguilar-Arnal et al. Nat Struct Mol Biol. 2015 Apr.

Abstract

The circadian clock controls the transcription of hundreds of genes through specific chromatin-remodeling events. The histone methyltransferase mixed-lineage leukemia 1 (MLL1) coordinates recruitment of CLOCK-BMAL1 activator complexes to chromatin, an event associated with cyclic trimethylation of histone H3 Lys4 (H3K4) at circadian promoters. Remarkably, in mouse liver circadian H3K4 trimethylation is modulated by SIRT1, an NAD(+)-dependent deacetylase involved in clock control. We show that mammalian MLL1 is acetylated at two conserved residues, K1130 and K1133. Notably, MLL1 acetylation is cyclic, controlled by the clock and by SIRT1, and it affects the methyltransferase activity of MLL1. Moreover, H3K4 methylation at clock-controlled-gene promoters is influenced by pharmacological or genetic inactivation of SIRT1. Finally, levels of MLL1 acetylation and H3K4 trimethylation at circadian gene promoters depend on NAD(+) circadian levels. These findings reveal a previously unappreciated regulatory pathway between energy metabolism and histone methylation.


Figures

Figure 1
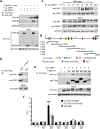
Figure 1. SIRT1 and NAD+ levels regulate circadian H3K4 trimethylation
(a) ChIP from histone H3K4me3 at specific regions of Dbp gene in mouse embryonic fibroblasts (MEFs) from wild type (WT) or Sirt1−/− mice, and WT MEFs treated with EX527 (50μM during 18 hours). Immunoprecipitated chromatin was quantified by real-time PCR, and data from WT samples at time 0 was set to 1. (b) H3K4me3 ChIP assays at the transcription start site (tss) of circadian genes in livers from wild type mice and Sirt1 KO littermates (Sirt1ΔEx4) harvested at the indicated zeitgeber times (ZT, hours after lights on). (c) ChIP from H3K4me3 at HoxA9 tss either in MEFs (top panel) or in livers (bottom panel). (d) Luciferase assay on Dbp-luc from 293 cells transfected with MLL1 and CLOCK–BMAL1 plasmids. (β–Nicotinamide adenine dinucleotide: NAD+ 2 mM, β–Nicotinamide mononucleotide: β–NMN 5 mM, Nicotinic acid: NA 10 mM, Nicotinamide: NAM 10 mM). Light units were normalized to an internal LacZ control, and the relative light units (RLU) from basal expression of Dbp-luc from non-treated cells were set to 1 (means ± s.e.m. of four independent experiments). (e) ChIP from histone H3K4me3 at indicated regions of the Dbp gene from synchronized MEFs either untreated or treated two hours before harvest with 1 mM of NAD+or 1 mM of β–NMN. For all ChIP experiments, immunoprecipitated chromatin was quantified by real-time PCR, and means ± s.e.m. of three independent replicates analyzed in triplicates are presented. *P < 0.05, **P < 0.01, ***P < 0.001, two tailed t-test.
Figure 2
Figure 2. SIRT1 and MLL1 interact
(a) Co-immunoprecipitation experiments from 293 cells transiently transfected with the indicated plasmids (IP, immunoprecipitation; IB, immunoblot). (b) Co-immunoprecipitation experiments in Mll1−/− cells and Mll1−/− stably transfected with Flag–MLL1. (c) Co-immunoprecipitation experiments from nuclear extracts of dexamethasone synchronized MEFs with anti SIRT1 antibody. Western blots were performed from immunoprecipitates (top panel) or nuclear extracts (input) at indicated circadian times (CT, hors post DEX synchronization). (d) Representation of the localization of the MLL1 truncation domains (M1–M6) used for cloning. (e) Co-immunprecipitation experiments using protein extracts from 293 cells transiently expressing the indicated plasmids. (f) Mammalian two–hybrid assays in 293 cells transiently transfected with the CLOCK or CLOCKΔ19 ‘bait’ plasmids (GAL4–CLOCK and GAL4–CLOCKΔ19) and the respective ‘prey’ plasmid (VP16 empty control, VP16–M1 to M6). The results are expressed as relative light units (RLU), representing the activation of the (GAL4–UAS)6–luciferase reporter normalized to the internal lacZ control, and units from VP16 empty control were set to 1. Data are presented as the mean±s.e.m. of three independent samples. *P < 0.05, **P < 0.01, ***P < 0.001, two tailed t-test.
Figure 3
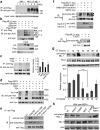
Figure 3. SIRT1 dependent deacetylation of MLL1 controls its activity
(a) Immunoprecipitation (IP) with anti Flag followed by western blot (IB) with an anti pan acetyl-lysine (anti AcK) antibody from protein extracts of either Mll1−/− MEFs or Mll1−/− stably transfected with Flag–MLL1 (F–MLL1). Four independent samples (1–4) are shown for each cell type. (b) Immunoprecipitation (IP) and western blot (IB) from total extracts of transiently transfected 293 cells with the indicated plasmids. (c) (left) anti Flag immunoprecipitation (IP) from total extracts of 293 cells expressing Flag-MLL1-myc and CBP-HA, and treated with Trichostatin A (TSA, 400 nM) or nicotinamide (NAM, 10 mM) for 16 hr. Western blots (IB) with anti pan acetyl-lysine (AcK) or anti myc for IP, and anti HA, anti Flag and anti actin for input are shown. (Right) histogram represents quantification of acetylated MLL1 normalized to total MLL1. The relative intensity of non-treated samples was set to 1. (Means ± s.e.m. from three experiments; **P < 0.01, two tailed t-test). (d) MLL1 in vitro deacetylation assay using either wild type SIRT1 or a deacetylase-inactive SIRT1 (SIRT1(H363Y)) with and without NAD+ and TSA. (e) Flag immunoprecipitation from cells expressing the plasmids Flag–M2 wild type or mutated at lysines 1130 (F-M2 K1130R), 1133 (F-M2 K1133R) or both (F-M2 K1130/3R), followed by western blot with the indicated antibodies (anti pan AcK, anti pan acetyl-lysine; anti acetyl MLL1, specific antibody against acetylated lysines K1130 and K1133 from MLL1). (f) Anti Flag immunoprecipitation from cells expressing the indicated plasmids followed by western blot using a specific antibody detecting acetylated lysines K1130 and K1133 from MLL1 (anti acetyl-MLL1) or anti myc. At the bottom panels, cells were treated with EX527 (50 μM, 18 hours) (G4BD, Gal4 binding domain). (g) Western blot from nuclear extracts of dexamethasone synchronized MEFs at indicated circadian times (CT, hours post DEX synchronization). Histogram shows quantification from acetyl MLL1 normalized to total MLL1. The relative intensity at CT0 was set to 1 (Means ± s.e.m. from three experiments, ***P < 0.001, two tailed t-test). (h) Western blot for nuclear extracts from MEFs either untreated or treated for two hours with the indicated compounds.
Figure 4
Figure 4. MLL1 H3K4 methyltransferase activity is modulated by SIRT1
(a) Luciferase assays using Dbp-luciferase reporter in 293 cells transiently transfected with the indicated plasmids. Increasing amounts of plasmids encoding SIRT1 and the mutant form SIRT1(H363Y) were assessed. Light units were normalized to an internal LacZ control, and the relative light units (RLU) from basal expression of Dbp-luc plasmid were set to 1 (means ± s.e.m. of three independent experiments). (b) Luciferase assays using Dbp–luciferase (top panel) or Per1–luciferase (bottom panel) reporters. Plasmids encoding MLL1 and CLOCK–BMAL1 were transiently transfected in 293 cells. EX527 treatments were performed 18 hours prior to luciferase assays. Light units were normalized to an internal LacZ control, and the relative light units (RLU) from basal expression of the reporter from non-treated cells were set to 1 (Means ± s.e.m. of four independent experiments). (c) In vitro MLL1 histone lysine methyltransferase assay (HKMT) on recombinant histone H3. The top panel corresponds to a western blot from myc-tagged MLL1 protein used for each assay. CBB, Coomassie Brilliant Blue staining from the gel used to measure radioactive H3. Methyl H3, autoradiography from H3 radioactively labeled with S-adenosyl-L-[methyl-3H]-methionine. Bottom panel, histogram representing quantification of radioactive H3 by liquid scintillation. The counts from the assay without MLL1 protein were set to 1(means ± s.e.m. of three independent measurements). Statistical analyses using two tailed paired t–test are presented; *P < 0.05, **P < 0.01, ***P < 0.001.
Figure 5
Figure 5
(a–c) Model depicting the NAD+–dependent molecular interplay between SIRT1 and MLL1 for the control of circadian gene expression and epigenetic states (see discussion).

Comment in

Similar articles

Cited by

References

    1. Feng D, Lazar MA. Clocks, metabolism, and the epigenome. Molecular cell. 2012;47:158–67. - PMC - PubMed
    1. Aguilar-Arnal L, Sassone-Corsi P. Chromatin landscape and circadian dynamics: Spatial and temporal organization of clock transcription. Proceedings of the National Academy of Sciences of the United States of America. 2014 - PMC - PubMed
    1. Koike N, et al. Transcriptional architecture and chromatin landscape of the core circadian clock in mammals. Science. 2012;338:349–54. - PMC - PubMed
    1. Ripperger JA, Schibler U. Rhythmic CLOCK–BMAL1 binding to multiple E-box motifs drives circadian Dbp transcription and chromatin transitions. Nature genetics. 2006;38:369–74. - PubMed
    1. Katada S, Sassone-Corsi P. The histone methyltransferase MLL1 permits the oscillation of circadian gene expression. Nature structural & molecular biology. 2010;17:1414–21. - PMC - PubMed

Publication types