. 2015 Mar 9:6:6355.
doi: 10.1038/ncomms7355.

Genomic analysis of ADAR1 binding and its involvement in multiple RNA processing pathways

Affiliations

Genomic analysis of ADAR1 binding and its involvement in multiple RNA processing pathways

Jae Hoon Bahn et al. Nat Commun. .

Abstract

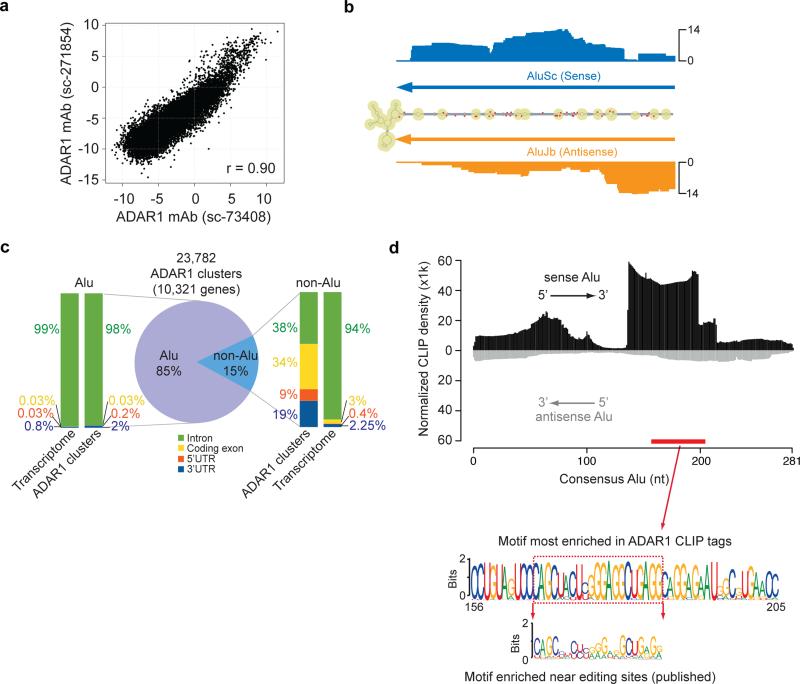
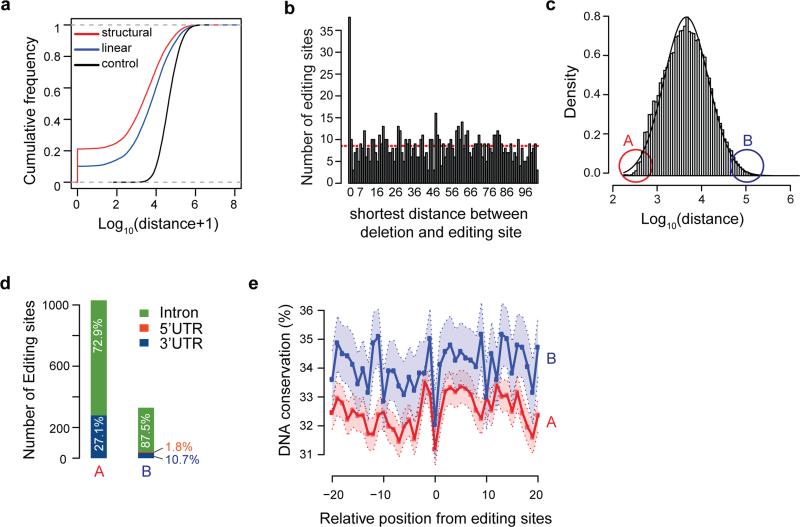
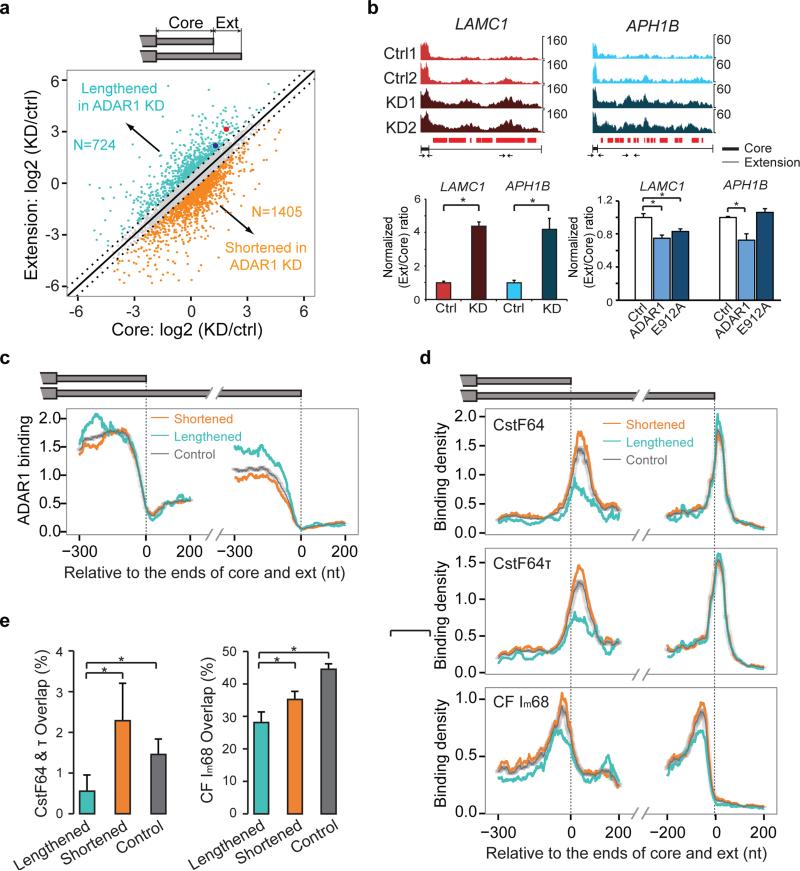
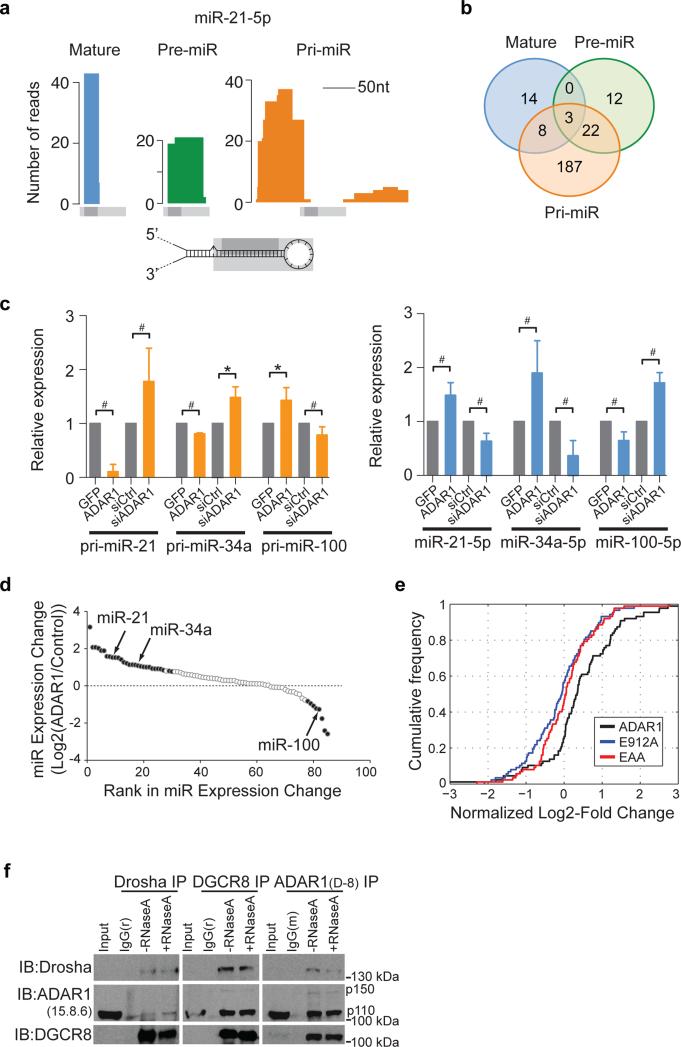
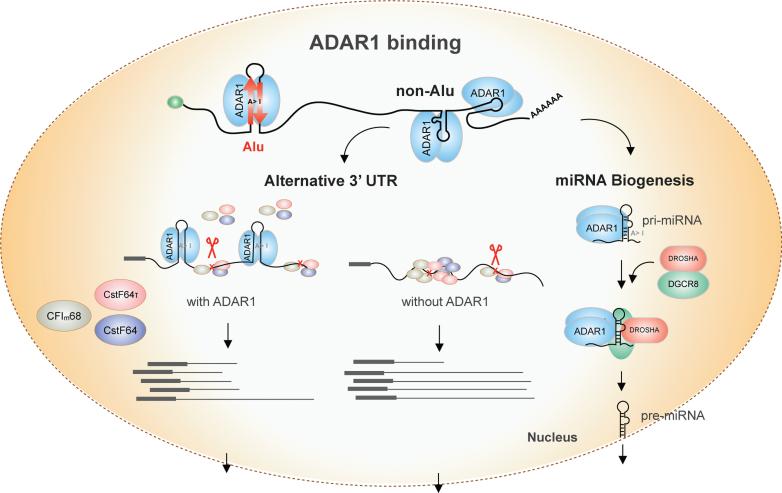
Adenosine deaminases acting on RNA (ADARs) are the primary factors underlying adenosine to inosine (A-to-I) editing in metazoans. Here we report the first global study of ADAR1-RNA interaction in human cells using CLIP-seq. A large number of CLIP sites are observed in Alu repeats, consistent with ADAR1's function in RNA editing. Surprisingly, thousands of other CLIP sites are located in non-Alu regions, revealing functional and biophysical targets of ADAR1 in the regulation of alternative 3' UTR usage and miRNA biogenesis. We observe that binding of ADAR1 to 3' UTRs precludes binding by other factors, causing 3' UTR lengthening. Similarly, ADAR1 interacts with DROSHA and DGCR8 in the nucleus and possibly out-competes DGCR8 in primary miRNA binding, which enhances mature miRNA expression. These functions are dependent on ADAR1's editing activity, at least for a subset of targets. Our study unfolds a broad landscape of the functional roles of ADAR1.


Figures

Figure 1
Figure 1. CLIP-Seq identifies ADAR1 binding sites in >10,000 human genes
(a) Reproducibility of ADAR1 CLIP tags using two different antibodies. Each dot in the scatter plot represents log2 enrichment relative to the background abundance measured by polyA+ RNA-Seq for a RefSeq transcript. (b) CLIP tag distribution in the 3' UTR of the PSMB gene. The secondary structure of this region is shown as predicted by RNAfold. The number of CLIP tags is shown for each corresponding position in the folded structure, together with the location of two Alu sequences (inverted-repeats). Known editing sites (DARNED database) are labeled with red dots. (c) Genomic distribution of reproducible ADAR1 CLIP sites. Similar distribution of nucleotides in the entire transcriptome is shown as a reference. (d) Alignment of CLIP reads to the consensus Alu sequence. The CLIP tag density was normalized against expected tag density obtained from simulated reads to represent overall sequence enrichment of all the relevant Alus. Alignment to the sense Alu consensus and antisense Alu consensus was carried out separately. Given their strand-specific nature, CLIP reads were aligned to either the sense or antisense Alu unambiguously. The motif most enriched in ADAR1 CLIP tags is shown (based on an independent motif search within CLIP clusters by MEME), which is located in the sense Alu as labeled by the red bar. The motif enriched near editing sites in U87MG cells discovered previously is also shown for comparison purpose.
Figure 2
Figure 2. ADAR1 binding signature reflects its function in RNA editing
(a) Shortest distance between ADAR1-bound Alu sites and RNA editing sites (DARNED database, same below) in the same gene. Linear: linear genomic distance; structural: distance calculated between predicted dsRNA structures harboring the CLIP cluster and editing sites; control: distance between CLIP clusters and random A's chosen from the same region as authentic editing sites. Both linear and structural distances are significantly smaller than control (p < 2.2e-16, Kolmogorov–Smirnov (KS) test). (b) Histogram of distance (up to 100nt) between deletions in CLIP reads and closest RNA editing sites in the same gene. Red dashed line represents the average distance in the range shown. (c) Histogram of closest distance between ADAR1-bound Alu clusters in the same gene. A and B denote the bottom and top 5% of distances respectively. (d) Genomic distribution of editing sites within 100nt of Alu clusters in groups A and B as defined in (c). The distribution of these editing sites in different regions of annotated genes is shown. Note that no editing sites were found in coding exons. (e) Conservation level of positions surrounding editing sites in groups A and B across primates. DNA conservation was calculated as % sequence identify. Light shaded area represents confidence intervals.
Figure 3
Figure 3. ADAR1 is involved in the regulation of alternative 3' UTR usage
(a) Expression levels of core and extended (ext) regions of tandem 3' UTRs identified in RNA-Seq data. Scatter plot of their expression change upon ADAR1 knockdown (KD) in U87MG cells compared to control siRNA transfection is shown. Those with at least 41.4% change (log2-fold change > 0.5) are marked with colors. Two groups are labeled: UTRs that were lengthened in ADAR1 KD cells and the opposite. The number of 3' UTRs in each group is shown. (b) Examples of ADAR1-regulated 3' UTRs (with the two genes labeled as big red and blue dots in panel (a). Read distribution plots in two biological replicates of RNA-Seq of control (Ctrl) and ADAR1 KD experiments are shown. To compare the relative coverage of extension and core regions, read counts were normalized such that the maximum count of the core region of each gene is the same in the 4 samples. Locations covered with CLIP reads are denoted as small red bars below the RNA-Seq read distribution. Real-time PCR validation is shown with primers illustrated as small arrows (primers within core regions are enlarged in the illustration due to limited core length). Expression of extension regions was normalized by that of the core region. The ratios were further normalized such that controls have a value of 1. Mean ± SD is shown for six biological replicates. *p < 0.05 (Wilcoxon Rank-Sum test). (c) Mean ADAR1 CLIP density near the 3' end of core and extension regions in the two groups as defined in (a). CLIP density was normalized using gene expression levels (RPKMs) derived from RNA-Seq data. Similarly normalized density in control 3' UTRs is shown. The controls (gray dots in (a)) were randomly picked to match the RPKM values of the regulated 3' UTRs. 95% confidence intervals are shown for the control curves that were calculated using 100 sets of randomly constructed, RPKM matched controls. (d) Mean CLIP density near the 3' end of core and extension regions of the same 3' UTR groups as in (c). The density was normalized in the same way as described in (c). The controls were again randomly picked to match the RPKM values of the regulated 3' UTRs. RNA-Seq data of HEK 293 cells (same cell type as for the CLIP data shown here) were used to calculate gene-level RPKM. (e) Percent overlap between ADAR1 targets and targets of the CstF74 & τ and CFIm68 calculated relative to the number of ADAR1 targets in the “lengthened”, “shortened” (as defined in (a)) and controls (gray dots in (a)). P values (*p < 0.05) were calculated by proportion tests and the error bars show the 95% confidence intervals. The number of samples in each group is illustrated in (a).
Figure 4
Figure 4. ADAR1 mediates pri-miRNA processing
(a) CLIP reads mapped to the mature, precursor and primary transcripts of miR-21-5p. Light and dark gray bars represent the relative locations of annotated mature and pre-miR-21. Stem-loop structure is shown for illustration purpose only that does not reflect the true structure of pre-miR-21. (b) Numbers of mature, pre-miR and pri-miR bound by ADAR1 and numbers of miRNAs with two or three forms bound by ADAR1 (shown as overlaps). Overlap p values between pri-miR and pre-miR: 0.024, between pri-miR and mature: 0.79 and between pre-miR and mature: 0.18, calculated using hypergeometric test and assuming a total of 410 miRNAs being expressed in U87MG cells (based on small RNA sequencing data). (c) Pri- (left panel) and mature miRNA expression (right panel) of endogenous miR-21-5p, miR-34a-5p, and miR-100-5p in U87MG cells as measured by RT-qPCR. Cells were transfected with the pEGFP-C1 vector (GFP), pEGFP-C1-ADAR1 vector (ADAR1), scrambled siRNA (siCtrl) or siRNA for ADAR1 (siADAR1) respectively. Results (mean and SD) from ≥4 biological replicates are shown. #p < 0.01, *p < 0.05 (Wilcoxon Rank-Sum test). (d) Expression change of miRNAs in U87MG cells with ADAR1 perturbation (KD or OE) relative to controls. Only miRNAs whose primary transcripts were associated with ADAR1 CLIP reads are included. Filled circles represent miRNAs with significantly altered expression in KD or OE. If the significance was observed in both experiments or if no significance was found in either experiment, the average expression change is shown. If only one experiment led to a significant change, the value of expression change in this experiment is shown. Two miRNAs were excluded because they demonstrated significant changes in both experiments, but in conflicting directions. (e) Cumulative distribution functions of log2-fold changes (LFCs) of miRNAs bound by ADAR1 in the primary form in U87MG cells upon OE of wildtype ADAR1, E912A or EAA mutants, compared to controls. The LFC values represent log2(OE/ctrls) which were further normalized by spike-in controls to account for technical variations across experiments. (f) ADAR1 associates with both DROSHA and DGCR8. Co-immunoprecipitation (Co-IP) experiments were performed using DROSHA antibody (ab12286), DGCR8 antibody (ab90579), ADAR1 antibody (D-8), or corresponding rabbit (r) or mouse (m) isotype IgG in HeLa cells. HeLa cells were used since DROSHA and DGCR8 expression is relatively higher in HeLa than in U87MG cells. IP samples were immunoblotted (IB) using ADAR1 antibody (15.8.6), DROSHA antibody (ab12286) and DGCR8 antibody (ab90579) to detect the corresponding antigens. ADAR1 interacts with both DROSHA and DGCR8, reciprocally but not the corresponding IgG isotype control. RNase A treatment does not significantly impair the interactions.
Figure 5
Figure 5. Schematic models of ADAR1 function in the nucleus on 3' UTR processing and miRNA biogenesis
These regulatory mechanisms are mainly executed by ADAR1 binding to non-Alu regions. ADAR1 may compete with other cleavage and polyadenylation factors (CF Im68, CstF64 and CstF64τ) in binding to 3' UTRs. In the presence of ADAR1, the three proteins impose reduced regulatory influence on ADAR1-bound 3' UTRs than on other 3' UTRs. Upon ADAR1 KD, these proteins could gain more access to the 3' UTRs and exert regulation. The proximal cleavage site is often chosen in the presence of ADAR1, whereas the distal site is used upon ADAR1 KD. These outcomes reflect combinatorial regulation by the cleavage and polyadenylation factors that have opposing impacts on alternative 3' UTR usage. For pri-miRNA processing, ADAR1 may bind to (and edit) the nascent primary transcript prior to DROSHA/DGCR8 binding. The Microprocessor then cleaves the pri-miRNA with or without binding to the RNA. The binding of ADAR1 mainly promotes the processing of pri-miRNA, leading to enhanced miRNA expression level.

References

    1. Bass BL. RNA editing by adenosine deaminases that act on RNA. Annual review of biochemistry. 2002;71:817–846. - PMC - PubMed
    1. Farajollahi S, Maas S. Molecular diversity through RNA editing: a balancing act. Trends in genetics : TIG. 2010;26:221–230. - PMC - PubMed
    1. Nishikura K. Functions and regulation of RNA editing by ADAR deaminases. Annual review of biochemistry. 2010;79:321–349. - PMC - PubMed
    1. Kawakubo K, Samuel CE. Human RNA-specific adenosine deaminase (ADAR1) gene specifies transcripts that initiate from a constitutively active alternative promoter. Gene. 2000;258:165–172. - PubMed
    1. Melcher T, Maas S, Herb A, Sprengel R, Seeburg PH, Higuchi M. A mammalian RNA editing enzyme. Nature. 1996;379:460–464. - PubMed

Publication types

Associated data