. 2015 Mar 9:6:6364.
doi: 10.1038/ncomms7364.

PW1/Peg3 expression regulates key properties that determine mesoangioblast stem cell competence

Affiliations

PW1/Peg3 expression regulates key properties that determine mesoangioblast stem cell competence

Chiara Bonfanti et al. Nat Commun. .

Abstract

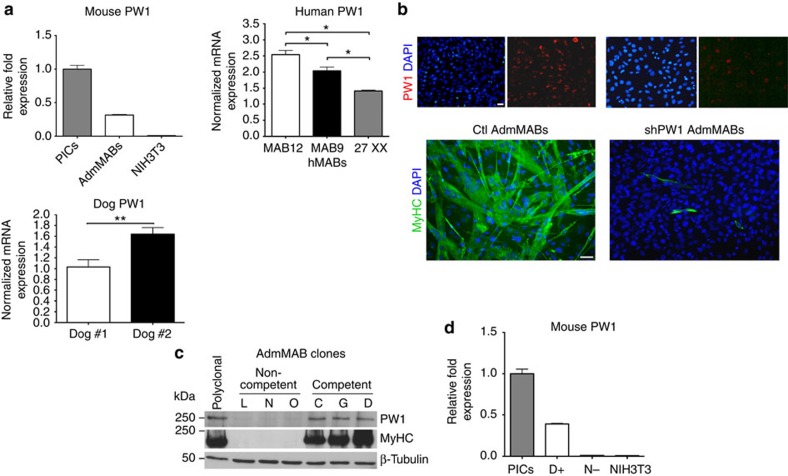
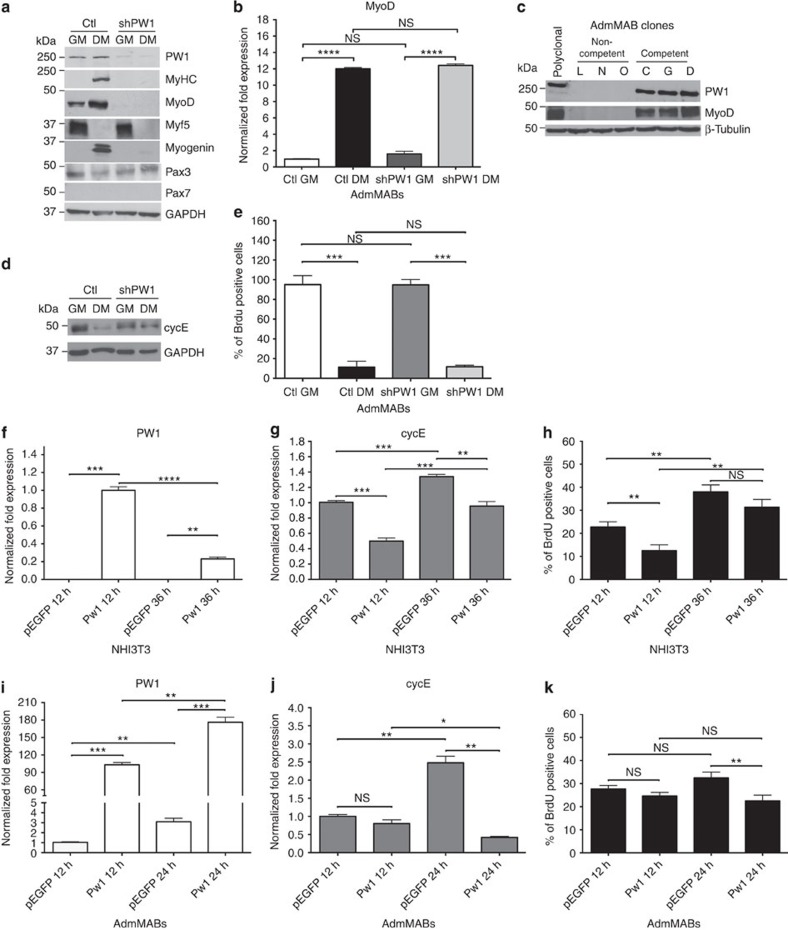
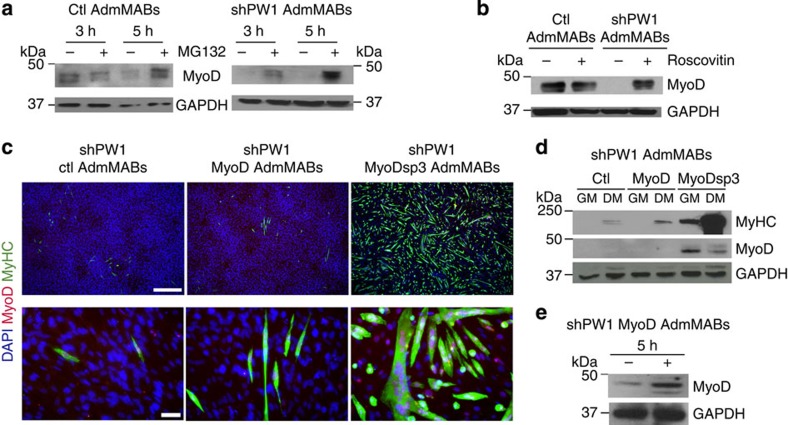
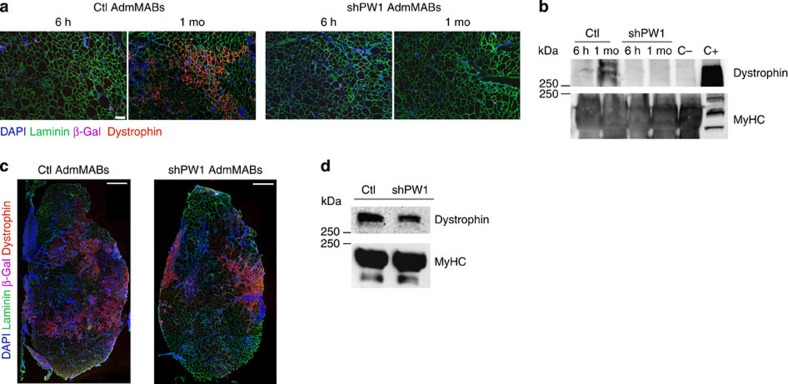
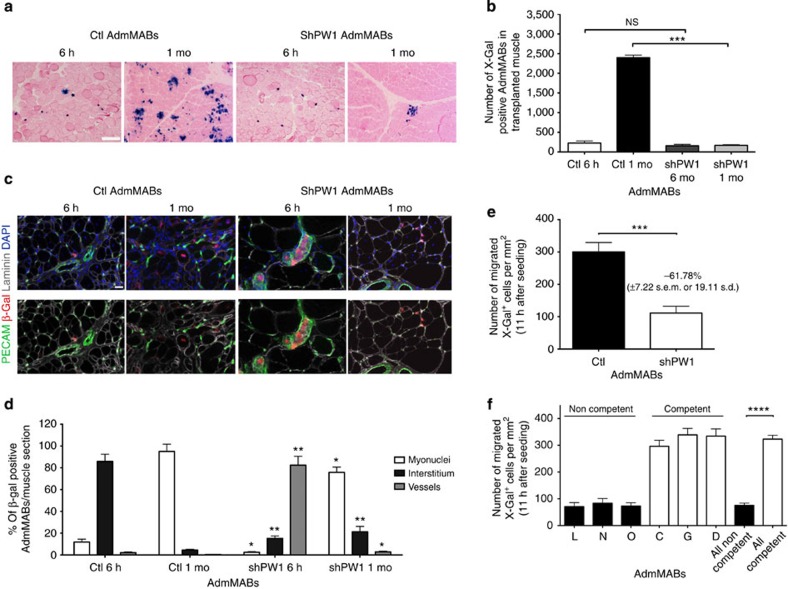
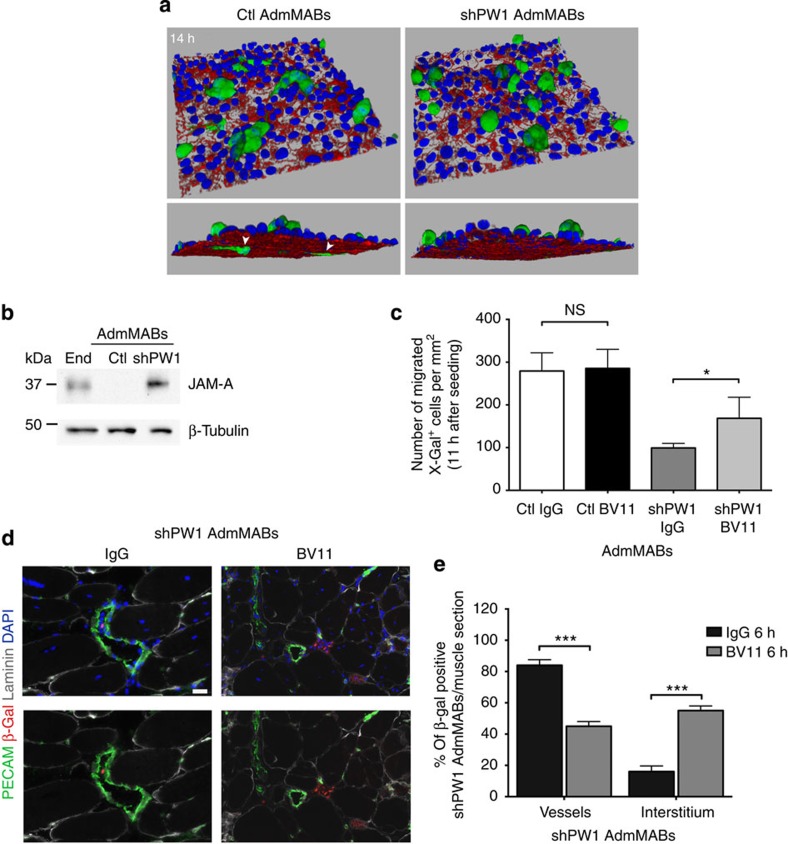
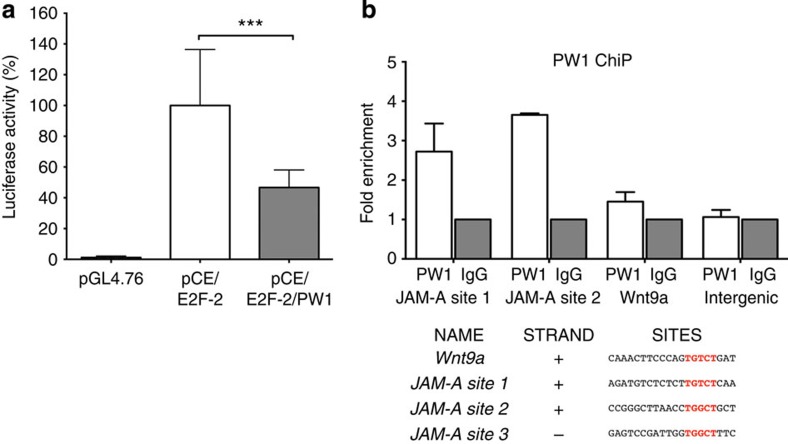
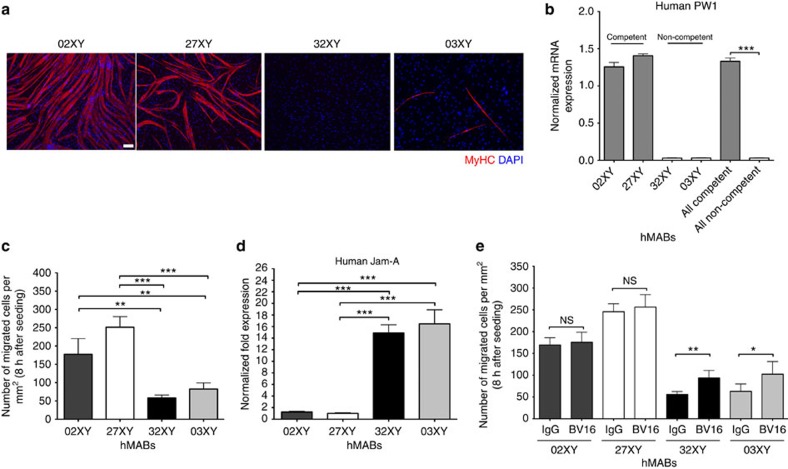
Mesoangioblasts are vessel-associated progenitor cells that show therapeutic promise for the treatment of muscular dystrophy. Mesoangioblasts have the ability to undergo skeletal muscle differentiation and cross the blood vessel wall regardless of the developmental stage at which they are isolated. Here we show that PW1/Peg3 is expressed at high levels in mesoangioblasts obtained from mouse, dog and human tissues and its level of expression correlates with their myogenic competence. Silencing PW1/Peg3 markedly inhibits myogenic potential of mesoangioblasts in vitro through MyoD degradation. Moreover, lack of PW1/Peg3 abrogates mesoangioblast ability to cross the vessel wall and to engraft into damaged myofibres through the modulation of the junctional adhesion molecule-A. We conclude that PW1/Peg3 function is essential for conferring proper mesoangioblast competence and that the determination of PW1/Peg3 levels in human mesoangioblasts may serve as a biomarker to identify the best donor populations for therapeutic application in muscular dystrophies.


Figures

Figure 1
Figure 1. Silencing of PW1 interferes with mesoangioblasts (MABs) muscle differentiation.
(a) PW1 expression by qRT–PCR on different populations of mouse adult (AdmMABs), human and canine MABs. Values are plotted as relative messenger RNA (mRNA) expression and normalized to GAPDH levels. For the AdmMABs, values are expressed as fold expression relative to subpopulation of interstitial cells (PICs; =1). Each assay was performed in triplicate. Data are represented as means±s.d. *P<0.05, ns, not significant one-way unpaired t Test. (b) Immunofluorescence analysis for PW1 (red) and for the expression of all sarcomeric myosins (MyHC, green) on Ctl and shPW1 AdmMAB growing cells upon 5 days in differentiation medium. DAPI was used to stain nuclei. Scale bar represents 100 and 50 μm. (c) Western blot analysis of MyHC and PW1 expression on six different clones of AdmMABs isolated and selected for the different myogenic potency. Clones have been divided in competent (C, G, D) and non-competent (L, N, O) on the basis of their myogenic property. β-Tubulin was used to normalize the amount of loaded proteins. Polyclonal AdmMABs were used as a positive control. (d) PW1 expression by qRT–PCR on representative clones of competent (D+) and non-competent AdmMABs (N−). Values are normalized to GAPDH levels and expressed as fold expression relative to PICs (=1). NIH3T3 fibroblasts were used as negative control.
Figure 2
Figure 2. PW1 is necessary for MAB myogenic competence and negatively regulates cyclinE expression.
(a) Western blot for PW1 and myogenic markers expressed by Ctl and shPW1 AdmMABs. GAPDH was used to normalize. GM, growing medium; DM, differentiation medium. (b) MyoD expression by qRT–PCR on Ctl and shPW1 AdmMABs in GM and DM. Values are plotted as relative fold expression and normalized to GAPDH expression. Each assay was performed in triplicate. Data are represented as means ± s.d. ****P<0.0001, NS, not significant one-way unpaired t-test. (c) Western blot for PW1 and MyoD expression on non-competent (L, N, O) and competent (C, G, D) AdmMAB clones. β-Tubulin was used to normalize. (d) Western blot for cycE expression in Ctl versus shPW1 AdmMABs in growing and differentiating conditions. GAPDH was used to normalize. (e) 5′-bromo-deoxyuridine (BrdU) incorporation assay for Ctl and shPW1 AdmMABs. Each assay was performed in triplicate. Data are represented as means ± s.d. ***P<0.0005, NS, not significant one-way unpaired t-test. (f,g) Real time analysis showing PW1 (f) and cycE (g) levels in NIH3T3 cells transfected with plasmid expressing PW1 (PW1) or an empty vector, as control (pEGFP) after 12 (12 h) and 36 h (36 h) from the transfection. Values are plotted as relative fold expression and normalized to GAPDH expression. Each assay was performed in triplicate. (h) BrdU incorporation assay on transfected NIH3T3 mouse fibroblasts. (i,j) Real time analysis showing PW1 (i) and CycE (j) levels on AdmMABs. Cells have been transiently transfected with plasmid expressing PW1 (PW1) and an empty vector, as control (pEGFP). Cells have been analysed after 12 (12 h) and 24 h (24 h) from the transfection. Values are plotted as relative fold expression and normalized to GAPDH expression. Each assay was performed in triplicate. (k) BrdU incorporation assay on transfected AdmMABs by incubating with 50 μM BrdU for 1 h, just before being stopped for the following qRT–PCR analysis. Each assay was performed in triplicate. All data are represented as means ± s.d. *P<0.05, **P<0.005, ***P<0.0005, ****P<0.0001, NS, not significant, one-way unpaired t-test.
Figure 3
Figure 3. Silencing of PW1 leads to MyoD degradation via cycE/Cdk2-proteasome-dependent pathway.
(a) Western blot analysis of MyoD accumulation in Ctl and shPW1 AdmMABs following treatments with 50 μM of the proteasome inhibitor MG132, for 3 and 5 h and (b) 5 μM of the cdk2 inhibitor, Roscovitin for 5 h.The +refers to MG132- or Roscovitin-treated cells, whereas − refers to only DMSO-treated cells. GAPDH was used to normalize the amount of loaded proteins. (c) Immunofluorescence staining for myosin heavy chain (MyHC, green), MyoD (red) and nuclei (DAPI) on shPW1 AdmMABs transduced with retroviral vector expressing wt MyoD (shPW1 MyoD AdmMABs), mutated MyoD (shPW1 MyoDsp3 AdmMABs) and empty control vector (shPW1 Ctl AdmMABs). Scale bars, 500 and 75 μm. (d) Western blot analysis of the experiment described in c: MyoD and myosin heavy chain (MyHC) expression were checked in proliferating (GM) and differentiated (DM) shPW1 AdmMABs transduced with retrovirus expressing wt MyoD (MyoD), mutated MyoD (MyoDsp3) and empty control vector (Ctl). GAPDH was used to normalize the amount of loaded proteins. (e) MyoD expression, evaluated by western blot, in shPW1 AdmMABs stably transduced with the retrovirus expressing the wt MyoD (shPW1 MyoD) and treated for 5 h with the proteasome inhibitor MG132. The +refers to MG132-treated cells, whereas − refers to only DMSO-treated cells. GAPDH was used to normalize the amount of loaded proteins.
Figure 4
Figure 4. PW1-silenced MABs do not rescue the dystrophic phenotype after intra-arterial transplantation in scid-mdx mouse.
(a) Immunofluorescence staining for laminin (green), dystrophin (red), β-Gal (pink) and nuclei (DAPI, blue) on serial transverse sections of gastrocnemius muscle, 6 h and 1 month after intra-femoral artery injection of n-LacZ Ctl and shPW1 adult murine MABs (AdmMABs) into scid-mdx mice. Scale bar, 100 μm. n=4 for each group. (b) Western blot analysis of dystrophin expression in transplanted scid-mdx muscles, 6 h and 1 month (1 mo) after cell transplantation. C+ is a wt muscle, used as a positive control for Dystrophin expression; C− is an mdx-not transplanted muscle, representing the negative control for dystrophin expression. The expression of all the sarcomeric myosins, MyHC, was used to normalize the amount of loaded proteins. The C+ was loaded 10 times less to avoid Ab titration and photo bleaching. (c) Immunofluorescence staining for laminin (green), dystrophin (red), β-Gal (pink) and nuclei (DAPI, blue) on the transplanted tibialis anterior muscle, 1 month after intra-muscular injection of n-LacZ Ctl and shPW1 adult murine MABs (AdmMABs) into scid-mdx mice. n=4 for each group. Scale bar, 500 μm. (d) Western blot analysis of dystrophin expression in transplanted scid-mdx muscles, 1 month after cell transplantation. The expression of all the sarcomeric myosins, MyHC, was used to normalize the amount of loaded proteins.
Figure 5
Figure 5. Silencing of PW1 impairs mesoangioblast ability to cross the vessel wall.
(a) Eosin and X-Gal staining on serial transverse sections of gastrocnemius muscle of transplanted scid-mdx mice, 6 h and 1 month (mo) after intra-arterial injection of n-LacZ Ctl and shPW1 cells. X-Gal was used to identify transplanted n-LacZ MABs. Scale bar, 200 μm. This observation has been quantified in the graph (b) Values are plotted as total number of X-Gal positive MABs in transplanted grastrocnemius muscles (n=4). Data are means (±s.d.) for each group. ***P<0.0005, NS, not significant, unpaired one-way t-test. (c) Immunofluorescence staining for laminin (grey), β-Gal (red), PECAM (green) and nuclei (DAPI) has been performed on the serial transverse sections of the transplanted muscle. Scale bar represents 25 μm. The result from this analysis has been quantified in the graph (d). Values are plotted as % of β-Gal positive MABs per muscle section (both Ctl and shPW1 AdmMABs) associated to vessel (PECAM positive), inside or outside (interstitium) the myofibres (by using laminin as reference). Statistical analysis has been performed comparing, for each time point, the shPW1 AdmMABs column with the respective Ctl column for the different markers. Each assay was performed in triplicate. All data are represented as means ± s.d.*P<0.5 **P<0.005, unpaired one-way t-test. (e,f) The H5V Endothelial cells were seeded on gelatin-coated filters. Ctl (AdmMABs) and shPW1 MABs (shPW1 AdmMABs) (e) or competent (C, G and D) and non-competent (L, N and O) AdmMAB clones (f) were added to the upper chamber and allowed to migrate for 11 h. Migrated MABs on the lower side of the filters (X-Gal blue nuclei) were fixed and counted. Quantification of migrated AdmMABs per area is shown. Data are means (±s.d.) from five independent experiments, each of these was run in triplicate. ***P<0.0005, ****P<0.0001, unpaired one-way t-test.
Figure 6
Figure 6. Impairment of JAM-A rescues the shPW1 AdmMABs transmigration in vitro and in vivo.
(a) Time-course of 6-carboxyfluorescein diacetate (6-CFDA)-labelled Ctl and shPW1 AdmMABs transmigration across H5V endothelial cells seeded onto collagen matrix. Ctl and shPW1 AdmMABs were fixed at different time points during the transmigration assay and then the endothelial junctions were stained with anti-VE-cadherin (red) and nuclei (DAPI, blue). Three-dimensional reconstructions of a confocal z-stack taken after 14 h of Ctl and shPW1 AdmMABs transmigration are shown. The white arrowheads highlighted the portion of MABs under the endothelium. xyz field of view dimension 238.1 × 238.1 × 38.1 μm. (b) Western blot of JAM-A expression in Ctl and shPW1 AdmMABs. End, lung endothelial cells. β-Tubulin was used to normalize. (c) n-LacZ Ctl and shPW1 AdmMABs were pre-treated (2 h) with non-related IgG (20 μg ml−1) and JAM-A neutralizing antibody (anti-JAM-A mAb, 20 μg ml−1, BV11), respectively. Following this, cells were added to the upper chamber and allowed to migrate for 11 h. Migrated MABs on the lower side of the filters (X-Gal blue nuclei) were fixed and counted. Quantification of migrated MABs per area is shown. Data are means (±s.d.) from five independent experiments run in triplicate. *P<0.05, NS, not significant, unpaired one-way t-test. For figure in d, n-LacZ shPW1 AdmMABs were pre-treated (2 h) with non-related IgG (20 μg ml−1) and JAM-A neutralizing antibody (anti-JAM-A mAb, 20 μg ml−1, BV11), respectively. After antibody incubation, the n-LacZ shPW1 AdmMABs were intra-arterial transplanted in scid-mdx mouse. (d) Immunofluorescence staining for laminin (grey), β-gal (red), PECAM (green) and nuclei (DAPI, blue) on serial transverse sections of gastrocnemius muscle, 6 h after transplantation. Scale bar, 25 μm. The picture is representative of results obtained from two independent experiments (n=4 of mice used). The result from this analysis has been quantified in the graph (e). Values are plotted as % of β-Gal positive shPW1 AdmMABs per muscle section associated to vessel (PECAM positive), inside or outside (interstitium) the myofibres (by using laminin as reference). Statistical analysis has been performed comparing the BV11-treated shPW1 AdmMABs column with the respective IgG column for the different markers. ***P<0.0005.
Figure 7
Figure 7. PW1 acts through a mechanism involving the direct binding to JAM-A promoter.
(a) Luciferase activity was measured in triplicates 48 h after NIH3T3 transfection with pGL4.76 vector alone or together with pLuc-cycE/E2F-2 (pCE/E2F-2) or pLuc-cycE/E2F-2 plus PW1 (pCE/E2F-2/PW1). Data are means of 5 independent experiments, each of these was run in triplicate, and expressed as % of luciferase activity relative to the (pCE/E2F-2) signal. All the values have been normalized to the pGL4.76 signal. All data are represented as means ± s.d. from 5 independent experiments. ***P<0.0005, unpaired one-way t-test. (b) PW1 chromatin immunoprecipitation assay on growing AdmMABs to test two different putative PW1 binding sites on JAM-A promoter (JAM-A site 1 and site 2). Binding on Wnt9a promoter and on an intergenic region were checked as a predictive positive and negative controls, respectively. Data are means of two independent experiments and expressed as fold enrichment relative to the IgG signal.
Figure 8
Figure 8. PW1 levels strongly correlate with the myogenic and transmigration ability of human MABs.
(a) Immunofluorescence analysis for MyHC (red) in four different populations of hMABs. DAPI was used to stain the nuclei. Scale bar, 100 μm. (b) Human PW1 expression by qRT–PCR on four different populations of hMABs divided in competent (02XY and 27XY) and non-competent (32XY and 03XY) on the basis of the myogenic property shown in a. Values are plotted as relative expression and normalized to GAPDH expression. Each assay was performed in triplicate. All data are represented as means ± s.d. ****P<0.0001, unpaired one-way t-test. (c) HUVECs endothelial cells were seeded on gelatin-coated filters. Four different polyclonal hMABs, previously labelled with 3.33 μM 6-carboxyfluorescein diacetate (6-CFDA), were added to the upper chamber and allowed to migrate for 8 h. Migrated hMABs on the lower side of the filters (fluorescein isothiocyanate-positive cells) were fixed and counted. Quantification of migrated hMABs per area is shown. Data are means (±s.d.) from five independent experiments, each of these was run in triplicate. **P<0.005, ***P<0.0005, unpaired one-way t-test. (d) Human JAM-A expression by qRT–PCR on hMABs. Values are plotted as relative fold expression and normalized to GAPDH expression. All data are represented as means ± s.d. Each assay was performed in triplicate. ***P<0.0005; unpaired one-way t-test. (e) The HUVEC endothelial cells were seeded on gelatin-coated filters. Competent (02XY and 27XY) and non-competent (32XY and 03XY) hMABs, previously pre-incubated with the anti-human JAM-A BV16 (12 μg ml−1) and the IgG (12 μg ml−1) as control, were then labelled with 3.33 μM 6-CFDA. Cells were then added to the upper chamber and allowed to migrate for 8 h. Migrated hMABs on the lower side of the filters were fixed and counted. Quantification of migrated hMABs per area is shown. Data are presented as means (±s.d.) from five independent experiments, each of these was run in triplicate. **P<0.005, *P<0.5, unpaired one-way t-test.

References

    1. Minasi M. G. et al. The meso-angioblast: a multipotent, self-renewing cell that originates from the dorsal aorta and differentiates into most mesodermal tissues. Development 129, 2773–2783 (2002) . - PubMed
    1. Sampaolesi M. et al. Cell therapy of alpha-sarcoglycan null dystrophic mice through intra-arterial delivery of mesoangioblasts. Science 301, 487–492 (2003) . - PubMed
    1. Gargioli C., Coletta M., De Grandis F., Cannata S. M. & Cossu G. PlGF-MMP-9-expressing cells restore microcirculation and efficacy of cell therapy in aged dystrophic muscle. Nat. Med. 14, 973–978 (2008) . - PubMed
    1. Diaz-Manera J. et al. Partial dysferlin reconstitution by adult murine mesoangioblasts is sufficient for full functional recovery in a murine model of dysferlinopathy. Cell Death Dis. 1, e61 (2010) . - PMC - PubMed
    1. Tedesco F. S. et al. Stem cell-mediated transfer of a human artificial chromosome ameliorates muscular dystrophy. Science Transl. Med. 3, 96ra78 (2011) . - PubMed

Publication types

MeSH terms

Associated data