. 2015 Mar 9:6:6473.
doi: 10.1038/ncomms7473.

Bmi1 limits dilated cardiomyopathy and heart failure by inhibiting cardiac senescence

Affiliations

Bmi1 limits dilated cardiomyopathy and heart failure by inhibiting cardiac senescence

I Gonzalez-Valdes et al. Nat Commun. .

Erratum in

Retraction in

Abstract

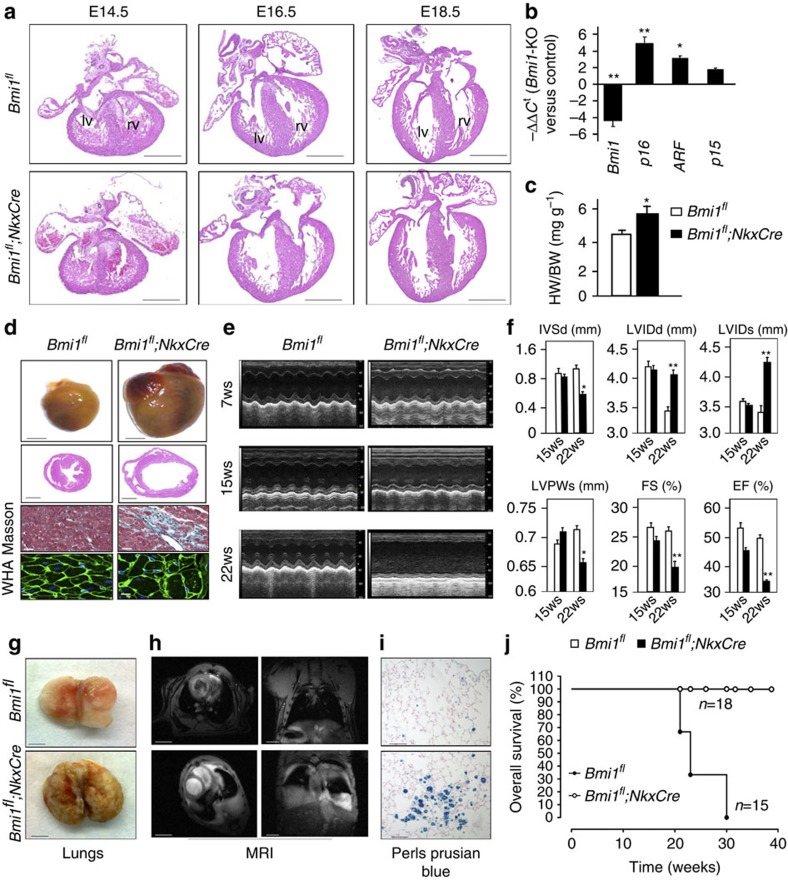
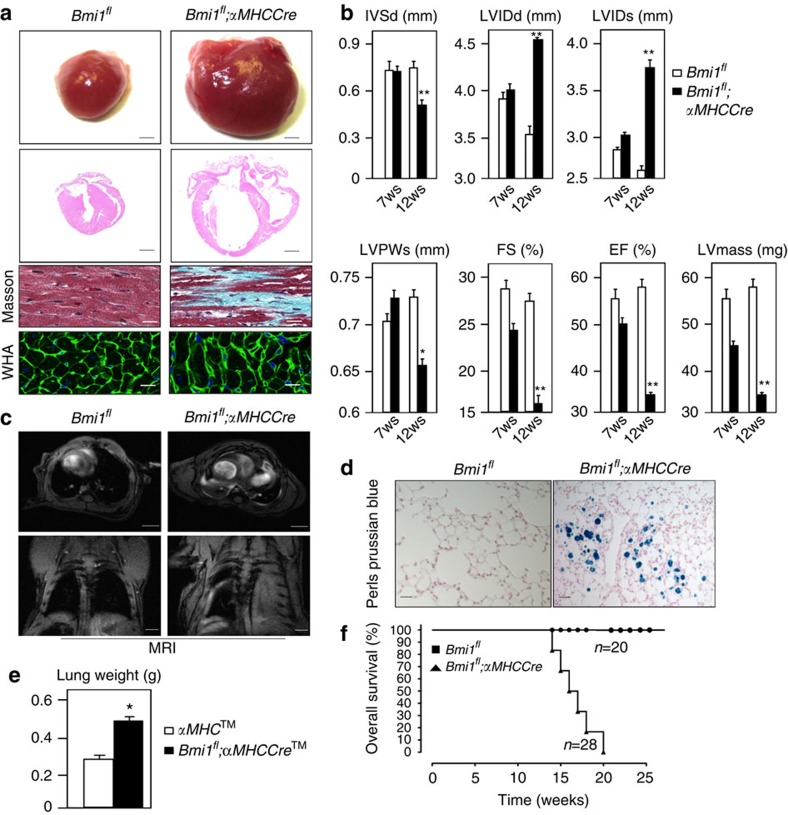
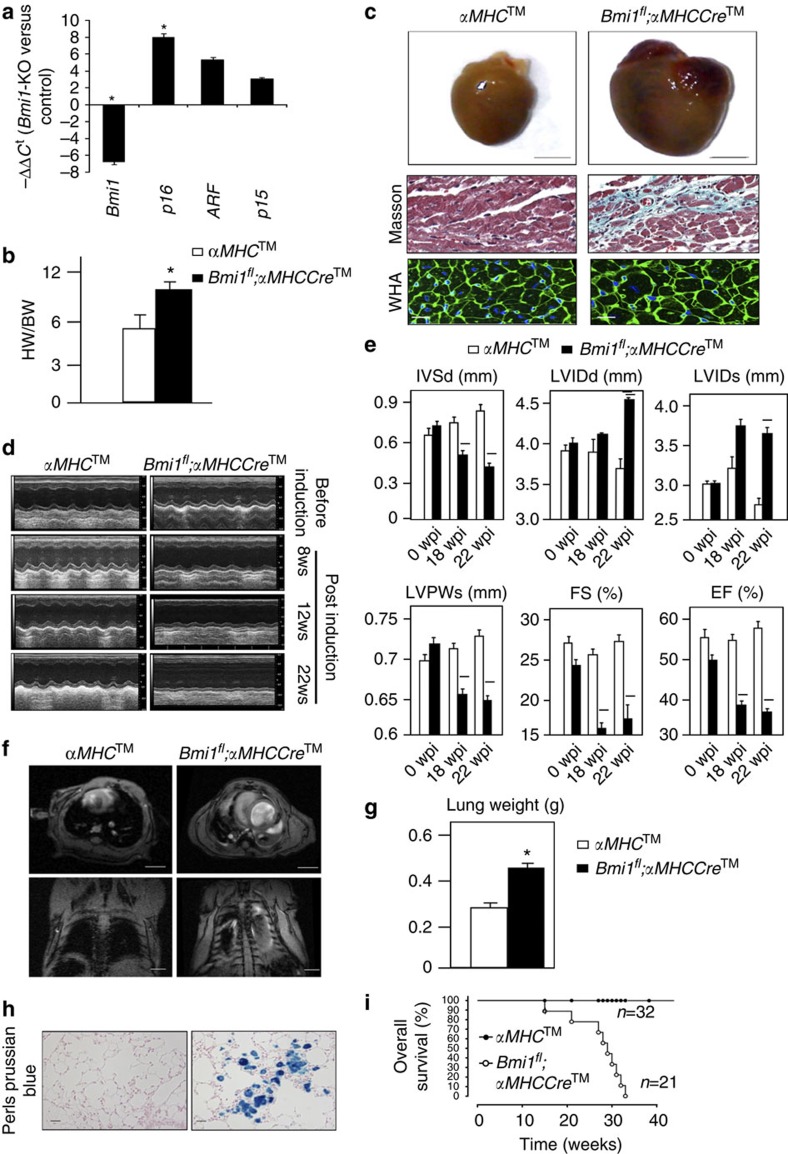
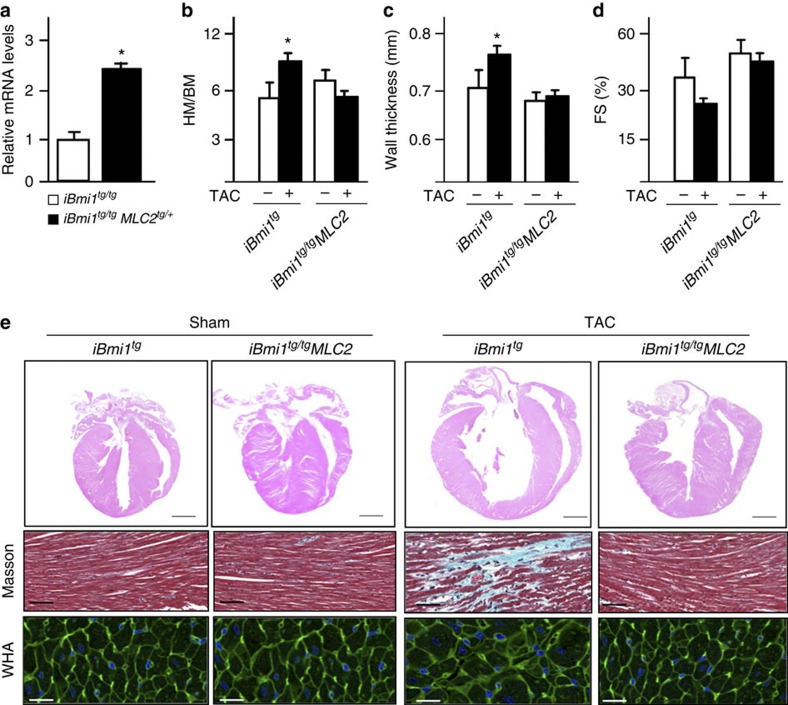
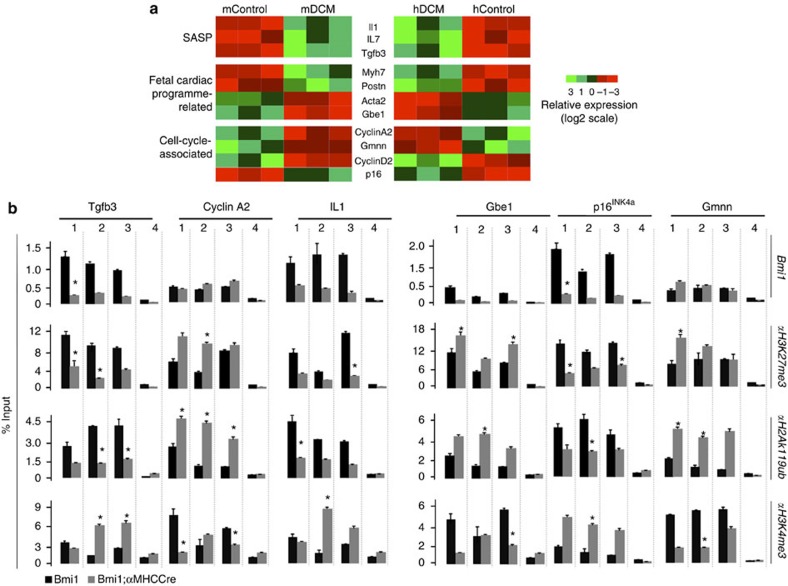
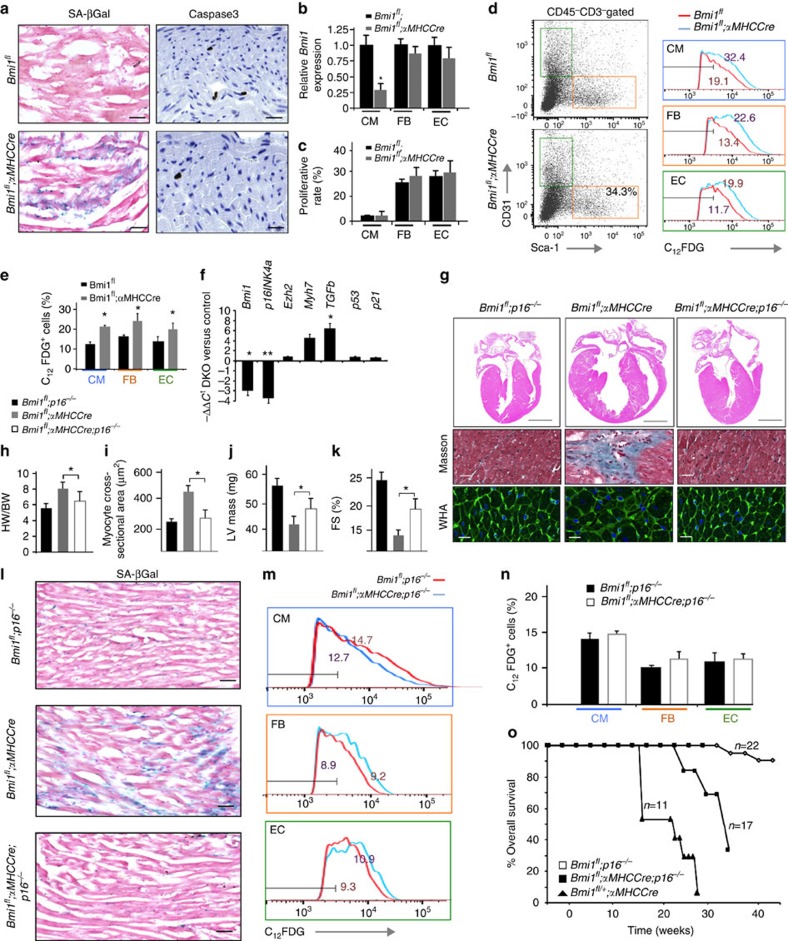
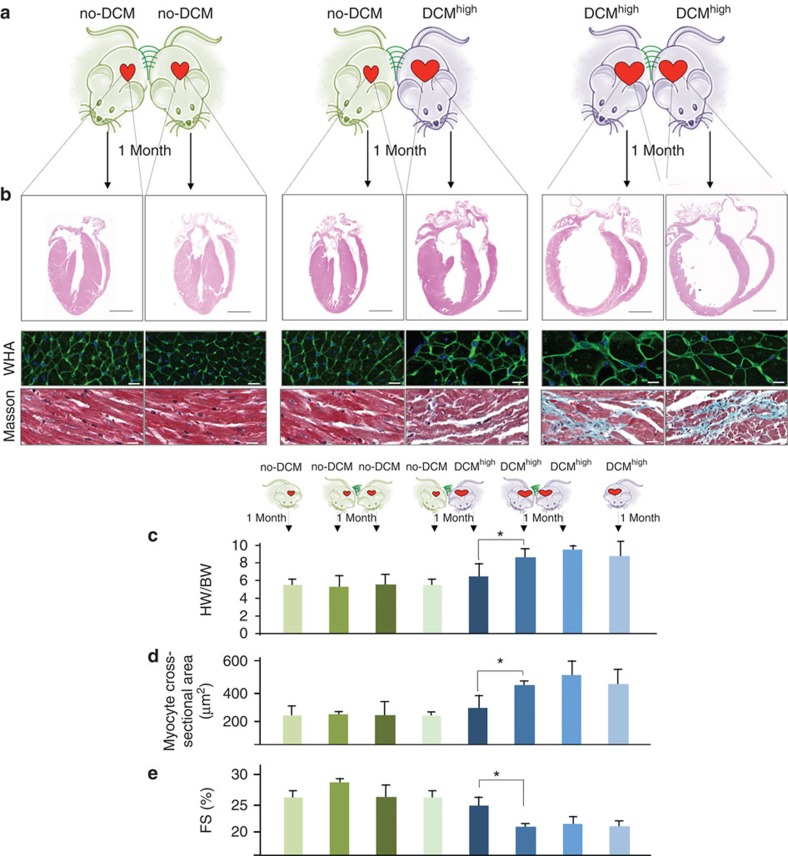
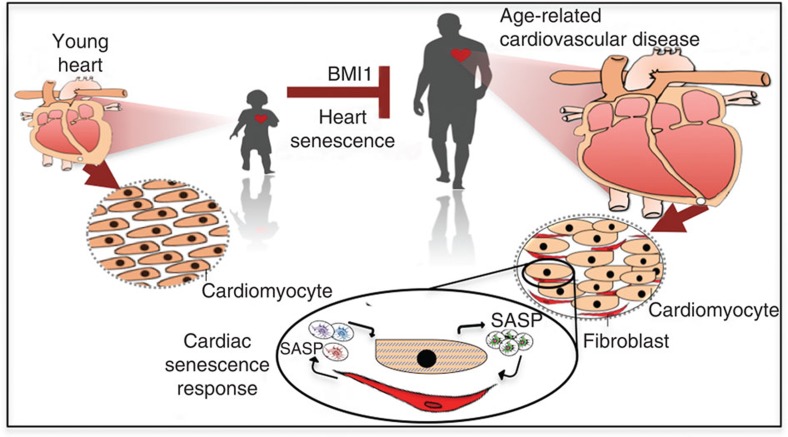
Dilated cardiomyopathy (DCM) is the most frequent cause of heart failure and the leading indication for heart transplantation. Here we show that epigenetic regulator and central transcriptional instructor in adult stem cells, Bmi1, protects against DCM by repressing cardiac senescence. Cardiac-specific Bmi1 deletion induces the development of DCM, which progresses to lung congestion and heart failure. In contrast, Bmi1 overexpression in the heart protects from hypertrophic stimuli. Transcriptome analysis of mouse and human DCM samples indicates that p16(INK4a) derepression, accompanied by a senescence-associated secretory phenotype (SASP), is linked to severely impaired ventricular dimensions and contractility. Genetic reduction of p16(INK4a) levels reverses the pathology of Bmi1-deficient hearts. In parabiosis assays, the paracrine senescence response underlying the DCM phenotype does not transmit to healthy mice. As senescence is implicated in tissue repair and the loss of regenerative potential in aging tissues, these findings suggest a source for cardiac rejuvenation.


Conflict of interest statement

The authors declare no competing financial interests.

Figures

Figure 1
Figure 1. Bmi1 is not required for normal cardiac development.
(a) Representative heart sections from Bmi1f/f;Nkx-Cretg/+ (Bmi1fl;NkxCre) and Bmi1f/f;Nkx-Cre+/+ (Bmi1f/) E14.5, E16.5 and E18.5 embryos (scale bar, 200 μm). Rv, right ventricle; lv, left ventricle. (b) Quantitative RT–PCR (qRT–PCR) analysis of Bmi1, p16INK4a, ARF and p15INK4b mRNA expression in total heart cells from Bmi1fl;NkxCre (Bmi1-knock out) mice. Data are standardized to β-actin levels and are expressed relative to Bmi1f/ (Control) mice (means±s.d.; n=12, *P<0.05; Student’s t-test). (c) HW/BW ratio in 22-week-old Bmi1fl;NkxCre mice and Bmi1f/ controls (means±s.d.; n=12, *P<0.05; Student’s t-test). (d) Gross cardiac phenotype of 22-week-old Bmi1fl;NkxCre mice and Bmi1f/ controls. Representative views are shown of external anatomy (top row; bars, 0.5 cm) and haematoxylin and eosin (H&E) staining on sections in adult hearts (second row; bars, 1 mm), Masson’s trichrome staining to detect fibrosis (third row; bars, 40 μm) and left ventricular muscle sections stained with wheatgerm agglutinin (WGA; bottom row; bars, 10 μm). (e,f) Trans-thoracic M-mode echocardiographic and physiological analyses of Bmi1fl;NkxCre and Bmi1f/ mice. Panel i shows representative traces from Bmi1fl;NkxCre and Bmi1f/ mice at 7, 15 and 22 weeks of age. IVSd, diastolic interventricular septal wall thickness; LVDd, diastolic left ventricular internal dimension; LVDs, systolic left ventricular internal dimension; LVPWd, diastolic left ventricular posterior wall thickness; FS, fractional shortening of left ventricle dimension; EF, ejection fraction; LVmass, left ventricular mass. Data are means±s.d. (n=12, **P<0.001, *P<0.05; Student’s t-test). (g) Representative images of whole lungs from 12-week-old Bmi1fl;NkxCre mice and Bmi1f/ littermates. Scale bars, 5 mm. (h) Thoracic magnetic resonance MRI of similar mice in transverse view, showing both heart and lungs (left), and in the coronal view (right). Scale bars, 2.5 mm. (i) Representative Perls iron staining of lung sections from mice as in g, h (bars, 30 μm). (j) Kaplan–Meier survival curve for Bmi1fl;NkxCre mice and Bmi1f/ littermates (means±s.d., P<0.001; Student’s t-test).
Figure 2
Figure 2. Bmi1 activation blocks development of cardiac hypertrophy.
(a) Gross cardiac phenotype of Bmi1flMHCCre mice and Bmi1fl controls. Representative views are shown of external anatomy and H&E staining on sections in adult hearts (12-week-old; top two rows; bars, 50 mm), Masson’s trichrome staining to detect fibrosis (third row; bars, 40 μm) and left ventricular muscle sections stained with WGA to detect cardiomyocyte borders (bottom row; bars, 10 μm). (b) M-mode echocardiographic analysis of Bmi1flMHCCre and Bmi1fl mice. IVSd, diastolic interventricular septal wall thickness; LVDd, diastolic left ventricular internal dimension; LVDs, systolic left ventricular internal dimension; LVPWd, diastolic left ventricular posterior wall thickness; FS, fractional shortening of left ventricle dimension; EF, ejection fraction; LVmass, left ventricular mass. Data are means±s.d. (n=13, **P<0.001, *P<0.05; Student’s t-test). (c) Thoracic MRI of Bmi1flMHCCre and Bmi1fl mice in transverse view, showing both heart and lungs (top), and in coronal view (bottom). Scale bars, 2.5 mm. (d) Representative Perls iron staining of lung sections from representative 12-week-old Bmi1flMHCCre and Bmi1fl littermates (bars, 30 μm). (e) Lung weight in 12-week-old Bmi1f/fMHCTM-Cretg/+ and Bmi1+/+MHCTM-Cretg/+ mice (means±s.d.; n=10, *P<0.05; Student’s t-test). (f) Kaplan–Meier survival curve for Bmi1flMHCCre mice and Bmi1fl littermates (means±s.d.**P<0.001; Student’s t-test).
Figure 3
Figure 3. Cardiac dysfunction in tamoxifen-treated Bmi1f/f;αMHCTM-Cretg/+mice.
(a) qRT–PCR analysis of the mRNA expression of Bmi1, p16INK4a, ARF and p15INKb in total heart cells from Bmi1fl;αMHCCreTM (Bmi1-KO) and αMHCCreTM (Control) mice. Data are standardized to β-actin levels and are expressed relative to Control mice (means±s.d.; n=9, *P<0.05; Student’s t-test). (b) HW/BW ratio in Bmi1fl;αMHCCreTM mice and αMHCCreTM controls mice at 22 weeks post induction (27 weeks old; means±s.d.; n=10, *P<0.05; Student’s t-test). (c) Gross cardiac phenotype of Bmi1fl;αMHCCreTM mice and αMHCCreTM controls at 22 weeks post induction (27 weeks old). Representative views are shown of external anatomy (bar, 50 mm), Masson’s trichrome staining to detect fibrosis (bars, 40 μm), left ventricular muscle sections stained with WGA to detect cardiomyocyte borders (bars, 10 μm). (d,e) Trans-thoracic M-mode echocardiographic and physiological analyses of Bmi1fl;αMHCCreTM and αMHCCreTM mice at 8, 12 and 22 weeks post induction. Panel e shows representative traces. Panel g shows echocardiographic measurements and physiological parameters. IVSd, diastolic interventricle septal wall thickness; LVDd, diastolic left ventricle internal dimension; LVDs, systolic left ventricle internal dimension; LVPWd, diastolic left ventricle posterior wall thickness; FS, fractional shortening of left ventricle dimension; EF, ejection fraction; LVmass, left ventricle mass. Data are means±s.d.; n=12, **P<0.001, *P<0.05; Student’s t-test. (f) Thoracic MRI of representative 12-week-old Bmi1fl;αMHCCre mice and Bmi1f/f littermates in transverse view, showing both heart and lungs (top), and in coronal view (bottom). Scale bars, 2.5 mm. (g) Lung weight in Bmi1fl;αMHCCreTM mice and αMHCCreTM controls at 22 weeks post induction (27 weeks old; means±s.d.; n=10, *P<0.05; Student’s t-test). (h) Representative Perls iron staining of lung sections from representative 12-week-old Bmi1fl;αMHCCre mice and Bmi1f/f littermates (bars, 30 μm). (i) Kaplan–Meier survival curve for Bmi1fl;αMHCCre mice and Bmi1f/f littermates (means±s.d. **P<0.001; Student’s t-test).
Figure 4
Figure 4. Bmi1 activation blocks development of cardiac hypertrophy.
(a) mRNA levels of Bmi1 in heart samples from nontransgenic control mice (iBmi1tg/tg) and Bmi1 transgenic mice (iBmi1tg/tg;MLC2tg/+; means±s.d.; n=8, *P<0.05; Student’s t-test). (b) HW/BW ratios in iBmi1tg;MLC2 mice and iBmitg littermates 4 weeks after the TAC surgery or sham operation. Data are means±s.d.; n=8 mice per group (means±s.d.; n=6, *P<0.05; Student’s t-test). (c,d) Left ventricular wall thickness and fractional shortening measured using echocardiography in the same hearts as in b. (e) Representative low-magnification views of H&E-stained cross-sections at the midventricle from nontransgenic and Bmi1 transgenic mice subjected to sham or TAC treatment and stained with WGA (top; scale bars, 10 μm) or Masson’s trichrome to detect fibrosis (bottom; scale bars, 40 μm).
Figure 5
Figure 5. Control of cardiac-specific profile by Bmi1.
(a) Representative heat maps show the expression of genes with fetal cardiac programme-related genes, senescence-associated and cell-cycle functional annotations that are significantly down- and upregulated in Bmi1f/f;αMHCTM-Cretg/+ (mDCM) and control heart cells (mControl), and hDCM and hControl. The rows correspond to genes and the columns to samples. Gene expression values (relative to the mean expression in control cells) are indicated on a log2 scale according to a colour scheme shown. (b) ChIP analyses of the promoter regions in the indicated genes from total heart cells from Bmi1f/f;αMHCTM-Cretg/+ mice and littermate controls. Chromatin-bound DNA was probed with antibodies to Bmi1, H3K27me3, H2AK119 and H3K4me3. Percentages of input DNA are shown as the means±s.d. of triplicate independent experiments (*P<0.05; Student’s t-test; Student’s t-test).
Figure 6
Figure 6. Bmi1-mediated cardiomyocyte senescence.
(a) Cytochemical staining of SA-β-gal activity and immunostaining of Caspase 3 in paraffin sections of hearts from 15-week-old Bmi1f/f;αMHC-Cretg/+ mice and Bmi1f/ controls. Bars, 50 μm. (b) qRT–PCR analysis of Bmi1 mRNA expression in sorted populations of CMs, endothelial cells (ECs) and FBs from Bmi1f/f;αMHC-Cretg/+ and Bmi1f/ mice. Expression is standardized to β-actin and is expressed relative to the level in Bmi1f/ mice (means±s.d.; n=12, *P<0.05; Student’s t-test). (c) Proliferation rate of CM, EC and FB subpopulations measured by in vivo BrdU incorporation over 1 week. Values are means±s.d. (n=5). (d,e) Representative histograms for C12-fluorescein show the relative levels of SA-β-gal in CM, EC and FB subsets from Bmi1f;αMHCCre and control mice (d); the values above the peaks are the median fluorescence intensities of the respective populations. (e) Percentage of SA-β-gal-positive cells in CM, EC and FB subpopulations. Values are means±s.d. (n=6, *P<0.05; Student’s t-test). (f) qRT–PCR analysis of the expression of Bmi1, p16INK4a, Ezh2, Myh7, Tgfβ, p53 and p21 mRNA in total heart cells from Bmi1fl/fl;αMHC-Cretg/+;p16INK4a−/− mice and Bmi1fl/fl;αMHC-Cre+/+;p16INK4a−/− mice. Values are means±s.d.; n=10 (**P<0.001, *P<0.05; Student’s t-test). (g) The gross cardiac phenotype of 12-week-old Bmi1fl/fl;αMHC-Cre+/+;p16INK4a−/− (Bmi1fl;p16−/−), Bmi1fl/fl;αMHC-Cretg/+;p16INK4a+/+ (Bmi1fl;αMHCCre) and Bmi1fl/fl;αMHC-Cretg/+;p16INK4a−/− (Bmi1fl;αMHCCre;p16−/−) mice. Representative views are shown of H&E-stained heart cross-sections at the midventricle (bars, 1 mm), Masson’s trichrome staining of left ventricle to detect fibrosis (bars, 40 μm) and WGA staining to outline cardiomyocytes (bars, 10 μm). (hk) HW/BW ratios (h), myocyte cross-sectional area (i), left ventricular wall thickness (j) and fractional shortening (k) in 12-week-old Bmi1fl;p16−/−, Bmi1fl;αMHCCre and Bmi1fl;αMHCCre;p16−/− mice. Data are means±s.d. n=8 mice per group (*P<0.05; Student’s t-test). (l) Cytochemical staining of SA-β-gal activity in paraffin sections of hearts from Bmi1fl;p16−/−), Bmi1fl;αMHCCre) and Bmi1fl;αMHCCre;p16−/− mice. Scale bars, 50 μm. (m,n) Representative fluorescence histograms show the relative levels of SA-β-gal in CM, EC and FB subsets from Bmi1fl;p16−/− and Bmi1fl;αMHCCre;p16−/− hearts (m); the values above the peaks are the median fluorescence intensities of the respective populations. Percentage of SA-β-gal-positive cells in CM, EC and FB subpopulations (n). Values are means±s.d. (n=6; Student’s t-test). (o) Kaplan–Meier survival curves for Bmi1fl;p16−/−, Bmi1fl;αMHCCre and Bmi1fl;αMHC-Cre;p16−/− littermates (means±s.d., **P<0.001; Student’s t-test).
Figure 7
Figure 7. Paracrine senescence response of Bmi1-related DCM does not transmit to healthy mice.
(a) Parabiotic pairings; no-DCM as Bmi1fl mice and DCMhigh as Bmi1fl/fl;αMHC-Cre mice. Comparisons were always made with littermate pairs (no-DCM to no-DCM or DCMhigh to DCMhigh). (b) The gross cardiac phenotype of 12-week-old mice after 4 weeks of parabiosis as indicated. Representative views are shown of H&E-stained cross-sections at the midventricle (bars, 1 mm), Masson’s trichrome staining of left ventricle to detect fibrosis (bars, 40 μm), and WGA staining to outline cardiomyocites (bars, 10 μm). (ce) HW/BW ratio (c), myocyte cross-sectional area (d) and fractional shortening (e) after 4 weeks of parabiosis as indicated. Data are means±s.d.; n=8 mice per group (*P<0.05; Student’s t-test).
Figure 8
Figure 8. A model for the impact of cardiac-specific Bmi1 action.
(a) As aging poses the largest risk for cardiovascular disease, the cardiac Bmi1 action could be determinant to limit the heart senescence response. Our data establish the idea that the nonproliferative cardiomyocyte-related senescence phenotype can be locally propagated through the SASP.

References

    1. McNally E. M., Golbus J. R. & Puckelwartz M. J. Genetic mutations and mechanisms in dilated cardiomyopathy. J. Clin. Invest. 123, 19–26 (2013) . - PMC - PubMed
    1. Harvey P. A. & Leinwand L. A. The cell biology of disease: cellular mechanisms of cardiomyopathy. J. Cell Biol. 194, 355–365 (2011) . - PMC - PubMed
    1. Sauvageau M. & Sauvageau G. Polycomb group proteins: multi-faceted regulators of somatic stem cells and cancer. Cell Stem Cell 7, 299–313 (2010) . - PMC - PubMed
    1. Dobreva G. & Braun T. When silence is broken: polycomb group proteins in heart development. Circ. Res. 110, 372–374 (2012) . - PubMed
    1. Chang C. P. & Bruneau B. G. Epigenetics and cardiovascular development. Annu. Rev. Physiol. 74, 41–68 (2012) . - PubMed

Publication types

MeSH terms

Substances