Review
. 2015 Aug;21(8):2861-80.
doi: 10.1111/gcb.12916. Epub 2015 May 12.

Effects of climate extremes on the terrestrial carbon cycle: concepts, processes and potential future impacts

Affiliations
Review

Effects of climate extremes on the terrestrial carbon cycle: concepts, processes and potential future impacts

Dorothea Frank et al. Glob Chang Biol. 2015 Aug.

Abstract

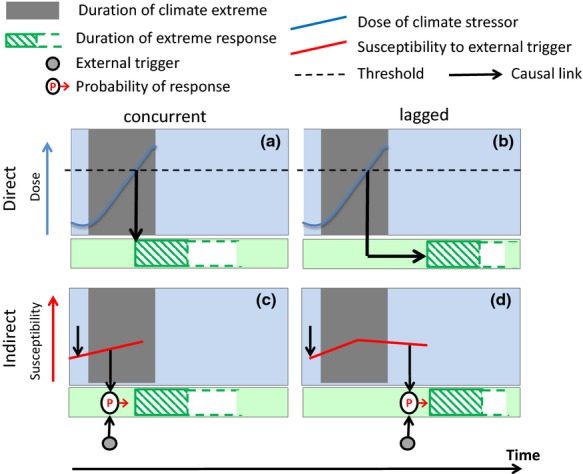
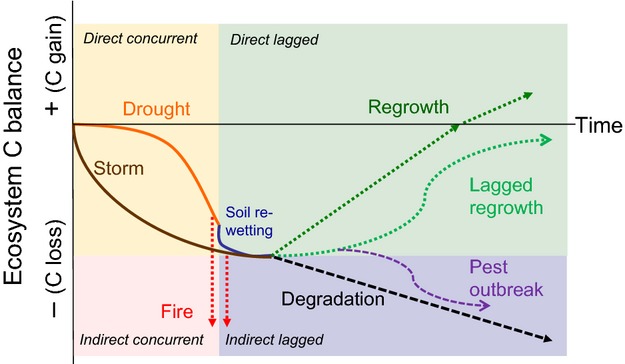
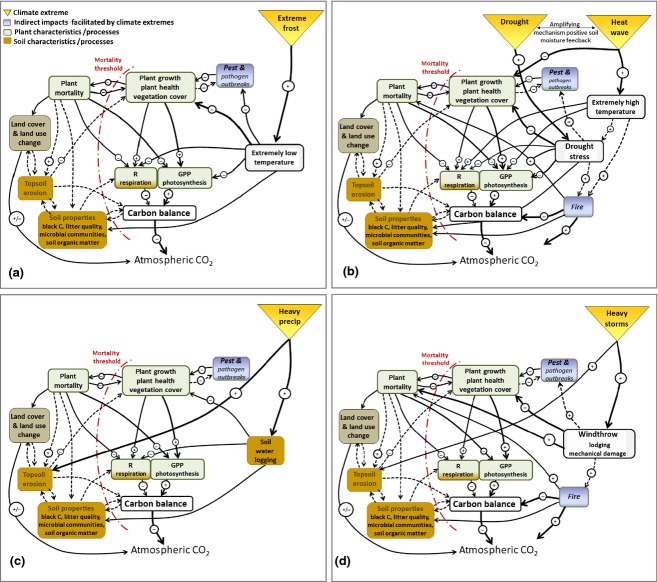
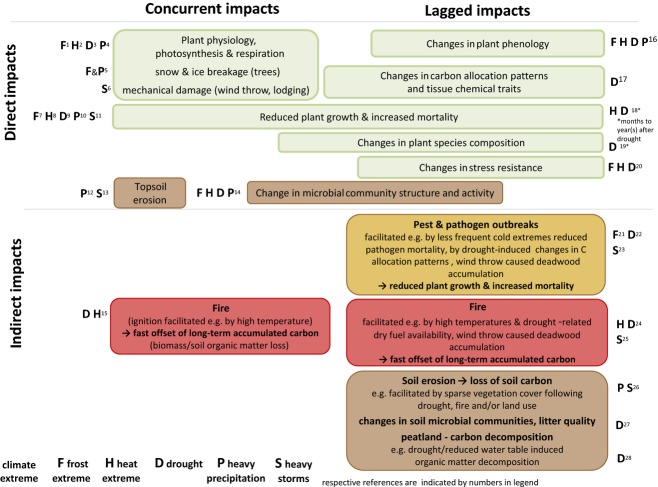
Extreme droughts, heat waves, frosts, precipitation, wind storms and other climate extremes may impact the structure, composition and functioning of terrestrial ecosystems, and thus carbon cycling and its feedbacks to the climate system. Yet, the interconnected avenues through which climate extremes drive ecological and physiological processes and alter the carbon balance are poorly understood. Here, we review the literature on carbon cycle relevant responses of ecosystems to extreme climatic events. Given that impacts of climate extremes are considered disturbances, we assume the respective general disturbance-induced mechanisms and processes to also operate in an extreme context. The paucity of well-defined studies currently renders a quantitative meta-analysis impossible, but permits us to develop a deductive framework for identifying the main mechanisms (and coupling thereof) through which climate extremes may act on the carbon cycle. We find that ecosystem responses can exceed the duration of the climate impacts via lagged effects on the carbon cycle. The expected regional impacts of future climate extremes will depend on changes in the probability and severity of their occurrence, on the compound effects and timing of different climate extremes, and on the vulnerability of each land-cover type modulated by management. Although processes and sensitivities differ among biomes, based on expert opinion, we expect forests to exhibit the largest net effect of extremes due to their large carbon pools and fluxes, potentially large indirect and lagged impacts, and long recovery time to regain previous stocks. At the global scale, we presume that droughts have the strongest and most widespread effects on terrestrial carbon cycling. Comparing impacts of climate extremes identified via remote sensing vs. ground-based observational case studies reveals that many regions in the (sub-)tropics are understudied. Hence, regional investigations are needed to allow a global upscaling of the impacts of climate extremes on global carbon-climate feedbacks.

Keywords: carbon cycle; climate change; climate extremes; climate variability; disturbance; terrestrial ecosystems.


Figures

Figure 1
Figure 1
Schematic diagram illustrating direct concurrent and lagged (a, b) and indirect concurrent and lagged (c, d) impacts of climate extremes and corresponding extreme ecosystem responses. In the direct case, the extreme impact occurs if (and only if) a threshold is reached, that is a critical dose (blue line) is passed. In the indirect case, the climate extreme increases the susceptibility (red line) to an external trigger (climatic or nonclimatic, extreme or not extreme). The likelihood as a function of the trigger and the susceptibility is indicated with the symbol ‘P’ in the circle. Concurrent responses start during the climate extreme, but may last longer for indefinite time (dashed extensions of green boxes). Lagged responses only happen after the climate extreme. The responses can be of different nonlinear shapes as indicated in Fig.2.
Figure 2
Figure 2
Hypothesized temporal dynamics of direct and indirect concurrent and lagged effects of climate extremes (e.g. drought/heat wave; storm) and of ecosystem recovery on the ecosystem carbon balance. (Note that for simplicity regrowth after fire and pest outbreaks are not shown in this figure). Line colours correspond to the colour of the climate extreme in the figure.
Figure 3
Figure 3
Processes and mechanisms underlying impacts of climate extremes on the carbon cycle. Positive/enhancing impacts with a ‘+’ and negative/reducing impacts with a ‘−’sign; predominant (in-)direct impacts (dashed) arrows (for further details please see text); importance of impact/relationship is shown by arrow width (high = thick, low = thin) (modified after Reichstein et al., 2013).
Figure 4
Figure 4
Schematic overview of concurrent, lagged, direct and indirect impacts of climate extremes on processes underlying ecosystem carbon dynamics. Respective references (selection of examples) are indicated as followed: 1 Larcher (2003) and Mayr et al. (2007); 2 Larcher (2003), Schulze et al. (2005), Lobell et al. (2012), Porter & Semenov (2005) and Niu et al. (2014); 3 Larcher (2003), Bréda et al. (2006), Keenan et al. (2010), Reichstein et al. (2007), Misson et al. (2010), Schwalm et al. (2010) and Eamus et al. (2013); 4 Rosenzweig et al. (2002), Vervuren et al. (2003), Kreuzwieser et al. (2004) and van der Velde et al. (2012); 5 Nykänen et al. (1997), Irland (2000), Changnon (2003), Hao et al. (2011) and Sun et al. (2012); 6 Berry et al. (2003), Fuhrer et al. (2006), MCPFE (2007), Lindroth et al. (2009), Zeng et al. (2009) and Negrón-Juárez et al. (2010b); 7 Larcher (2003), Schulze et al. (2005), Dittmar et al. (2006) and Bokhorst et al. (2009); 8 Larcher (2003), Porter & Semenov (2005), Bréda et al. (2006) and Lobell et al. (2012); 9 Barber et al. (2000), Eilmann et al. (2011), Fuhrer et al. (2006), Phillips et al. (2009), Michaelian et al. (2011), McDowell et al. (2013) and Peñuelas et al. (2013); 10 Vervuren et al. (2003) and Posthumus et al. (2009); 11 MCPFE (2007), Chambers et al. (2007), Zeng et al. (2009) and Negrón-Juárez et al. (2010a,b); 12 Fuhrer et al. (2006), Hilton et al. (2008) and García-Ruiz et al. (2013); 13 Wang et al. (2006) and Shinoda et al. (2011); 14 Jentsch et al. (2011) and Fuchslueger et al. (2014); 15 Moriondo et al. (2006) and Ganteaume et al. (2013); 16 Porter & Semenov (2005), Jentsch et al. (2009), Misson et al. (2011), Nagy et al. (2013) and Peñuelas et al. (2013); 17 Bréda et al. (2006), McDowell et al. (2008, 2011, 2013) and Walter et al. (2012); 18 Bréda et al. (2006), Adams et al. (2009), Allen et al. (2010), Michaelian et al. (2011), McDowell et al. (2008, 2011) and Granda et al. (2013); 19 Kreyling et al. (2011), Suarez & Kitzberger (2008) and Diez et al. (2012); 20 Larcher (2003) and Walter et al. (2013); 21 Virtanen et al. (1998), Stahl et al. (2006), Robinet & Roques (2010) and Kausrud et al. (2012); 22 Bréda et al. (2006), Desprez-Loustau et al. (2006), Rouault et al. (2006), MCPFE (2007), McDowell et al. (2008, 2011), Jactel et al. (2012), Keith et al. (2012), Kausrud et al. (2012) and Walter et al. (2012); 23 Schlyter et al. (2006), MCPFE (2007) and Komonen et al. (2011); 24 Trigo et al. (2006) and Wendler et al. (2011); 25 Kurz et al. (2008a); 26 Øygarden (2003), Valentin et al. (2008) and Thothong et al. (2011); 27 Sheik et al. (2011), Yuste et al. (2011) and, Fuchslueger et al. (2014); 28 Sowerby et al. (2008).
Figure 5
Figure 5
Global distribution of extreme events in the terrestrial carbon cycle, and approximate geographical locations of published climate extremes with impacts on the carbon cycle. Extreme events in the carbon cycle are defined as contiguous regions of extreme anomalies of GPP during the period 1982–2011 (modified after Zscheischler et al., 2014b). Colour scale indicates the average reduction in gross carbon uptake compared to a normal year due to negative extremes in GPP. Units are gram carbon per square metre per year. The map highlights the IPCC regions with the following references to the published climate extremes. References: 1 pest outbreaks Canada/North America (Soja et al., ; Kurz et al., 2008b), 2 ice storm North America (Irland, 2000), 3 drought US (Breshears et al., ; Schwalm et al., 2012), 4 heavy storm Southern US (Chambers et al., ; Zeng et al., ; Negrón-Juárez et al., 2010a), 5 heavy storm Amazon (Negrón-Juárez et al., 2010b), 6 drought Amazon (Tian et al., ; Phillips et al., ; Lewis et al., 2011), 7 heavy storm Europe (Fuhrer et al., ; Lindroth et al., 2009), 8 drought and heat extreme Europe (Ciais et al., ; Reichstein et al., 2007), 9 extreme drought, heat and fire in Russia (Barriopedro et al., ; Konovalov et al., ; Coumou & Rahmstorf, ; Bastos et al., 2013a), 10 ice storm China (Stone, ; Sun et al., 2012)), 11 fire, drought SE Asia (Page et al., ; Schimel & Baker, 2002), 12 drought Australia (Haverd et al., 2013), 13 heavy precipitation Australia (Bastos et al., ; Haverd et al., 2013), 14 heavy precipitation Southern Africa (Bastos et al., 2013b).

References

    1. Adams HD, Guardiola-Claramonte M, Barron-Gafford GA, et al. Temperature sensitivity of drought-induced tree mortality portends increased regional die-off under global-change-type drought. Proceedings of the National Academy of Sciences of the United States of America. 2009;106:7063–7066. - PMC - PubMed
    1. Albertson FW, Tomanek GW, Andrew Riegel A. Ecology of drought cycles and grazing intensity on grasslands of central great plains. Ecological Monographs. 1957;27:27–44.
    1. Aldersley A, Murray SJ, Cornell SE. Global and regional analysis of climate and human drivers of wildfire. Science of the Total Environment. 2011;409:3472–3481. - PubMed
    1. Allard V, Ourcival J-M, Rambal S, Joffre R, Rocheteau A. Seasonal and annual variation of carbon exchange in an evergreen Mediterranean forest in southern France. Global Change Biology. 2008;14:714–725.
    1. Allen CD, Macalady AK, Chenchouni H, et al. A global overview of drought and heat-induced tree mortality reveals emerging climate change risks for forests. Forest Ecology and Management. 2010;259:660–684.

Publication types

LinkOut - more resources