. 2015 Apr;25(4):582-97.
doi: 10.1101/gr.185272.114. Epub 2015 Mar 9.

The pluripotent regulatory circuitry connecting promoters to their long-range interacting elements

Affiliations

The pluripotent regulatory circuitry connecting promoters to their long-range interacting elements

Stefan Schoenfelder et al. Genome Res. 2015 Apr.

Abstract

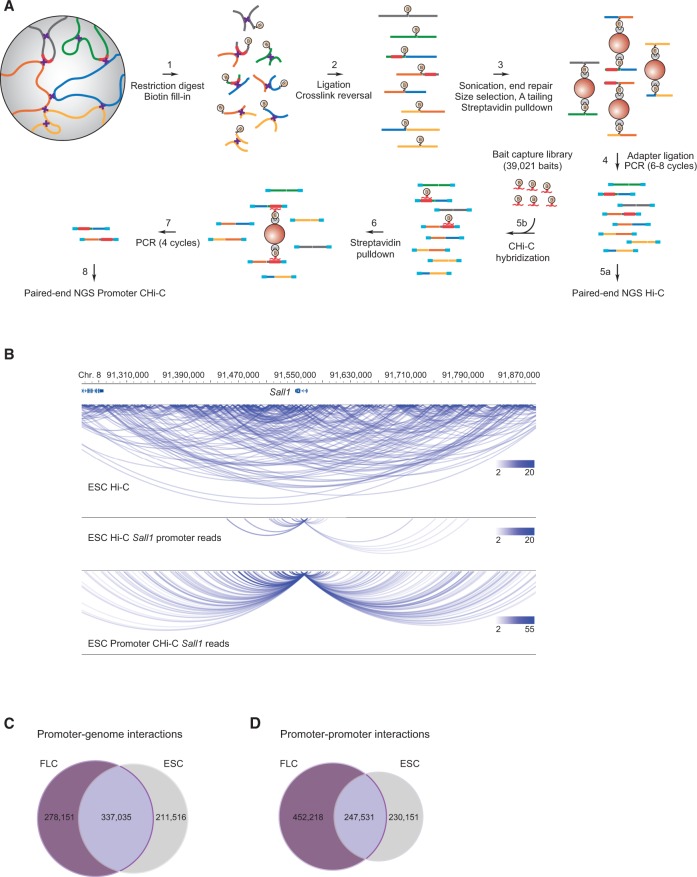
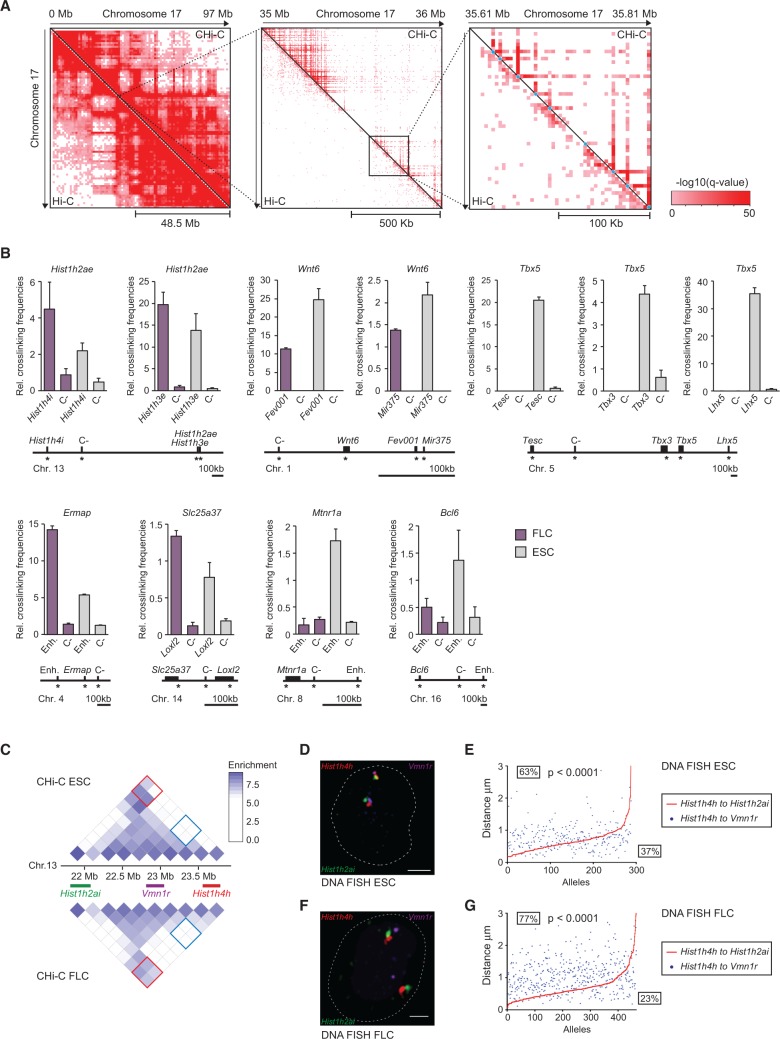
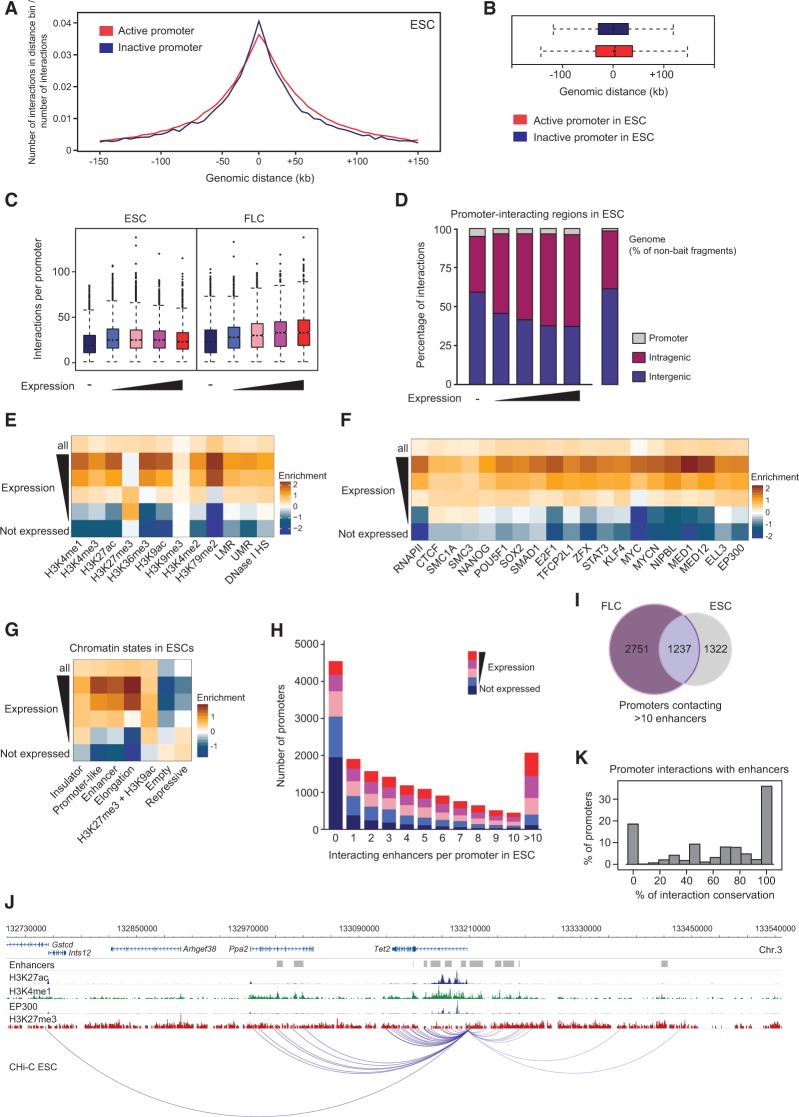
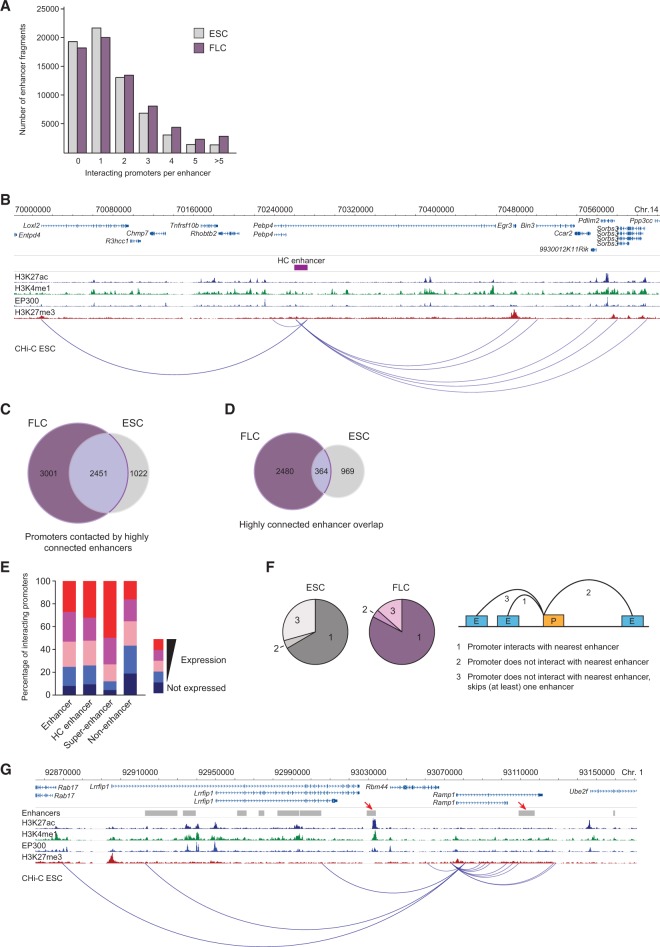
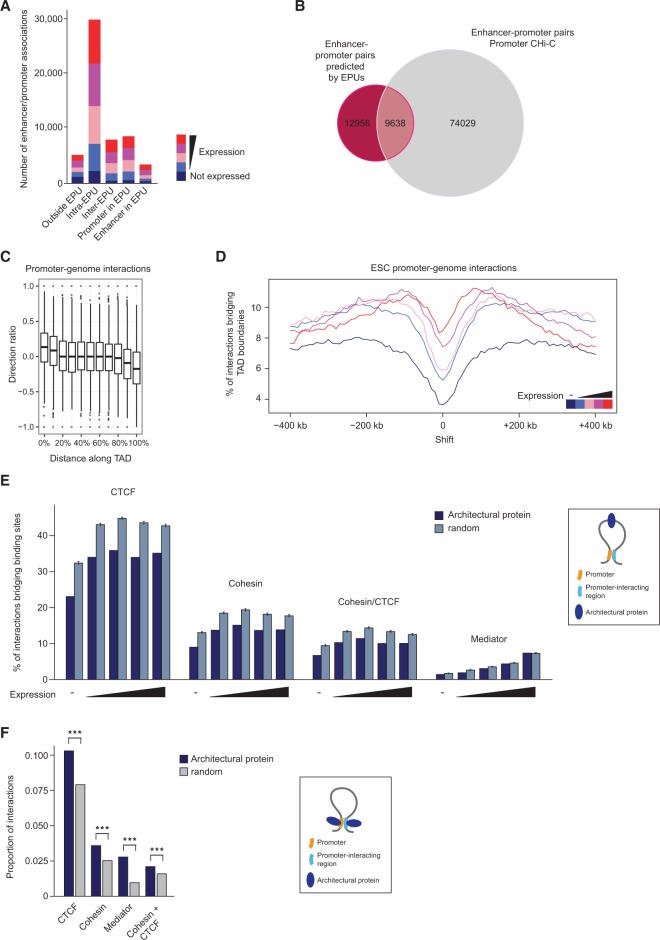
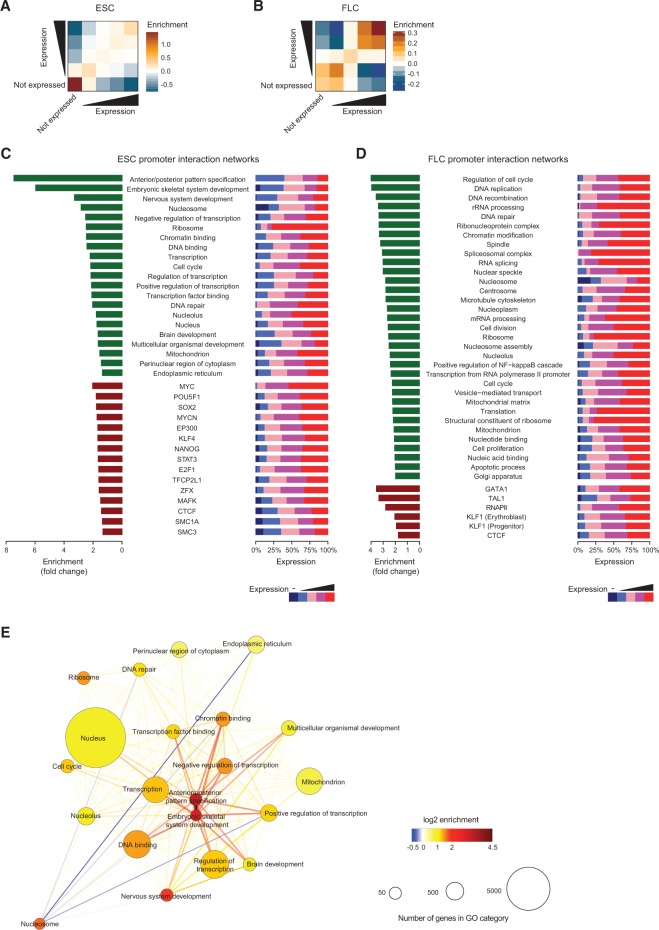
The mammalian genome harbors up to one million regulatory elements often located at great distances from their target genes. Long-range elements control genes through physical contact with promoters and can be recognized by the presence of specific histone modifications and transcription factor binding. Linking regulatory elements to specific promoters genome-wide is currently impeded by the limited resolution of high-throughput chromatin interaction assays. Here we apply a sequence capture approach to enrich Hi-C libraries for >22,000 annotated mouse promoters to identify statistically significant, long-range interactions at restriction fragment resolution, assigning long-range interacting elements to their target genes genome-wide in embryonic stem cells and fetal liver cells. The distal sites contacting active genes are enriched in active histone modifications and transcription factor occupancy, whereas inactive genes contact distal sites with repressive histone marks, demonstrating the regulatory potential of the distal elements identified. Furthermore, we find that coregulated genes cluster nonrandomly in spatial interaction networks correlated with their biological function and expression level. Interestingly, we find the strongest gene clustering in ES cells between transcription factor genes that control key developmental processes in embryogenesis. The results provide the first genome-wide catalog linking gene promoters to their long-range interacting elements and highlight the complex spatial regulatory circuitry controlling mammalian gene expression.


Figures

Figure 1.
Figure 1.
Promoter capture Hi-C. (A) Experimental strategy: Hi-C libraries were either directly interrogated by massively parallel paired-end sequencing (step 5a) or subjected to promoter CHi-C (steps 5b–8). For promoter CHi-C, the Hi-C library is hybridized to the RNA capture library (“bait”) in solution, followed by streptavidin pulldown of Hi-C library ligation products containing promoters targeted by the biotin-RNA baits (22,225 promoters in the mouse genome). The resulting promoter CHi-C library is analyzed by massively parallel paired-end sequencing. Chromosomal regions are depicted in blue, green, gray, orange, and yellow; promoters are depicted in red; and sequencing adapters in light blue. Biotin moieties are symbolized by an encircled “B,” and formaldehyde crosslinks are represented by purple crosses. RNA bait molecules are represented by red fragments connected to a biotin moiety. (B) The chromosomal interactome of the Sall1 locus in ESCs. Shown are unfiltered read pairs from Hi-C data for a 0.6-Mb region containing the Sall1 gene (top), Sall1 promoter-contacting read pairs from the same Hi-C data (middle), and Sall1 promoter-contacting read pairs from promoter CHi-C (lower). Hi-C and CHi-C data sets were adjusted to the same number of overall sequence reads. Interactions are displayed using the WashU EpiGenome Browser (Zhou et al. 2013). (C) Unique and shared promoter–genome significant interactions after GOTHiC filtering in ESCs and FLCs. (D) Unique and shared promoter–promoter significant interactions after GOTHiC filtering in ESCs and FLCs.
Figure 2.
Figure 2.
Validation of promoter interactions. (A) Hi-C and promoter CHi-C contact maps after GOTHiC filtering for significant interactions: whole chromosome view of mouse Chromosome 17 (left), and 1-Mb (middle) and 200-kb subregions (right) encompassing the Pou5f1 gene locus. Individual promoter bait restriction fragments are marked by light blue dots in the right panel. Color intensity corresponds to the significance of the interaction, −log10(q-value) from GOTHiC. (B) Validation of CHi-C results by 3C-qPCR. Graphs showing the relative crosslinking frequencies of promoter restriction fragments (top) with another promoter, putative enhancer (Enh) or control, noninteracting fragments (C-), as depicted in the graphs and the maps below. Interactions identified by promoter CHi-C present in both cell types (Hist1h2ae), preferential in ESCs (Wnt6, Tbx5, Mtnr1a, Bcl6), or preferential in FLCs (Ermap, Slc25a37) are shown. Control fragments (C-) were identified as noninteracting, or interacting at lower frequencies by CHi-C, compared to the interacting fragments in the respective cell type. Asterisks denote the position of the primers used in 3C-qPCR. (CG) Validation of CHi-C results by triple-label 3D DNA FISH. (C) Promoter CHi-C contact maps for a ∼2-Mb region on mouse Chromosome 13 in ESCs (top) and FLCs (below), encompassing the Hist1h2ai, Vmn1r, and Hist1h4h loci as shown. Contact enrichment between Hist1h4h and Vmn1r loci are marked by blue squares on the contact maps, and contact enrichment between Hist1h4h and Hist1h2ai are marked by red squares. (D) and (F) Representative triple-label 3D DNA FISH in ESCs (D) and FLCs (F), DNA FISH signals for the Hist1h2ai locus (green), the Vmn1r locus (purple), and the Hist1h4h locus (red). Scale bar, 2 μm. (E) and (G) Interprobe distance measurements of triple-label 3D DNA FISH in ESCs (E) and FLCs (G). Shown are the ranked interprobe distances between Hist1h4h and Hist1h2ai (red line) with the corresponding interprobe distance between Hist1h4h and Vmn1r (blue dots) per allele. Percentages above the red line indicate the frequency at which the distance between Vmn1r and Hist1h4h is greater than the distance between Hist1h2ai and Hist1h4h, whereas percentages below the line indicate the frequency at which the distance between Vmn1r and Hist1h4h is less than the distance between Hist1h2ai and Hist1h4h. P-values: χ2 test comparing the distance distributions between Vmn1r and Hist1h4h to the distance between Hist1h2ai and Hist1h4h.
Figure 3.
Figure 3.
Hallmarks of promoter-interacting regions. (A) Composite profile showing the proportion of promoter–genome interactions for 5-kb distance bins upstream of and downstream from the transcription start sites for active (red) and inactive (blue) promoters in ESCs. (B) Genomic range of interactions for active (red) and inactive (blue) promoters in ESCs. (C) Number of promoter–genome interactions in ESCs and FLCs, separated by expression categories. (D) Intra- and intergenic distribution of promoter-interacting regions in ESCs, with genes driven by the promoters separated in expression categories (HindIII fragments encompassing exonic or intronic sequences are classed as “intragenic” here). The distribution of intragenic and intergenic sequences in the mouse genome is shown on the right. (EG) Heat maps showing the enrichment/depletion for histone modifications (E), chromatin proteins (F), and chromatin states (G) in promoter-interacting regions in ESCs, for all promoters and separated by expression of the interacting promoters, compared to nonbait regions. (UMR) Unmethylated region; (LMR) low-methylated region (Stadler et al. 2011). (H) Number of promoters from each expression category interacting with between zero and more than 10 genomic elements with the hallmarks of enhancers in ESCs. (I) Unique and overlapping promoters interacting with multiple (>10) enhancer-like elements in ESCs and FLCs. (J) Example of a promoter (driving the Tet2 gene) contacting multiple enhancers in ESCs. (K) Conservation of promoter–enhancer contacts between ESCs and FLCs. Shown is the percentage of promoters that share 0%, 10%, 20%, etc., of their interactions with enhancer-like elements. Only enhancers active in both cell types (ESC and FLC) have been included in the analyses.
Figure 4.
Figure 4.
Promoter-enhancer 3D circuitry. (A) Number of enhancer elements interacting with between zero and more than five promoters in ESCs and FLCs. (B) Example of highly connected (HC) enhancer (represented by purple rectangle) contacting multiple gene promoters in ESCs. (C) Numbers of unique and overlapping promoters interacting with highly connected enhancers in ESCs and FLCs. (D) Numbers of unique and overlapping highly connected enhancers in ESCs and FLCs. (E) Percentage of promoters in the separate expression categories that contact enhancers, highly connected (HC) enhancers, super-enhancers, and nonenhancer elements in ESCs. (F) Percentages of active promoters interacting with the nearest enhancer (on the linear genomic map), a more distally located enhancer, or skipping (at least) one enhancer in ESCs and FLCs, as illustrated by schematic on the right ([P] promoter; [E] enhancer). (G) Example of an active promoter (Ramp1) bypassing proximal enhancers (red arrows) in ESCs.
Figure 5.
Figure 5.
Demarcation of promoter interactions. (A) Number of interactions between promoters and enhancer elements with regard to the genomic position of enhancer promoter units (EPUs) (Shen et al. 2012) in ESCs, separated by expression categories. (B) Number of promoter–enhancer pairs predicted by EPUs (Shen et al. 2012) and promoter CHi-C. (C) Directionality of promoter–genome interactions in ESCs, relative to TAD boundaries. (D) Percentage of promoter–genome interactions bridging TAD boundaries, separated by expression categories. TAD boundary positions are set at zero and are then shifted artificially in 10-kb steps upstream and downstream. (E) Percentage of promoter interactions bridging binding sites of CTCF, cohesin (SMC1A), Mediator (MED12), and sites co-occupied by CTCF and cohesin in ESCs (as illustrated by schematic on the right) compared to randomized control sites. (F) Proportion of interactions in which the promoter and the interacting fragments are bound by the indicated proteins (CTCF, cohesin [SMC1A], Mediator [MED12], or CTCF and cohesin) in ESCs (as illustrated by schematic on the right), compared to randomized control sites.
Figure 6.
Figure 6.
Promoter–promoter interaction networks. (A,B) Enrichment of interactions between promoters from different expression categories in ESCs (A) and FLCs (B). (C) ESC promoter–promoter interaction networks. (Left) Fold enrichment of GO categories (green bars) and promoters bound by trans-acting factors (dark red bars) in ESC promoter interaction networks. (Right) Distribution of expression categories within the respective ESC promoter interaction networks. (D) FLC promoter–promoter interaction networks. (Left) Fold enrichment of GO categories (green bars) and promoters bound by trans-acting factors (dark red bars) in FLC promoter interaction networks. (Right) Distribution of expression categories within the respective FLC promoter interaction networks. (E) Connectivity between ESC promoter–promoter subnetworks categorized based on gene ontology. Circle sizes represent the numbers of genes within the respective promoter subnetwork. Color of circles represents the fold enrichment of connectivity between the members, whereas edge colors show the enrichment of connectivity between the subnetworks.

References

    1. Ahituv N, Zhu Y, Visel A, Holt A, Afzal V, Pennacchio LA, Rubin EM. 2007. Deletion of ultraconserved elements yields viable mice. PLoS Biol 5: e234. - PMC - PubMed
    1. Anguita E, Sharpe JA, Sloane-Stanley JA, Tufarelli C, Higgs DR, Wood WG. 2002. Deletion of the mouse α-globin regulatory element (HS –26) has an unexpectedly mild phenotype. Blood 100: 3450–3456. - PubMed
    1. Apostolou E, Thanos D. 2008. Virus infection induces NFKB-dependent interchromosomal associations mediating monoallelic IFN-β gene expression. Cell 134: 85–96. - PubMed
    1. Apostolou E, Ferrari F, Walsh RM, Bar-Nur O, Stadtfeld M, Cheloufi S, Stuart HT, Polo JM, Ohsumi TK, Borowsky ML, et al.2013. Genome-wide chromatin interactions of the Nanog locus in pluripotency, differentiation, and reprogramming. Cell Stem Cell 12: 699–712. - PMC - PubMed
    1. Attanasio C, Nord AS, Zhu Y, Blow MJ, Li Z, Liberton DK, Morrison H, Plajzer-Frick I, Holt A, Hosseini R, et al.2013. Fine tuning of craniofacial morphology by distant-acting enhancers. Science 342: 1241006. - PMC - PubMed

Publication types