. 2015 Mar 23;32(6):678-92.
doi: 10.1016/j.devcel.2015.01.029. Epub 2015 Mar 5.

Fatty acid trafficking in starved cells: regulation by lipid droplet lipolysis, autophagy, and mitochondrial fusion dynamics

Affiliations

Fatty acid trafficking in starved cells: regulation by lipid droplet lipolysis, autophagy, and mitochondrial fusion dynamics

Angelika S Rambold et al. Dev Cell. .

Abstract

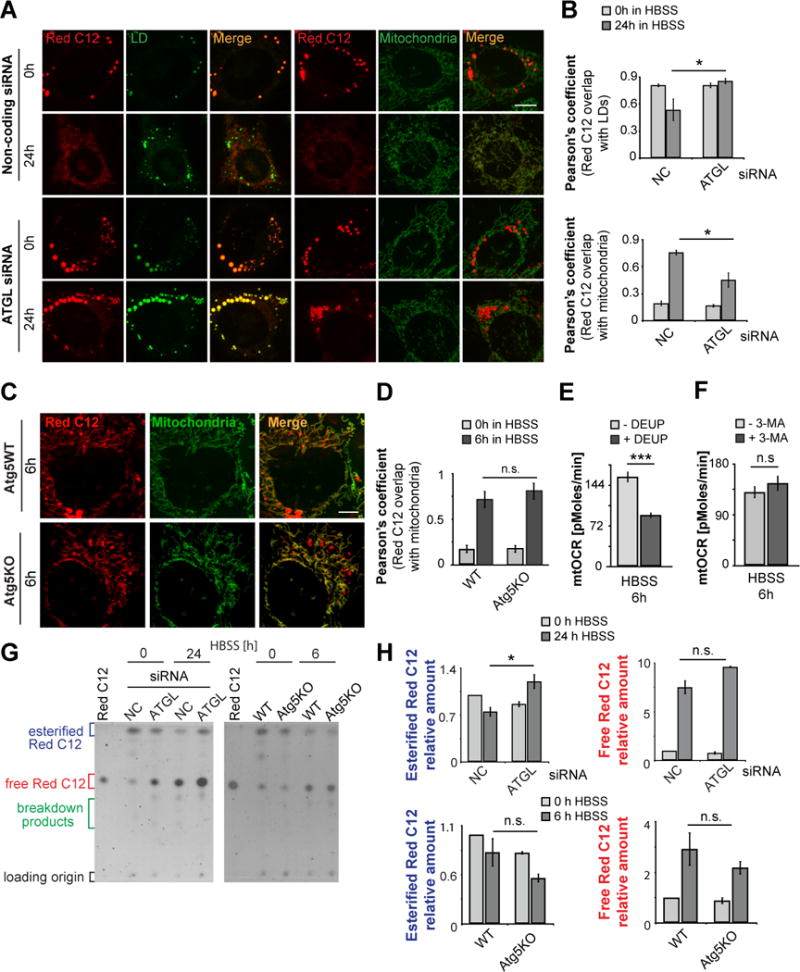
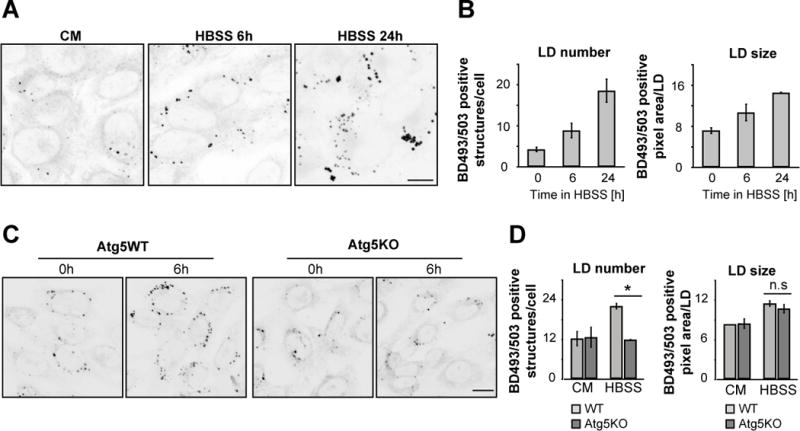
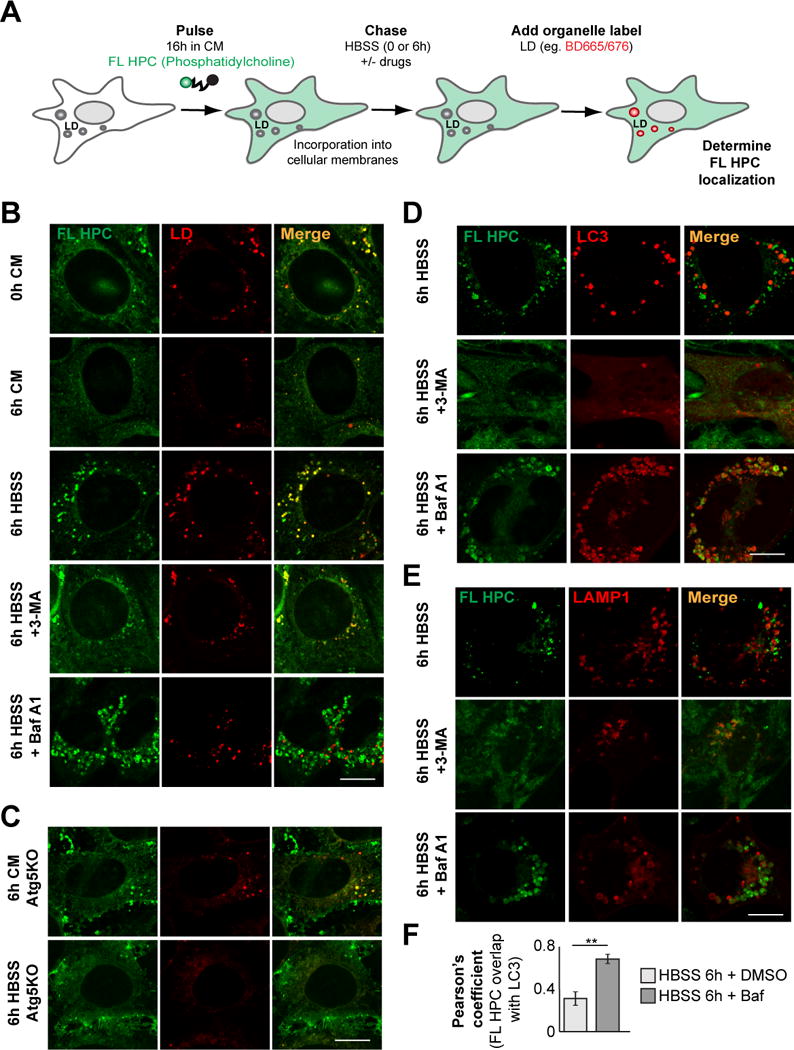
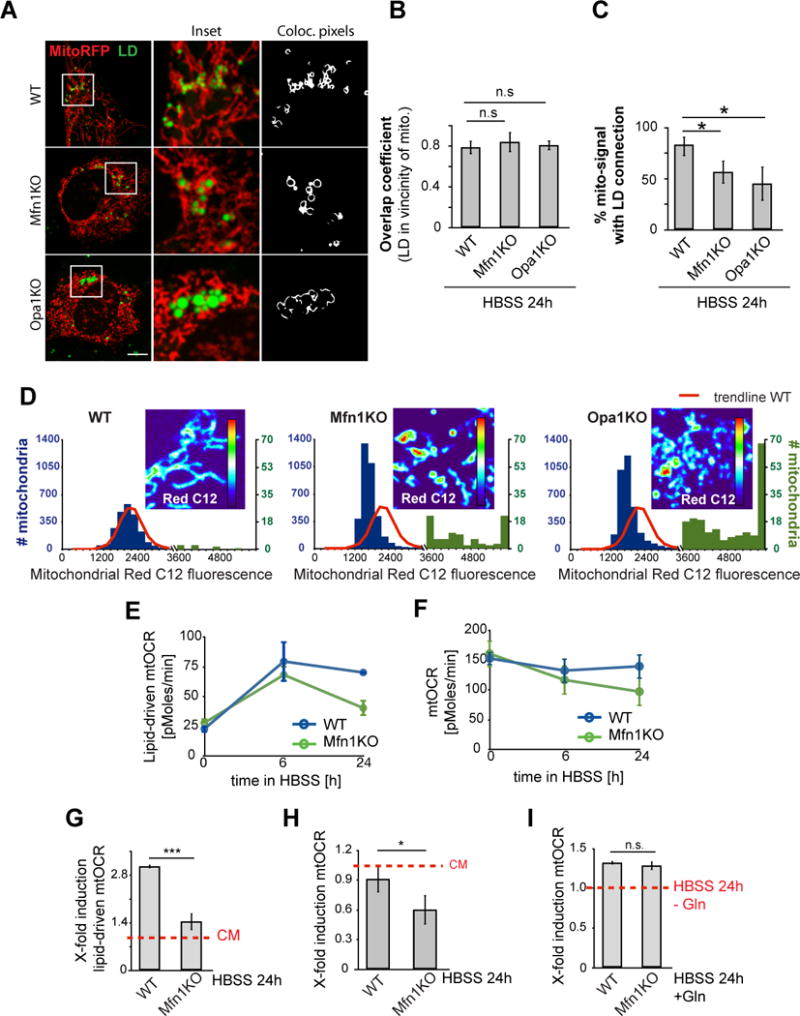
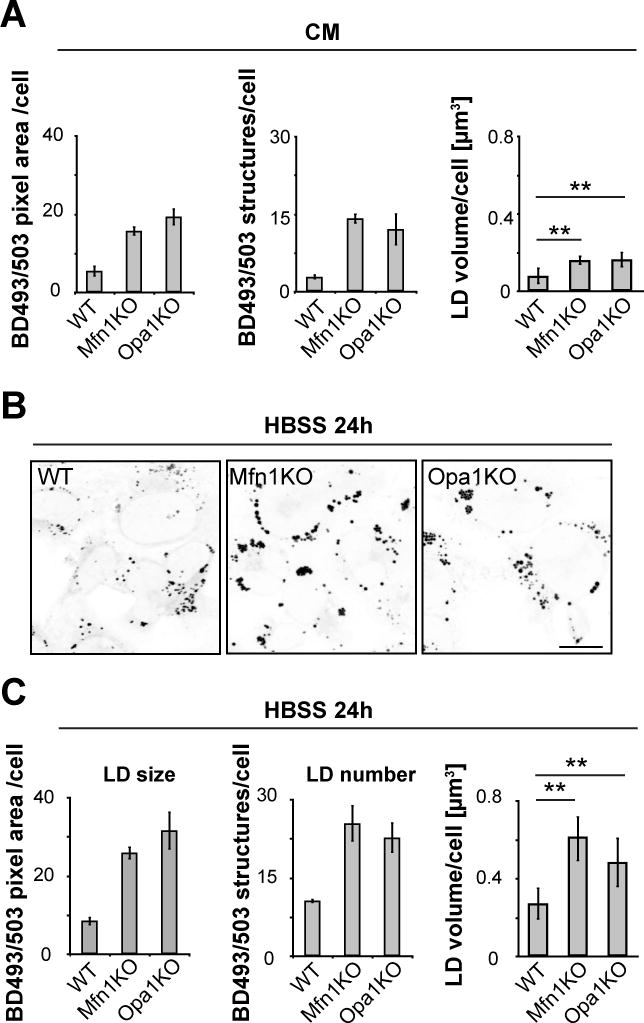
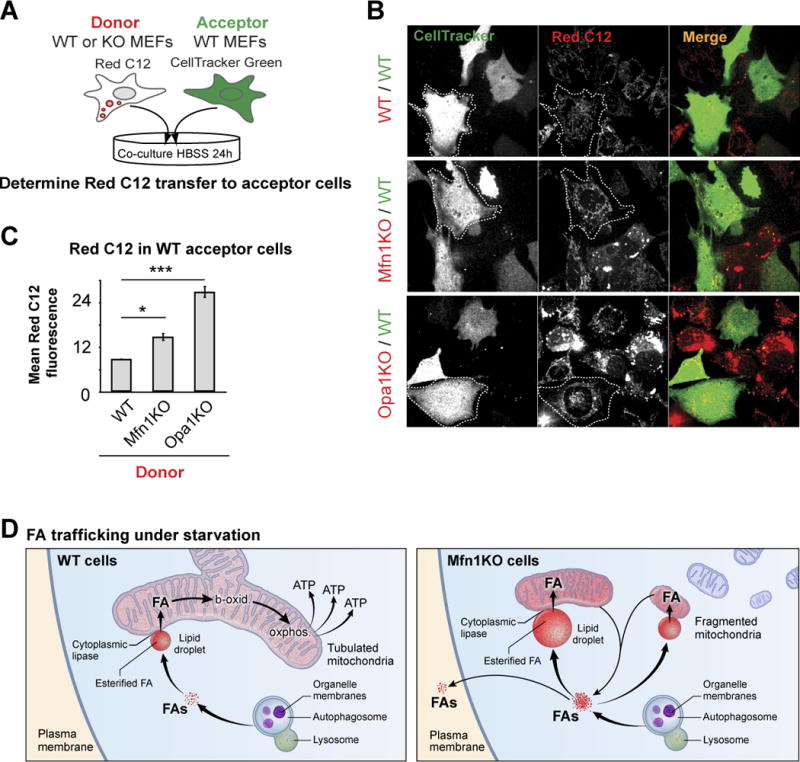
Fatty acids (FAs) provide cellular energy under starvation, yet how they mobilize and move into mitochondria in starved cells, driving oxidative respiration, is unclear. Here, we clarify this process by visualizing FA trafficking with a fluorescent FA probe. The labeled FA accumulated in lipid droplets (LDs) in well-fed cells but moved from LDs into mitochondria when cells were starved. Autophagy in starved cells replenished LDs with FAs, increasing LD number over time. Cytoplasmic lipases removed FAs from LDs, enabling their transfer into mitochondria. This required mitochondria to be highly fused and localized near LDs. When mitochondrial fusion was prevented in starved cells, FAs neither homogeneously distributed within mitochondria nor became efficiently metabolized. Instead, FAs reassociated with LDs and fluxed into neighboring cells. Thus, FAs engage in complex trafficking itineraries regulated by cytoplasmic lipases, autophagy, and mitochondrial fusion dynamics, ensuring maximum oxidative metabolism and avoidance of FA toxicity in starved cells.


Figures

Figure 1
Figure 1. Fatty acid trafficking can be visualized using a fluorescent fatty acid pulse-chase assay
(A) Schematic representation of the fluorescent FA pulse-chase assay: cells were pulsed with Red C12 overnight, washed, and incubated with CM for 1 h in order to allow the Red C12 to accumulate in LDs. Cells were then chased in CM or HBSS for the indicated periods of time and imaged to determine the subcellular localization of the FA. (B–D) WT MEFs were assayed as described in Figure 1A and chased in CM or HBSS for 0 h, 6 h, or 24 h. LDs were labeled using (B) BODIPY 493/503 and (C) mitochondria were labeled using MitoTracker Green. Scale bar, 10μm. (D) Relative cellular localization of Red C12 was quantified by Pearson’s coefficient analysis. Data were expressed as means ± SEM. (E) TLC resolving Red C12 isolated from WT MEFs assayed as described above and chased for 6 h or 24 h with HBSS in the absence or presence of etomoxir, see also Figure S1.
Figure 2
Figure 2. Cytoplasmic lipase activity, but not lipophagy are essential to liberate FAs from LDs for transfer to mitochondria
(A) WT MEFs were assayed as described in Figure 1A after RNA interference using non-coding or ATGL siRNA. Scale bar, 10μm. (B) Quantification of the correlation between Red C12 signal and LDs (upper graph) or mitochondria (lower graph) in the experiment shown in Figure 2A. (C, D) Atg5-WT and Atg5-deficient cells were assayed as described in Figure 1A. Scale bar, 10μm. (D) Quantification of the correlation between Red C12 signal and mitochondria in the experiment described in Figure 2C. (E, F) Mitochondrial respiration is dependent on cytoplasmic lipase activity. Mitochondrial respiratory activity of 6 h starved WT MEFs was measured in the presence of (E) the lipase inhibitor DEUP and (F) 3-MA to inhibit autophagy. (G) TLC resolving Red C12 isolated from cells assayed as described in Figure 2A (left panel) or 2C (right panel). (H) Relative amounts of esterified and free Red C12 were quantified from images of TLC plates, normalized to Red C12 levels of WT cells at the 0 h time point. Data were expressed as means ± SEM, see also Figure S2.
Figure 3
Figure 3. Autophagy drives LD growth during starvation
(A–D) WT or Atg5KO MEFs were incubated in CM or HBSS for the time periods indicated, BODIPY 493/503 was added to visualize LDs and images of live cells were captured and presented as inverted greyscale micrographs (A and C). To determine LD growth during starvation LD size and number were measured (B and D). Scale bars, 50 μm. Data were expressed as means ± SEM, see also Figure S3.
Figure 4
Figure 4. Autophagy mobilizes phospholipids from cellular membranes during starvation
(A, B) FL HPC loaded WT MEFs were chased in HBSS for 6 h in the absence or presence of 3-MA or Bafilomycin A1 (Baf A1) and the subcellular localization of FL HPC was determined. LDs were stained with BODIPY665/676. (C) Atg5KO MEFs were assayed as described in Figure 4B. (D, E) WT MEFs expressing mCherry-LC3 or LAMP1-mCherry were assayed as described in Figure 2B. (F) Quantification of the correlation between FL HPC signal and autophagosomes or lysosomes in the experiments described in Figure 2D and E. Data were expressed as means ± SEM, see also Figure S4.
Figure 5
Figure 5. Mitochondrial fusion is required for mitochondrial FA distribution and oxidation
(A–C) WT, Mfn1 KO or Opa1 KO MEFs were transfected with the mitochondrial marker mito-RFP and labeled with BODIPY493/503 to visualize LDs. (A) Live images were acquired, (B) the ability of LDs to gain states of high proximity to mitochondria was measured using the overlap coefficient, (C) and overall mitochondrial content with direct contact to LDs was measured. (D) Red C12 localization in WT, Mfn1 KO or Opa1 KO MEFs was assayed as described in Figure 1A (24 h HBSS). Red C12 intensities in individual mitochondria were plotted as histograms, with blue and green bars representing higher and lower ranges of intensities, respectively. Red lines: WT trendline. Representative images of mitochondrial Red C12 in each cell line were presented as heatmaps, blue: lowest, and red: highest mitochondrial Red C12 levels. Scale bars, 10 μm. (E–F) Mitochondrial respiratory activity was measured in WT and Mfn1KO MEFs, incubated in CM or HBSS for the time points indicated. (E) Lipid-driven mtOCR and (F) total mtOCR were determined. Lipid-specific respiration was analyzed by acute CPT-I inhibition with etomoxir. (G, H) Respiratory induction levels for lipid-driven mtOCR and total mtOCR levels were determined, using mtOCR levels in CM as baseline levels for each cell line. (I) Glutamine (Gln)-driven respiration was determined by acute injection of glutamine to 24 h starved cells and induction levels were determined. Data were expressed as means ± SEM, see also Figure S5.
Figure 6
Figure 6. Mitochondrial fusion deficiencies result in increased FA storage
WT, Mfn1KO and Opa1KO cells were grown in complete (A) or starvation (B, C) medium for 24h, BODIPY493/503 was added to visualize LDs, and LD size, number and volume were determined. Scale bar, 50 μm. Data were expressed as means ± SEM, see also Figure S6.
Figure 7
Figure 7. Mitochondrial fusion deficiencies result in increased cellular export of FAs
(A) Schematic representation of the co-culture assay to visualize cellular FA export. Red C12 pre-labeled donor cells (WT, Mfn1KO, or Opa1KO MEFs) were washed excessively and then co-cultured for 24 h in HBSS with CellTracker green-labeled acceptor cells (WT MEFs). (B) Live cell images of donor and acceptor cells were acquired and (C) levels of Red C12 transfer into acceptor cells measured by flow cytometry analysis. Data were expressed as means ± SEM see also Figure S7. (D) Model of FA trafficking in starved cells. In WT cells, autophagy releases FAs from phospholipids within organelle membranes; these FAs flux through LDs into tubulated mitochondria, where they become homogenously distributed throughout the mitochondrial network and are efficiently metabolized to produce ATP. In fusion-deficient Mfn1KO cells, fragmented mitochondria receive highly variable amounts of FA. These FAs are not efficiently metabolized, resulting in re-direction of FA flow, resulting in increased FA storage within LDs and efflux of FAs from the cell.

Comment in

References

    1. Axe EL, Walker SA, Manifava M, Chandra P, Roderick HL, Habermann A, Griffiths G, Ktistakis NT. Autophagosome formation from membrane compartments enriched in phosphatidylinositol 3-phosphate and dynamically connected to the endoplasmic reticulum. The Journal of cell biology. 2008;182:685–701. - PMC - PubMed
    1. Bjorkoy G, Lamark T, Brech A, Outzen H, Perander M, Overvatn A, Stenmark H, Johansen T. p62/SQSTM1 forms protein aggregates degraded by autophagy and has a protective effect on huntingtin-induced cell death. The Journal of cell biology. 2005;171:603–614. - PMC - PubMed
    1. Calder PC. Long chain fatty acids and gene expression in inflammation and immunity. Current opinion in clinical nutrition and metabolic care. 2013;16:425–433. - PubMed
    1. Cabodevilla AG, Sanchez-Caballero L, Nintou E, Boiadijieva VG, Picatoste F, Gubern A, Claro E. Cell survival during complete nutrient deprivation depends on lipid droplet-fueled b-oxidation of fatty acids. The Journal of biological chemistry. 2013;288:27777–27788. - PMC - PubMed
    1. Chen H, Chomyn A, Chan DC. Disruption of fusion results in mitochondrial heterogeneity and dysfunction. The Journal of biological chemistry. 2005;280:26185–26192. - PubMed

Publication types