. 2015 Mar 16;208(6):761-76.
doi: 10.1083/jcb.201409111. Epub 2015 Mar 9.

GGCX and VKORC1 inhibit osteocalcin endocrine functions

Affiliations

GGCX and VKORC1 inhibit osteocalcin endocrine functions

Mathieu Ferron et al. J Cell Biol. .

Erratum in

Abstract

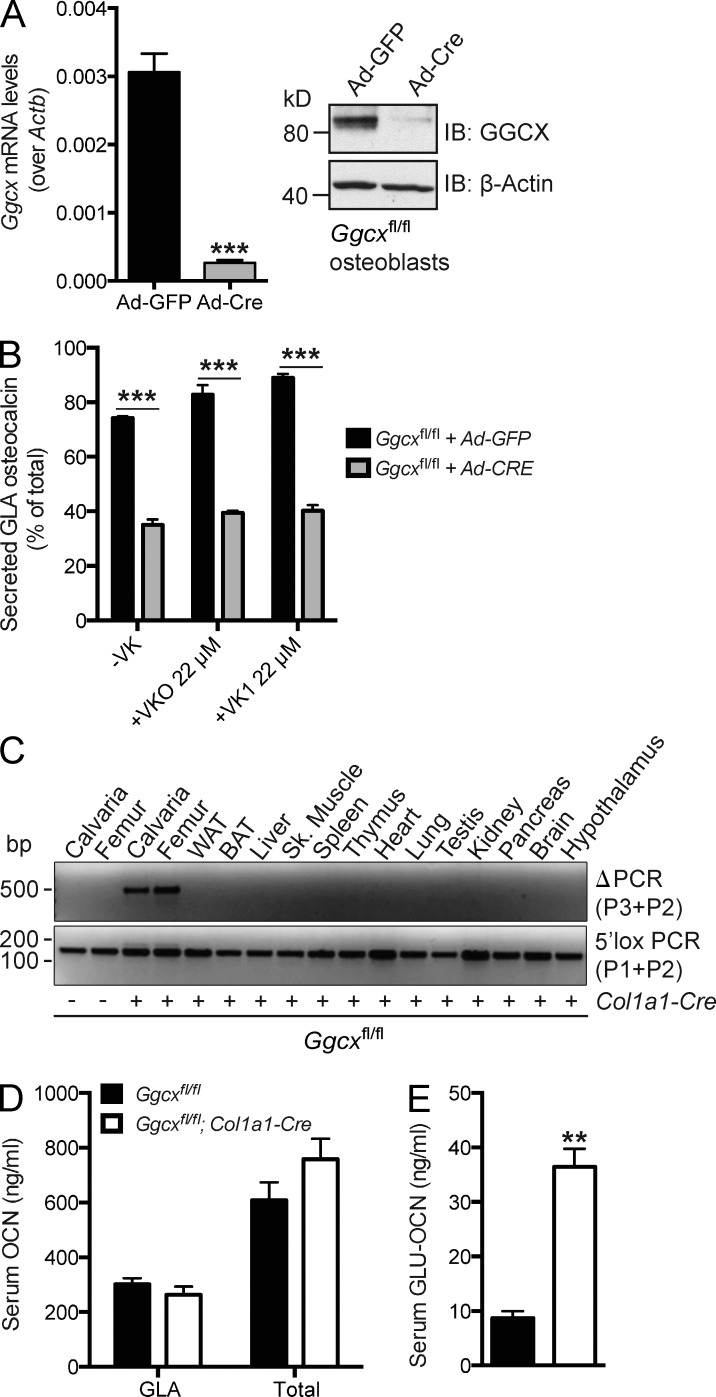
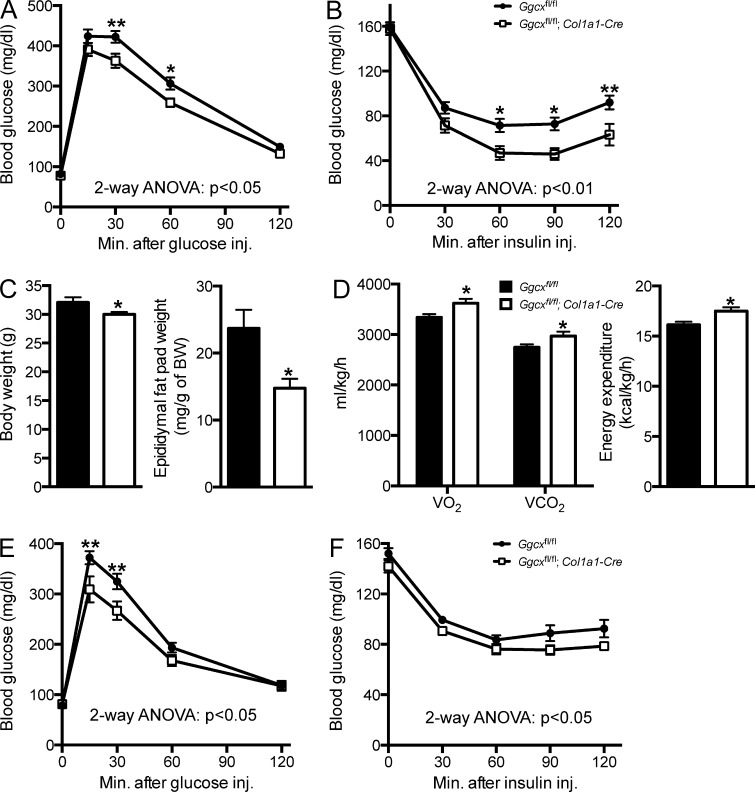
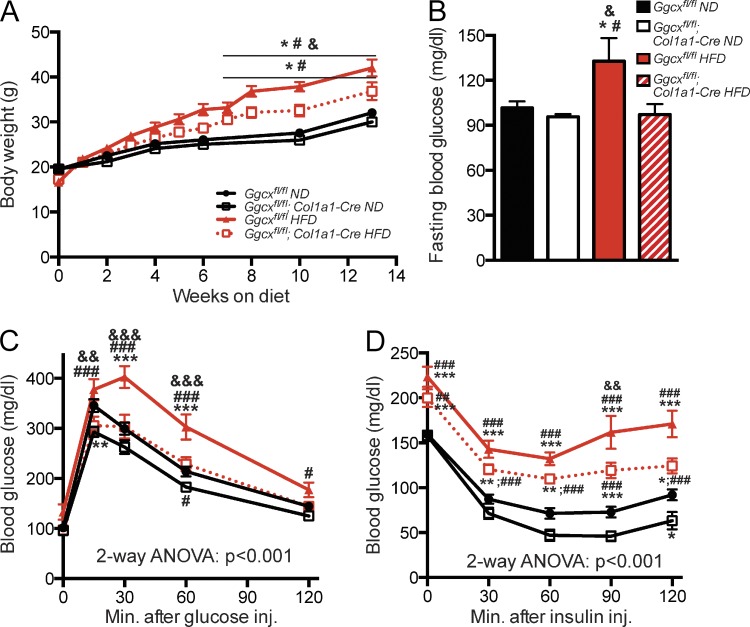
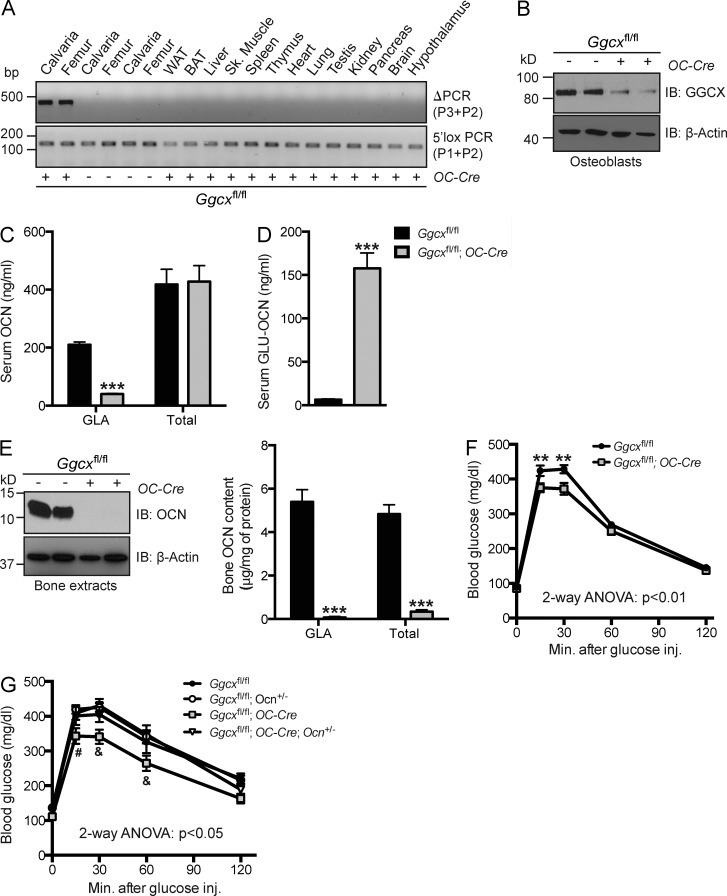
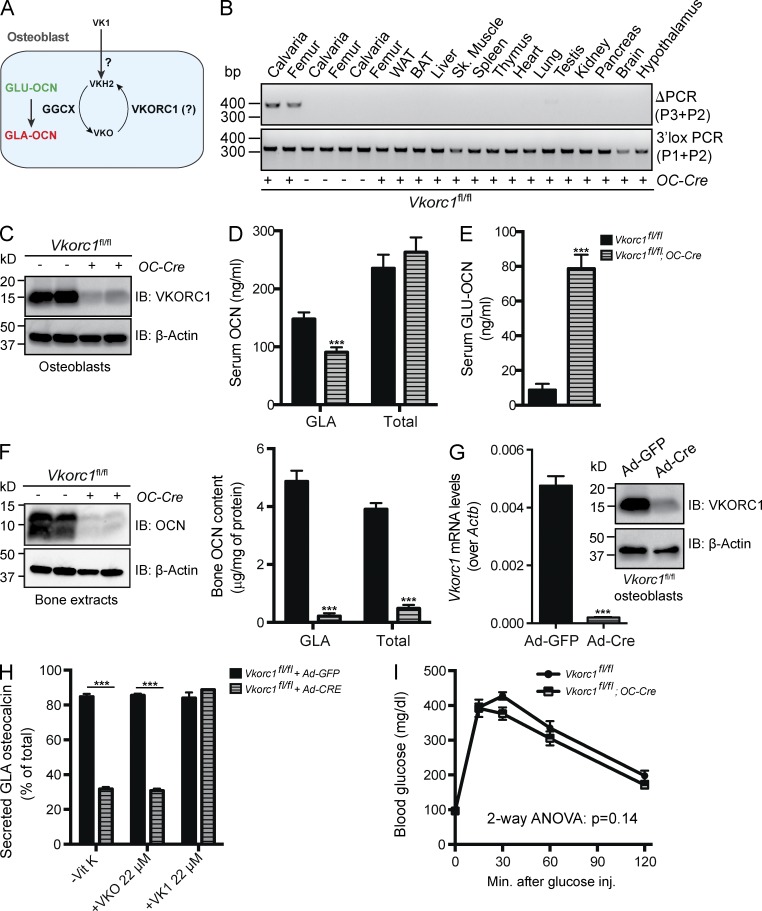
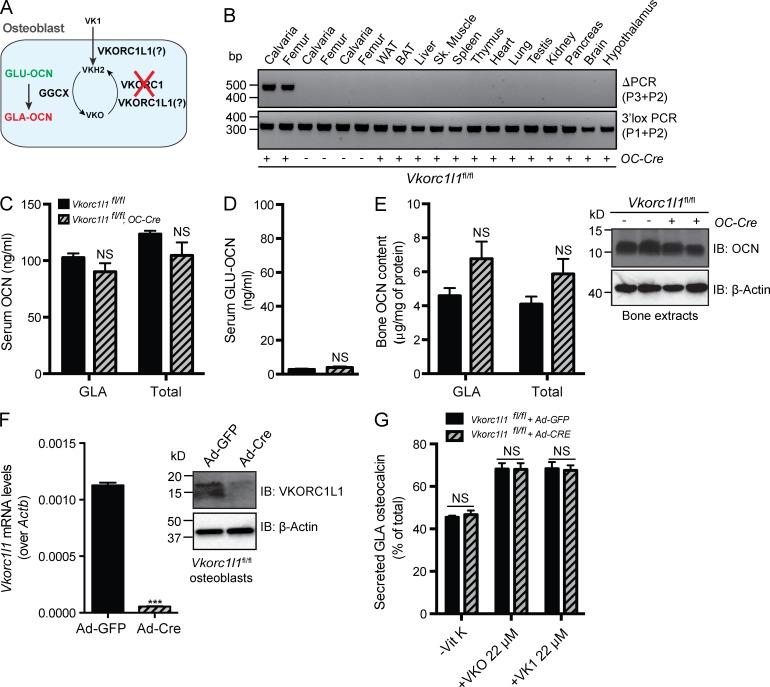
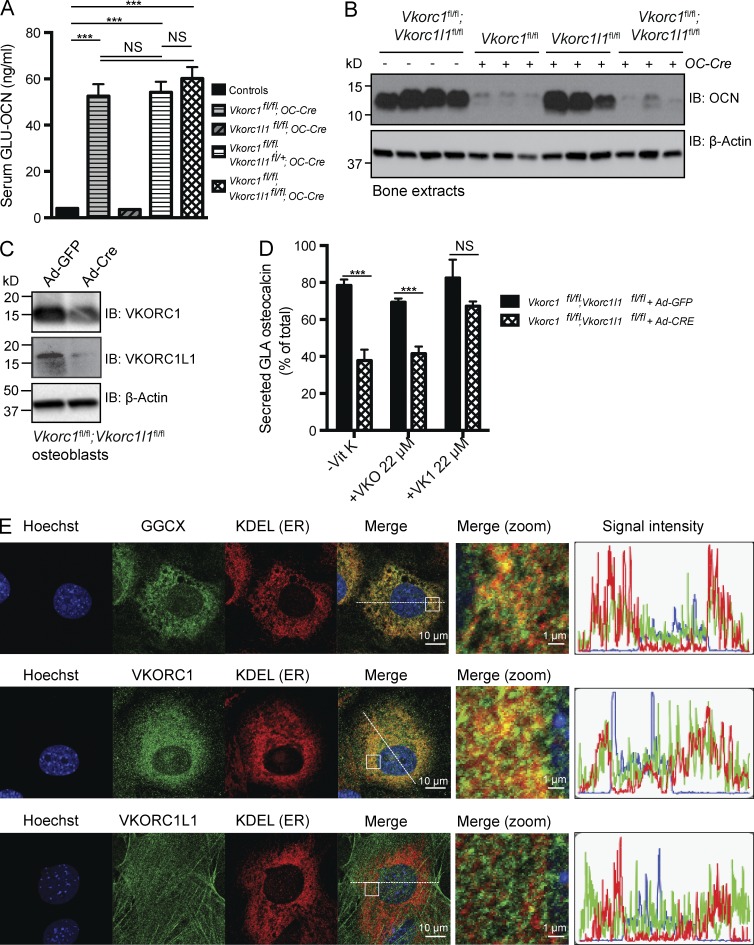
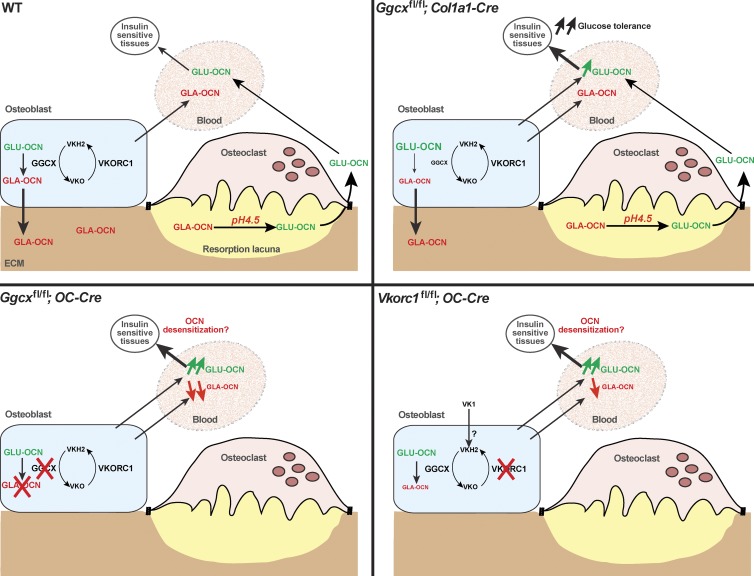
Osteocalcin (OCN) is an osteoblast-derived hormone favoring glucose homeostasis, energy expenditure, male fertility, brain development, and cognition. Before being secreted by osteoblasts in the bone extracellular matrix, OCN is γ-carboxylated by the γ-carboxylase (GGCX) on three glutamic acid residues, a cellular process requiring reduction of vitamin K (VK) by a second enzyme, a reductase called VKORC1. Although circumstantial evidence suggests that γ-carboxylation may inhibit OCN endocrine functions, genetic evidence that it is the case is still lacking. Here we show using cell-specific gene inactivation models that γ-carboxylation of OCN by GGCX inhibits its endocrine function. We further show that VKORC1 is required for OCN γ-carboxylation in osteoblasts, whereas its paralogue, VKORC1L1, is dispensable for this function and cannot compensate for the absence of VKORC1 in osteoblasts. This study genetically and biochemically delineates the functions of the enzymes required for OCN modification and demonstrates that it is the uncarboxylated form of OCN that acts as a hormone.


Figures

Figure 1.
Figure 1.
Partial reduction of OCN γ-carboxylation in Ggcxfl/fl;Col1a1-Cre mice. (A) Cre-mediated inactivation of GGCX in Ggcxfl/fl osteoblasts infected with either Ad-GFP or Ad-Cre was assessed by QPCR (left; n = 4 per group) or by Western blotting (right). (B) Percentage of GLA- over total OCN measured in the supernatant of osteoblasts of the indicated genotype cultured in the absence of VK (−VK) or in the presence of VKO (+VKO) or VK1 (+VK1; n = 4 for each condition). (C) Detection of the deletion allele (ΔPCR) of Ggcx by PCR on genomic DNA isolated from tissues of Ggcxfl/fl;Col1a1-Cre and Ggcxfl/fl mice. PCR for the floxed allele (3′lox PCR) was used as a loading control. WAT and BAT, white and brown adipose tissue, respectively. (D and E) Serum levels of GLA- and total OCN (D) and of GLU-OCN (E) in Ggcxfl/fl (n = 4) and Ggcxfl/fl;Col1a1-Cre (n = 4) 2-mo-old mice. Results are given as means ± SEM. **, P < 0.01; ***, P < 0.001.
Figure 2.
Figure 2.
Improved glucose tolerance, insulin sensitivity, and energy expenditure in Ggcxfl/fl;Col1a1-Cre mice. (A) GTTs in Ggcxfl/fl (n = 11) and Ggcxfl/fl;Col1a1-Cre (n = 9) 2–3-mo-old male mice. Mice were fasted for 16 h and injected i.p. with 2 g/kg glucose. (B) ITTs in Ggcxfl/fl (n = 16) and Ggcxfl/fl;Col1a1-Cre (n = 11) 2–3-mo-old male mice. Mice were fasted for 4 h and injected i.p. with 0.7 U/kg insulin. (C) Body weight (left) and epididymal fat pad weight normalized to body weight (right) in Ggcxfl/fl (n = 10) and Ggcxfl/fl;Col1a1-Cre (n = 10) 5-mo-old male mice. (D) Metabolic rates and heat production (energy expenditure) in Ggcxfl/fl (n = 9) and Ggcxfl/fl;Col1a1-Cre (n = 8) 3-mo-old male mice during the dark 12-h phases. (E) GTTs in Ggcxfl/fl (n = 13) and Ggcxfl/fl;Col1a1-Cre (n = 9) 2–3 mo-old female mice. Mice were fasted for 16 h and injected i.p. with 2 g/kg glucose. (F) ITTs in Ggcxfl/fl (n = 12) and Ggcxfl/fl;Col1a1-Cre (n = 8) 2–3-mo-old female mice. Mice were fasted for 4 h and injected i.p. with 0.3 U/kg insulin. Results are given as means ± SEM. *, P < 0.05; **, P < 0.01.
Figure 3.
Figure 3.
Ggcxfl/fl;Col1a1-Cre mice are protected from diet-induced obesity and glucose intolerance. (A) Body weight curves. (B) Blood glucose levels after 16-h fasting. (C) GTTs. Mice were fasted for 16 h and injected i.p. with 1.3 g/kg glucose. (D) ITTs. Mice were fasted for 4 h and injected i.p. with 0.7 U/kg insulin. (B–D) Metabolic analyses were performed in mice fed an ND or HFD for 8 wk. Ggcxfl/fl ND (n = 14), Ggcxfl/fl;Col1a1-Cre ND (n = 14), Ggcxfl/fl HFD (n = 8), Ggcxfl/fl;Col1a1-Cre HFD (n = 11). Results are given as means ± SEM. *, P < 0.05; **, P < 0.01; ***, P < 0.001 when comparing with Ggcxfl/fl ND group; #, P < 0.05; ##, P < 0.01; ###, P < 0.001 when comparing with Ggcxfl/fl;Col1a1-Cre ND group; &, P < 0.05; &&, P < 0.01; &&&, P < 0.001 when comparing with Ggcxfl/fl;Col1a1-Cre HFD group.
Figure 4.
Figure 4.
Efficient reduction of OCN γ-carboxylation in Ggcxfl/fl;OC-Cre mice. (A) Detection of the deletion allele (ΔPCR) of Ggcx by PCR on genomic DNA isolated from tissues of Ggcxfl/fl;OC-Cre and Ggcxfl/fl mice. PCR for the floxed allele (3′lox PCR) was used as a loading control. (B) Western blotting analyses of GGCX expression in Ggcxfl/fl and Ggcxfl/fl;OC-Cre bone marrow–derived osteoblasts. WAT and BAT, white and brown adipose tissue, respectively. (C and D) Serum levels of GLA- and total OCN (C) and of GLU-OCN (D) in Ggcxfl/fl (n = 4) and Ggcxfl/fl;OC-Cre (n = 4) 2-mo-old mice. (E) Bone OCN content in Ggcxfl/fl (n = 6) and Ggcxfl/fl;OC-Cre (n = 6) 3-mo-old mice was assessed from whole bone extracts by Western blotting (left) or ELISA and normalized to the total protein content (right). (F) GTTs in Ggcxfl/fl (n = 13) and Ggcxfl/fl;OC-Cre (n = 16) 3-mo-old mice fed an ND. Mice were fasted for 16 h and injected i.p. with 2 g/kg glucose. (G) GTTs in Ggcxfl/fl (n = 7), Ggcxfl/fl;Ocn+/− (n = 9), Ggcxfl/fl;OC-Cre;Ocn+/− (n = 9), and Ggcxfl/fl;OC-Cre (n = 9) mice fed an ND. Mice were fasted for 16 h and injected i.p. with 1.3 g/kg glucose. Results are given as means ± SEM. (C–F) **, P < 0.01; ***, P < 0.001. (G) #, P < 0.05 when comparing with Ggcxfl/fl;Ocn+/− and Ggcxfl/fl;OC-Cre;Ocn+/− mice; &, P < 0.05 when comparing with Ggcxfl/fl, Ggcxfl/fl;Ocn+/−, and Ggcxfl/fl;OC-Cre;Ocn+/− mice.
Figure 5.
Figure 5.
Efficient reduction of OCN γ-carboxylation in Vkorc1fl/fl;OC-Cre mice. (A) Hypothetical role of VKORC1 in regulating OCN γ-carboxylation osteoblasts. (B) Detection of the deletion allele (ΔPCR) of Vkorc1 by PCR on genomic DNA isolated from tissues of Vkorc1fl/fl;OC-Cre and Vkorc1fl/fl mice. PCR for the floxed allele (3′lox PCR) was used as a loading control. WAT and BAT, white and brown adipose tissue, respectively. (C) Western blotting analyses of VKORC1 expression in Vkorc1fl/fl and Vkorc1fl/fl;OC-Cre bone marrow–derived osteoblasts. (D and E) Serum levels of GLA- and total OCN (D) and of GLU-OCN (E) in Vkorc1fl/fl (n = 5) and Vkorc1fl/fl;OC-Cre (n = 5) 2-mo-old mice. (F) Bone OCN content in Vkorc1fl/fl (n = 5) and Vkorc1fl/fl;OC-Cre (n = 4) 3-mo-old mice was assessed from whole bone extracts by Western blotting (left) or by ELISA and normalized to the total protein content (right). (G) Cre-mediated inactivation of VKORC1 in Vkorc1fl/fl osteoblasts infected with either Ad-GFP or Ad-Cre was assessed by QPCR (left; n = 4 per group) or by Western blotting (right). (H) Percentage of GLA- over total OCN measured in the supernatant of osteoblasts of the indicated genotype cultured in the absence of VK (−VK) or in the presence of VKO (+VKO) or VK1 (+VK1; n = 4 for each condition). (I) GTTs in Vkorc1fl/fl (n = 7) and Vkorc1fl/fl;OC-Cre (n = 7) 3-mo-old mice fed an ND. Mice were fasted for 16 h and injected i.p. with 2 g/kg glucose. Results are given as means ± SEM. ***, P < 0.001.
Figure 6.
Figure 6.
Deletion of VKORC1L1 in osteoblasts does not impact OCN γ-carboxylation. (A) Hypothetical role of VKORC1L1 in regulating OCN γ-carboxylation osteoblasts. (B) Detection of the deletion allele (ΔPCR) of Vkorc1l1 by PCR on genomic DNA isolated from tissues of Vkorc1l1fl/fl;OC-Cre and Vkorc1l1fl/fl mice. PCR for the floxed allele (3′lox PCR) was used as a loading control. WAT and BAT, white and brown adipose tissue, respectively. (C and D) Serum levels of GLA- and total OCN (C) and of GLU-OCN (D) in Vkorc1l1fl/fl (n = 5) and Vkorc1l1fl/fl;OC-Cre (n = 5) 2-mo-old mice. (E) Bone OCN content in Vkorc1l1fl/fl (n = 7) and Vkorc1l1fl/fl;OC-Cre (n = 6) 3-mo-old mice was assessed from whole bone extracts by ELISA and normalized to the total protein content (left) or by Western blotting (right). (F) Cre-mediated inactivation of VKORC1L1 in Vkorc1l1fl/fl osteoblasts infected with either Ad-GFP or Ad-Cre was assessed by QPCR (left; n = 4 per group) or by Western blotting (right). (G) Percentage of GLA- over total OCN measured in the supernatant of osteoblasts of the indicated genotype cultured in the absence of VK (−VK) or in the presence of VKO (+VKO) or VK1 (+VK1; n = 4 for each condition). Results are given as means ± SEM. ***, P < 0.001.
Figure 7.
Figure 7.
VKORC1L1 does not compensate for VKORC1 absence in osteoblasts. (A) Serum levels of GLU-OCN in control (n = 12), Vkorc1fl/fl;OC-Cre (n = 4), Vkorc1l1fl/fl;OC-Cre (n = 5), Vkorc1fl/fl;Vkorc1l1+/fl;OC-Cre (n = 5), and Vkorc1fl/fl;Vkorc1l1fl/fl;OC-Cre (n = 6) 2-mo-old mice. (B) Bone OCN content in 2-mo-old mice was assessed from whole bone extracts by Western blotting. Each lane represents an individual animal. (C) Cre-mediated inactivation of VKORC1 and VKORC1L1 in Vkorc1fl/fl;Vkorc1l1fl/fl osteoblasts infected with either Ad-GFP or Ad-Cre was assessed by Western blotting. (D) Percentage of GLA- over total OCN measured in the supernatant of osteoblasts of the indicated genotype cultured in the absence of VK (−VK) or in the presence of VKO (+VKO) or VK1 (+VK1; n = 4 for each condition). (E) Immunofluorescence analyses of mouse osteoblasts. Cells were stained with rabbit antibodies against GGCX (top), VKORC1 (middle), or VKORC1L1 (bottom) and with a mouse anti-KDEL antibody to label the ER. The areas boxed on the merge panels are zoomed in the panels labeled “merge (zoom).” The graphs displayed on the right show the intensity of each of the fluorescent signals (green, red, and blue) in a 50-µm cross-section of each cell (dashed lines). At least 20 individual cells were analyzed for each staining condition, and comparable results were obtained in all cases. Results are given as means ± SEM. ***, P < 0.001.
Figure 8.
Figure 8.
Model of the regulation of OCN function by GGCX and VKORC1. In WT mice (top left), OCN is γ-carboxylated in osteoblasts before it is secreted. Most of the secreted GLA-OCN is stored in the bone ECM, but some GLA-OCN escapes bone ECM embedding and reaches the circulation. Bone resorption by osteoclasts was previously shown to decarboxylate GLA-OCN, generating active GLU-OCN, which favors glucose tolerance (Ferron et al., 2010a). In Ggcxfl/fl;Col1a1-Cre mice (top right), there is an increase in serum GLU-OCN, leading to improved glucose tolerance. Some GLA-OCN remains in the bone ECM and in the serum because of the partial inactivation of Ggcx. In Ggcxfl/fl;OC-Cre mice (bottom left), OCN is poorly carboxylated and therefore escapes ECM embedding. Most of the serum OCN is undercarboxylated. In Vkorc1fl/fl;OC-Cre mice (bottom right), some GLA-OCN is secreted by osteoblasts, most likely because of the exogenous contribution of VK1, which is converted to VKH2 in osteoblasts by an unknown enzyme. Our data suggest that this enzyme is not VKORC1L1. It is possible that the high level of serum GLU-OCN in Ggcxfl/fl;OC-Cre and in Vkorc1fl/fl;OC-Cre mice leads to desensitization of the OCN receptor.

References

    1. Abseyi N., Şıklar Z., Berberoğlu M., Hacıhamdioğlu B., Savaş Erdeve Ş., and Öçal G.. 2012. Relationships between osteocalcin, glucose metabolism, and adiponectin in obese children: Is there crosstalk between bone tissue and glucose metabolism? J. Clin. Res. Pediatr. Endocrinol. 4:182–188. 10.4274/Jcrpe.831 - DOI - PMC - PubMed
    1. Berkner K.L., Harbeck M., Lingenfelter S., Bailey C., Sanders-Hinck C.M., and Suttie J.W.. 1992. Purification and identification of bovine liver gamma-carboxylase. Proc. Natl. Acad. Sci. USA. 89:6242–6246. 10.1073/pnas.89.14.6242 - DOI - PMC - PubMed
    1. Brennan-Speranza T.C., Henneicke H., Gasparini S.J., Blankenstein K.I., Heinevetter U., Cogger V.C., Svistounov D., Zhang Y., Cooney G.J., Buttgereit F., et al. 2012. Osteoblasts mediate the adverse effects of glucocorticoids on fuel metabolism. J. Clin. Invest. 122:4172–4189. 10.1172/JCI63377 - DOI - PMC - PubMed
    1. Bulló M., Moreno-Navarrete J.M., Fernández-Real J.M., and Salas-Salvadó J.. 2012. Total and undercarboxylated osteocalcin predict changes in insulin sensitivity and β cell function in elderly men at high cardiovascular risk. Am. J. Clin. Nutr. 95:249–255. 10.3945/ajcn.111.016642 - DOI - PubMed
    1. Chappard D., Palle S., Alexandre C., Vico L., and Riffat G.. 1987. Bone embedding in pure methyl methacrylate at low temperature preserves enzyme activities. Acta Histochem. 81:183–190. 10.1016/S0065-1281(87)80012-0 - DOI - PubMed

Publication types