. 2015 Mar 16;208(6):821-38.
doi: 10.1083/jcb.201404140. Epub 2015 Mar 9.

ZO-1 controls endothelial adherens junctions, cell-cell tension, angiogenesis, and barrier formation

Affiliations

ZO-1 controls endothelial adherens junctions, cell-cell tension, angiogenesis, and barrier formation

Olga Tornavaca et al. J Cell Biol. .

Abstract

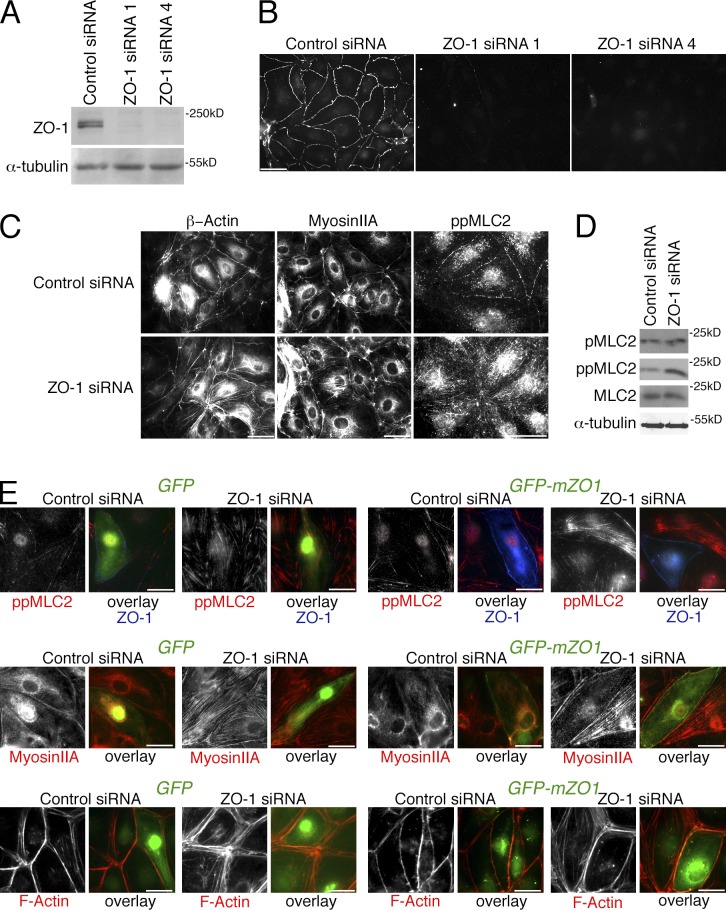
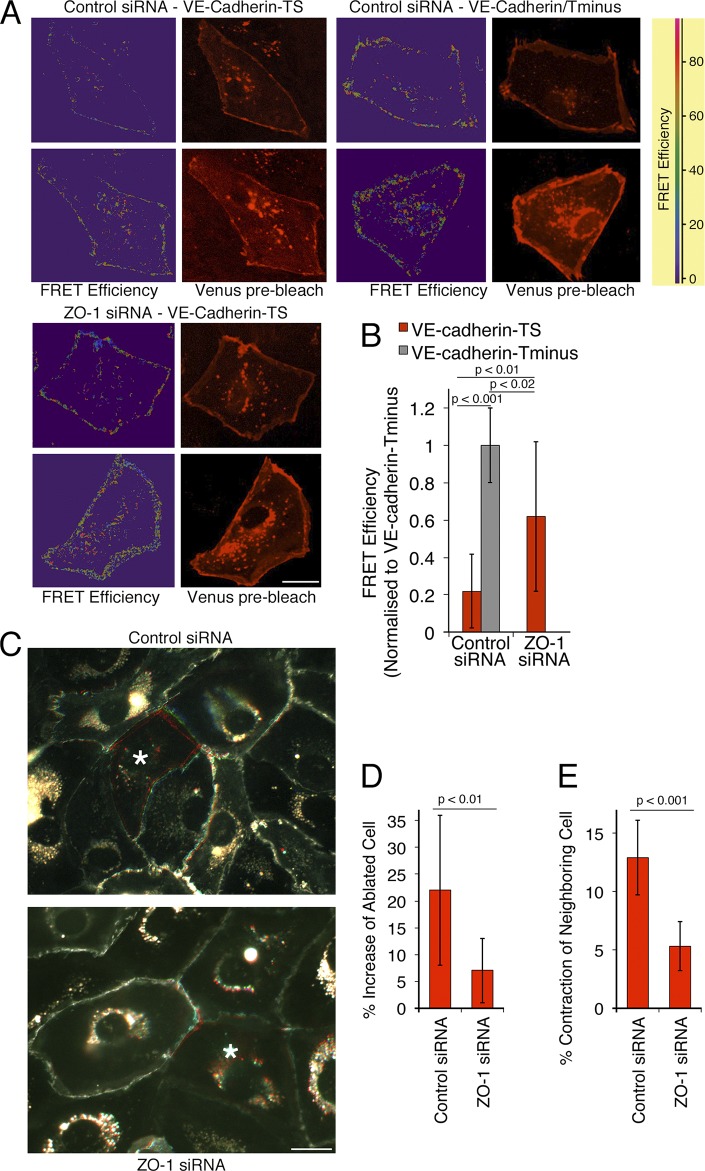
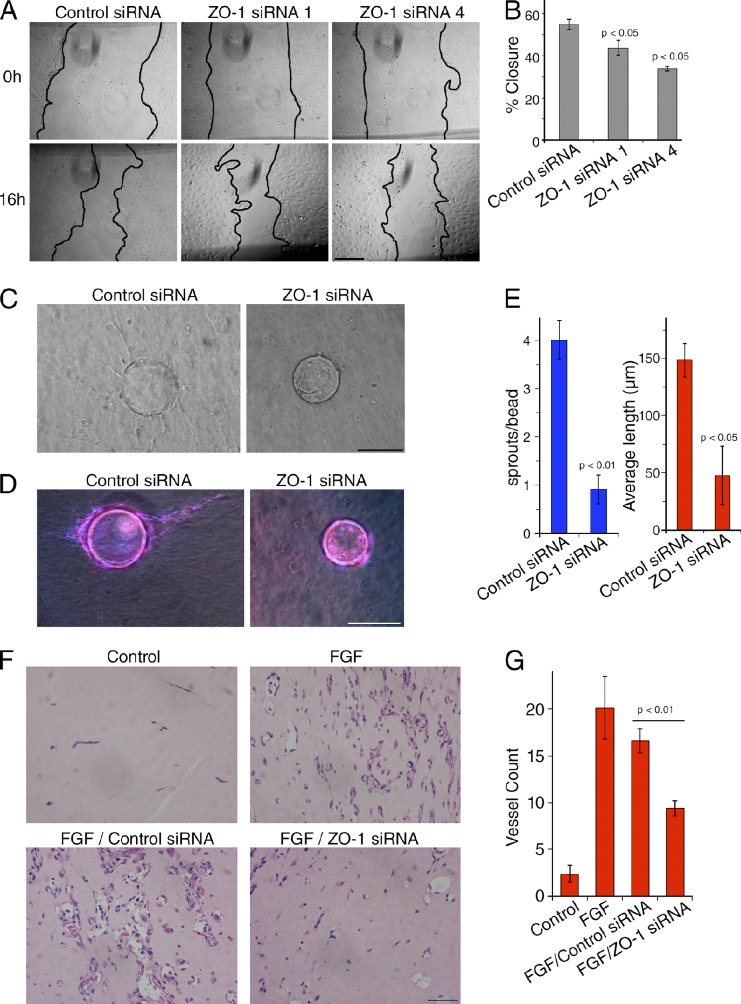
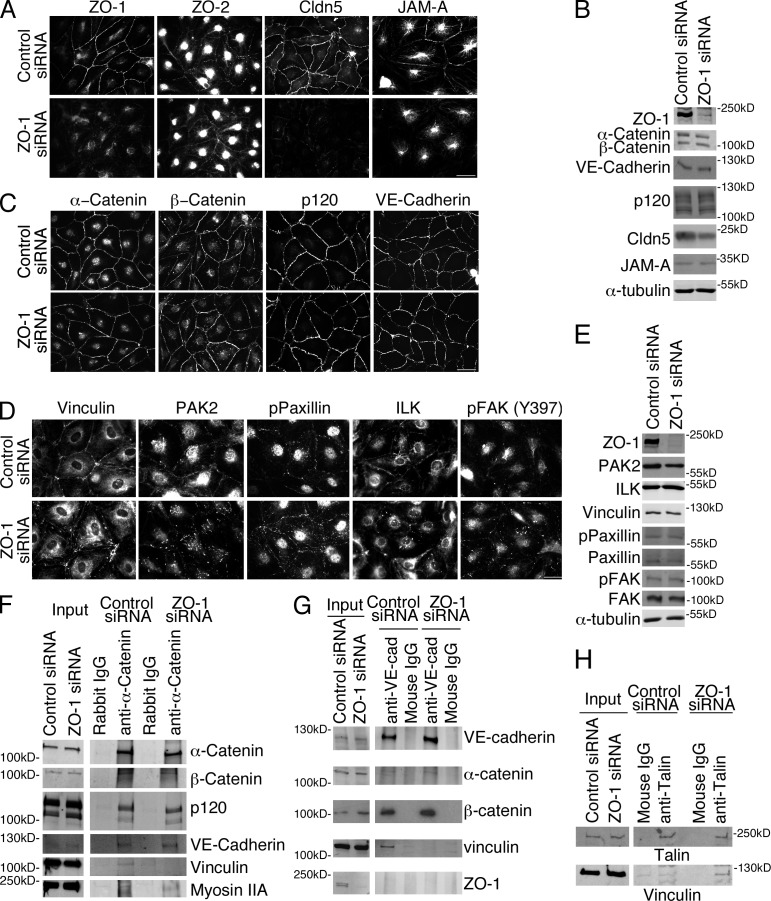
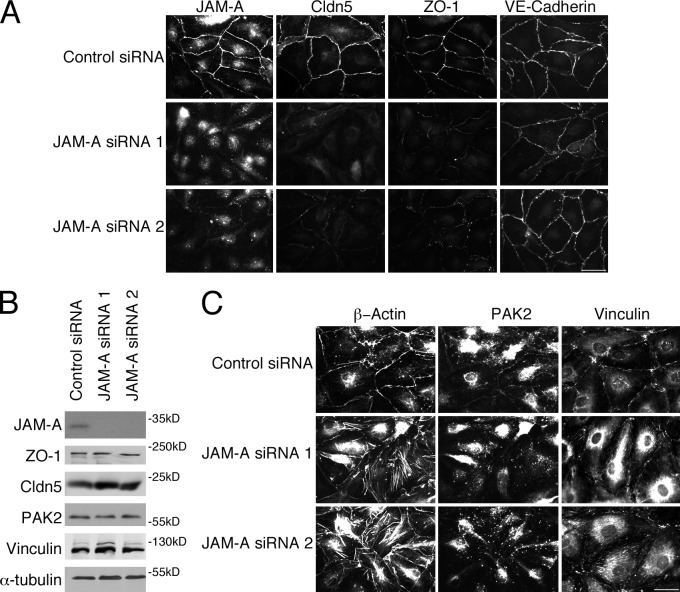
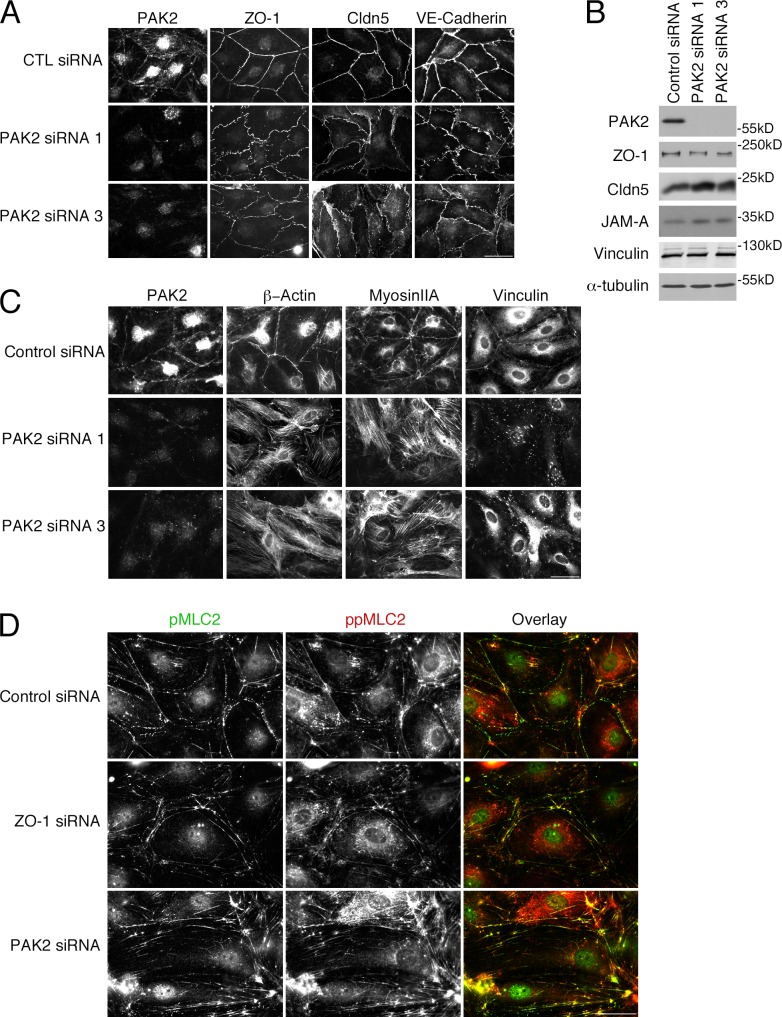
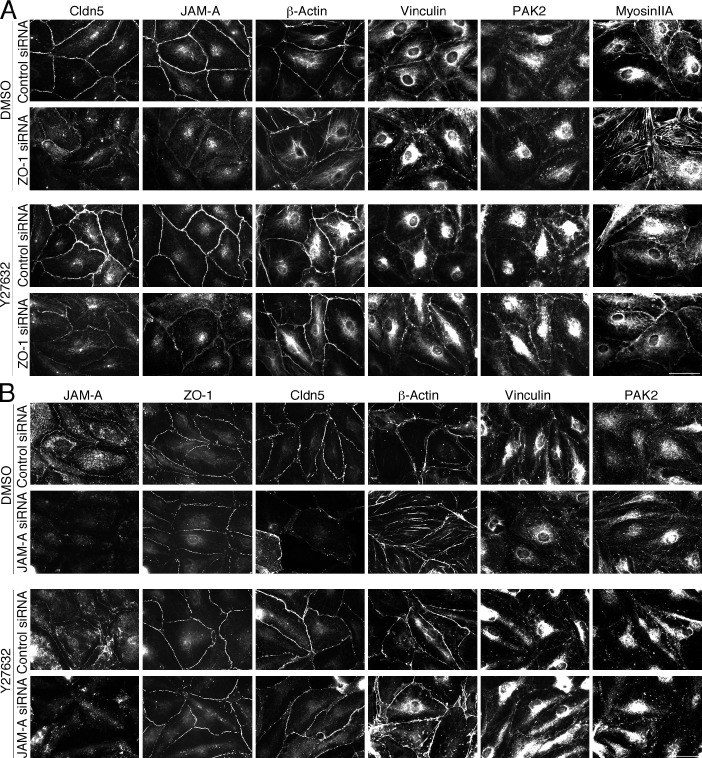
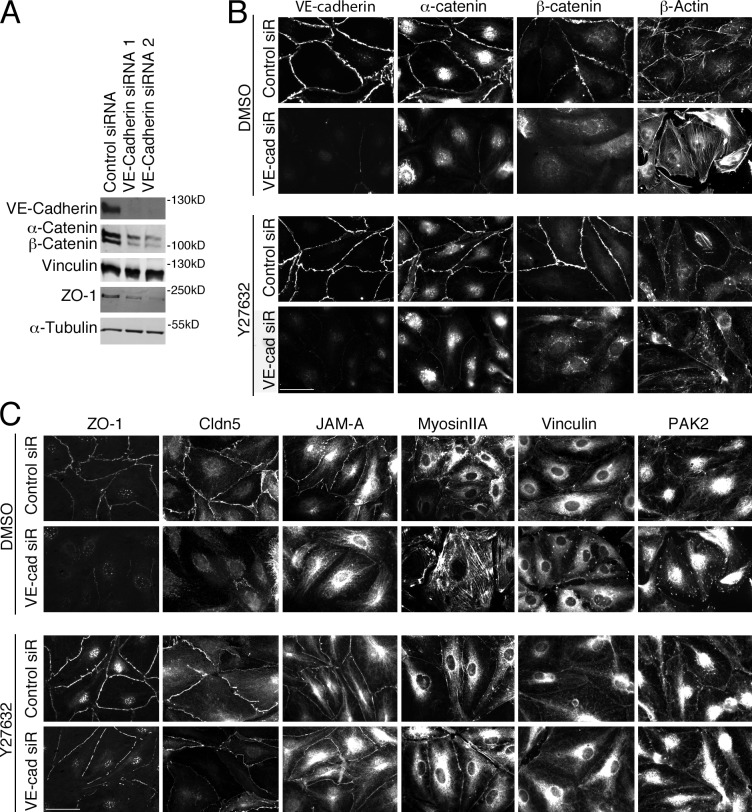
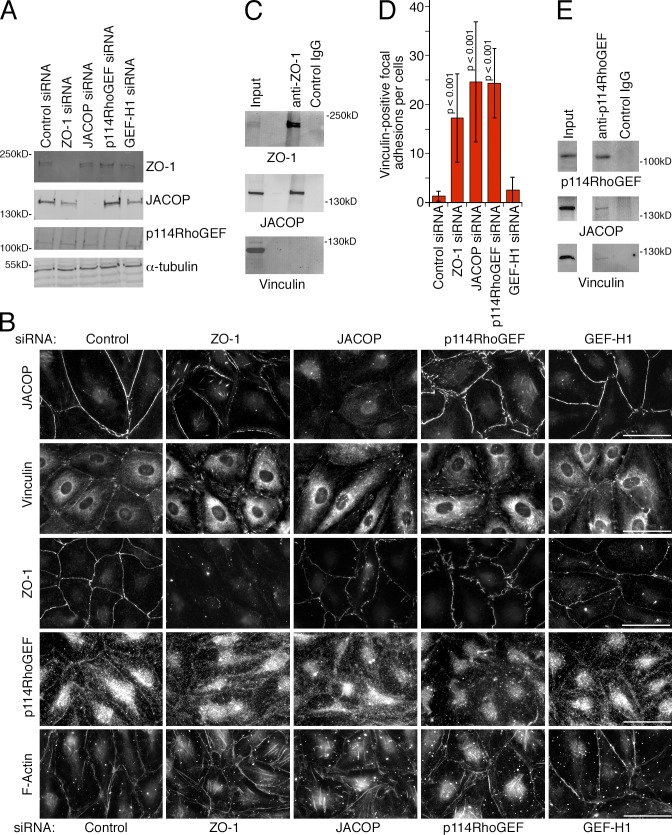
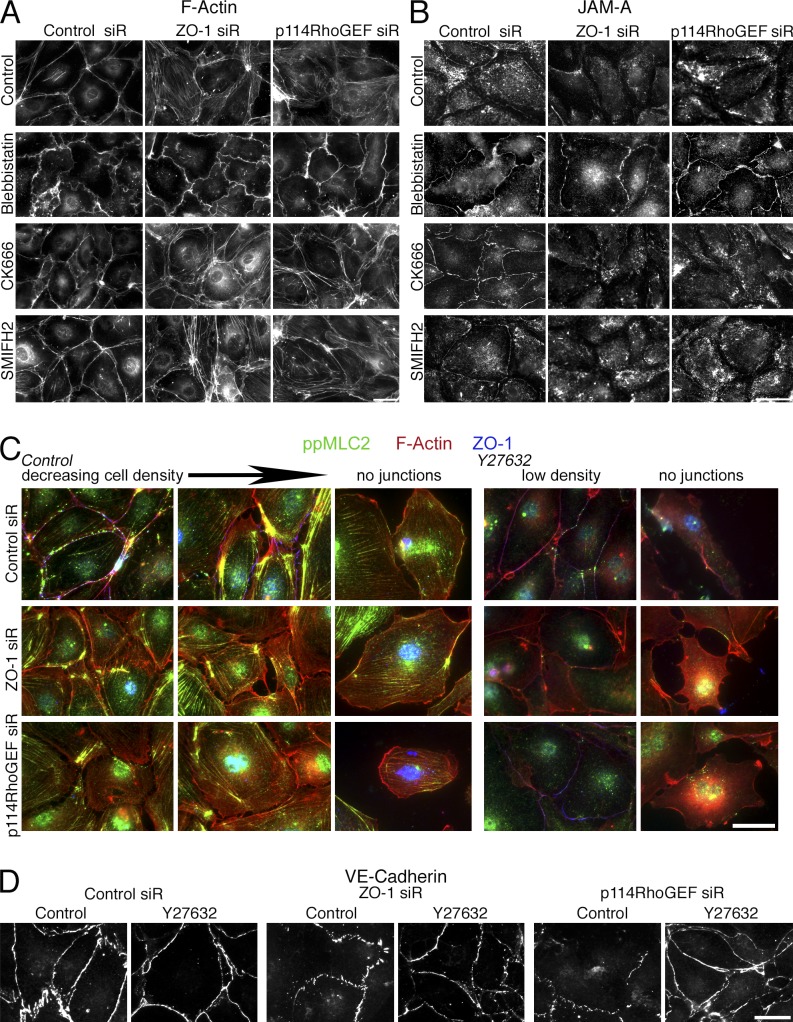
Intercellular junctions are crucial for mechanotransduction, but whether tight junctions contribute to the regulation of cell-cell tension and adherens junctions is unknown. Here, we demonstrate that the tight junction protein ZO-1 regulates tension acting on VE-cadherin-based adherens junctions, cell migration, and barrier formation of primary endothelial cells, as well as angiogenesis in vitro and in vivo. ZO-1 depletion led to tight junction disruption, redistribution of active myosin II from junctions to stress fibers, reduced tension on VE-cadherin and loss of junctional mechanotransducers such as vinculin and PAK2, and induced vinculin dissociation from the α-catenin-VE-cadherin complex. Claudin-5 depletion only mimicked ZO-1 effects on barrier formation, whereas the effects on mechanotransducers were rescued by inhibition of ROCK and phenocopied by JAM-A, JACOP, or p114RhoGEF down-regulation. ZO-1 was required for junctional recruitment of JACOP, which, in turn, recruited p114RhoGEF. ZO-1 is thus a central regulator of VE-cadherin-dependent endothelial junctions that orchestrates the spatial actomyosin organization, tuning cell-cell tension, migration, angiogenesis, and barrier formation.


Figures

Figure 1.
Figure 1.
ZO-1 regulates the endothelial actomyosin distribution. (A–C) Cells transfected with nontargeting (Control) siRNA or siRNAs directed against ZO-1 were analyzed by immunoblotting for ZO-1 and α-tubulin expression (A), or processed for immunofluorescence microscopy using antibodies against ZO-1 (B) or β-actin, myosin IIA, or double-phosphorylated MLC2 (C). (D) Cells transfected with siRNAs were analyzed by immunoblotting for single- and double-phosphorylated, as well as total, MLC2, and, as a loading control, α-tubulin. (E) Cells that had been transfected with siRNAs as indicated were additionally transfected with GFP or GFP-mZO1, a fusion protein constructed with a mouse ZO-1 cDNA, 24 h before analysis. The cells were then fixed and stained as indicated to monitor loss of stress fibers and increased junctional staining of F-actin and myosin upon ZO-1 reexpression. Bars: (A–C) 40 µm; (E) 20 µm.
Figure 2.
Figure 2.
ZO-1 down-regulation reduces endothelial cell–cell tension. (A and B) Cells were transfected with siRNAs and, after 2 d, with a VE-cadherin–based FRET tension sensor containing (TS) or lacking (Tminus) the β-catenin binding site. FRET activity was then imaged by gain of donor fluorescence after acceptor bleaching from confluent monolayers. (A) FRET efficiency maps and images taken from venus fluorescent protein before bleaching. (B) Images were quantified by calculating the FRET efficiencies at cell–cell contacts. The values were then normalized to the FRET efficiency obtained with the tail-minus construct, which does not sense tension and hence provides the FRET signals that can maximally be expected (shown are means ± 1 SD [error bars]; n = 12). (C–E) Cells expressing GFP–α-catenin were plated and transfected with siRNAs as in A. The cells were then analyzed by ablating single cells (marked with an asterisk) within the monolayer with a laser and recording the movement of cell–cell contacts in the GFP channel for 1 min. The images in C show overlays of frames taken before ablation in red, after 30 s in green, and after 45 s in blue (see also Videos 1 and 2). The increase in the surface area of the ablated cells and the contraction of the neighboring cells were then analyzed (D and E, shown are means ± 1 SD [error bars]; n = 11). Bars, 20 µm.
Figure 3.
Figure 3.
ZO-1 down-regulation reduces endothelial cell migration and angiogenic potential. (A) HDMEC were transfected with the indicated siRNAs for 48 h. Scratch wounds were then inflicted to induce cell migration. Representative images of wounds are shown that were taken at 0 and 16 h after scratching. (B) Percentages of the areas of closure of three independent experiments; shown are means ± 1 SD (error bars). (C–G) The effect of the depletion of ZO-1 on endothelial angiogenic potential was tested in vitro using an MC-based fibrin gel angiogenesis assay (C–E) or Matrigel plugs in vivo (F and G). For in vitro assays, HDMEC were seeded onto beads 24 h after siRNA transfection and were then embedded in a 3D fibrin gel after another 24 h. (C) Sprouting was then analyzed after 4 d by phase-contrast microscopy. (D) The cells were then fixed, permeabilized, and stained for nuclei (blue) and F-actin (red) to monitor coverage of beads with cells. (D and E) The number of sprouts per bead (D) and the mean length (E) were then determined (shown are means ± 1 SD [error bars] of four experiments). (F and G) For in vivo assays, mice were injected with Matrigel-containing FGF and siRNAs as indicted to induce angiogenesis. After 7 d, the plugs were harvested and fixed, embedded in paraffin, and sectioned. Sections in E were stained by hematoxylin and eosin, and were used to quantify the number of vessels shown in F (shown are means ± 1 SD [error bars]; control and FGF, n = 6; siRNA samples, n = 12). Bars, 250 µm.
Figure 4.
Figure 4.
ZO-1 depletion leads to a selective redistribution of tight junction proteins and junctional mechanotransducers. (A–E) HDMEC with or without down-regulation of ZO-1 were analyzed by immunofluorescence and immunoblotting using antibodies for the indicated tight junction (A and B) and adherens junction (B and C) proteins, as well as mechanotransducers and regulators (D and E). (F–H) Control and siRNA-depleted cells were extracted and used for immunoprecipitation with antibodies against α-catenin (F), VE-cadherin (G), or talin (H). Immunoprecipitates were then analyzed by immunoblotting as indicated. Results shown are representative from three duplicate experiments. Bars: (A) 40 µm; (C) 50 µm; (D) 30 µm.
Figure 5.
Figure 5.
JAM-A down-regulation redistributes ZO-1 and claudin-5, and induces focal adhesions. (A and C) Cells transfected with control or JAM-A siRNAs were analyzed by immunofluorescence for the indicated proteins. (B) Equivalent samples were analyzed by expression of the indicated proteins by immunoblotting. Results shown are representative from three duplicate experiments performed. Bars, 30 µm.
Figure 6.
Figure 6.
PAK2 down-regulation stimulates reorganization of the cytoskeleton. Cells transfected with control or two different PAK2 siRNAs were analyzed by immunofluorescence (A, C, and D) or immunoblotting as indicated (B). Results shown are representative from three duplicate experiments. Bars, 30 µm.
Figure 7.
Figure 7.
ROCK inhibition rescues the effects of ZO-1 or JAM-A depletion. Cells were transfected with control or ZO-1 siRNAs (A) or control and JAM-A siRNAs (B), and 48 h later were incubated for 24 h in the presence or absence of the ROCK inhibitor Y27632 (10 µM). Then, the cells were fixed and analyzed by immunofluorescence for the indicated proteins (A). Results shown are representative from three duplicate experiments. Bars, 40 µm.
Figure 8.
Figure 8.
ROCK inhibition rescues the effects on the actin cytoskeleton and tight junctions of VE-cadherin down-regulation. (A) HDMEC transfected with the indicated siRNAs were analyzed by immunoblotting as labeled. Cells were transfected with control or VE-cadherin siRNAs and, 48 h later, were incubated for another 24 h in the presence or absence of the ROCK inhibitor Y27632. (B and C) Then, they were analyzed by immunofluorescence for the indicated proteins. Results shown are representative from three duplicate experiments. Bars: (B) 30 µm; (C) 40 µm.
Figure 9.
Figure 9.
ZO-1 is required for junctional recruitment of JACOP and p114RhoGEF. (A and B) HDMEC were transfected as indicated with siRNAs and were then analyzed by immunoblotting (A) or immunofluorescence (B). (C) HDMEC were extracted and subjected to immunoprecipitation with anti–ZO-1 antibodies. The precipitates were then analyzed by immunoblotting for ZO-1, JACOP, and vinculin. (D) The number of vinculin-positive focal adhesions per cell were counted in images such as those shown in B. Shown are means ± 1 SD (error bars); n = 15. (E) HDMEC were extracted and p114RhoGEF was immunoprecipitated. Precipitates were analyzed by immunoblotting for JACOP and vinculin. Bars, 30 µm.
Figure 10.
Figure 10.
Regulation of cytoskeletal organization and junction assembly in low-density cultures. (A and B) HDMEC cells were transfected with siRNAs as indicated and then incubated with Blebbistatin, CK666, or SMIFH2 for the last 24 h before fixation. The cells were then stained for F-actin to visualize cytoskeletal organization (A) or JAM-A to monitor junction assembly (B). (C and D) Cells were plated at low density and then transfected with siRNAs. Before reaching full confluence, the cells were fixed and stained as indicated. Shown are images of areas where cells were already confluent or partially confluent, and images of cells without or with only little cell–cell contact. If indicated, the cells were incubated with the ROCK inhibitor Y27632 for 24 h before fixation. Bars, 20 µm.

References

    1. Bazzoni G.2011. Pathobiology of junctional adhesion molecules. Antioxid. Redox Signal. 15:1221–1234 10.1089/ars.2010.3867 - DOI - PubMed
    1. Bazzoni G., Martinez-Estrada O.M., Orsenigo F., Cordenonsi M., Citi S., and Dejana E.. 2000. Interaction of junctional adhesion molecule with the tight junction components ZO-1, cingulin, and occludin. J. Biol. Chem. 275:20520–20526 10.1074/jbc.M905251199 - DOI - PubMed
    1. Benais-Pont G., Punn A., Flores-Maldonado C., Eckert J., Raposo G., Fleming T.P., Cereijido M., Balda M.S., and Matter K.. 2003. Identification of a tight junction-associated guanine nucleotide exchange factor that activates Rho and regulates paracellular permeability. J. Cell Biol. 160:729–740 10.1083/jcb.200211047 - DOI - PMC - PubMed
    1. Birdsey G.M., Dryden N.H., Amsellem V., Gebhardt F., Sahnan K., Haskard D.O., Dejana E., Mason J.C., and Randi A.M.. 2008. Transcription factor Erg regulates angiogenesis and endothelial apoptosis through VE-cadherin. Blood. 111:3498–3506 10.1182/blood-2007-08-105346 - DOI - PMC - PubMed
    1. Cavallaro U., and Dejana E.. 2011. Adhesion molecule signalling: not always a sticky business. Nat. Rev. Mol. Cell Biol. 12:189–197 10.1038/nrm3068 - DOI - PubMed

Publication types

MeSH terms