. 2015 Apr;226(4):309-21.
doi: 10.1111/joa.12287. Epub 2015 Mar 9.

From gross anatomy to the nanomorphome: stereological tools provide a paradigm for advancing research in quantitative morphomics

Affiliations

From gross anatomy to the nanomorphome: stereological tools provide a paradigm for advancing research in quantitative morphomics

Terry M Mayhew et al. J Anat. 2015 Apr.

Abstract

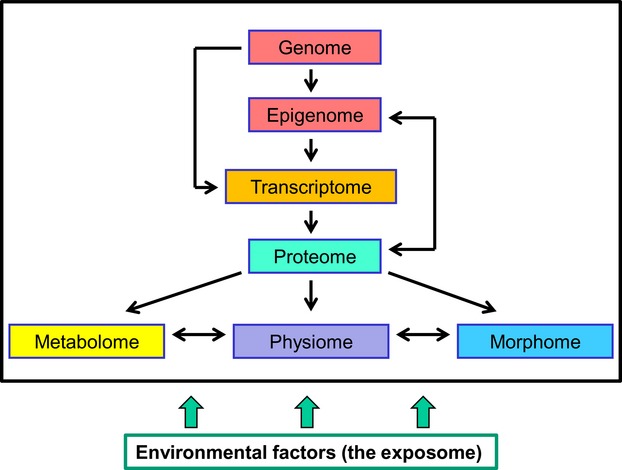
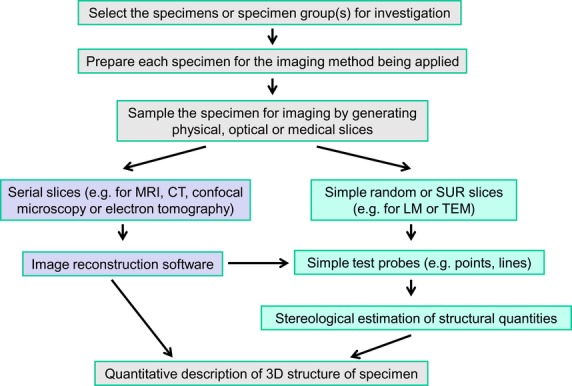
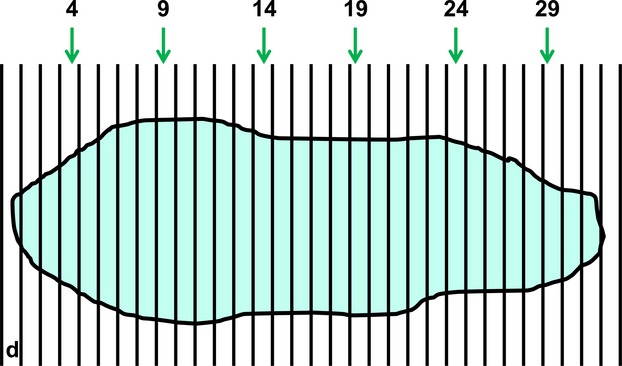
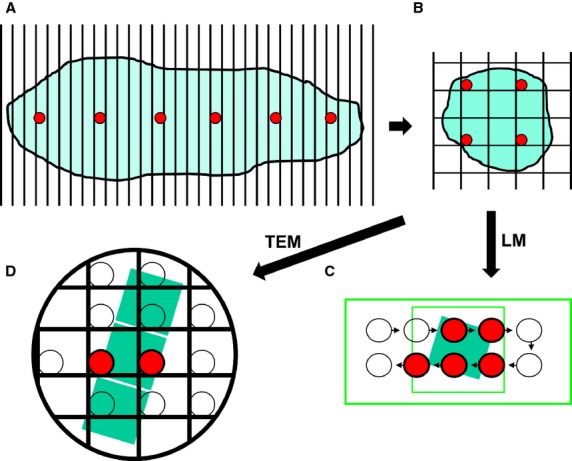
The terms morphome and morphomics are not new but, recently, a group of morphologists and cell biologists has given them clear definitions and emphasised their integral importance in systems biology. By analogy to other '-omes', the morphome refers to the distribution of matter within 3-dimensional (3D) space. It equates to the totality of morphological features within a biological system (virus, single cell, multicellular organism or populations thereof) and morphomics is the systematic study of those structures. Morphomics research has the potential to generate 'big data' because it includes all imaging techniques at all levels of achievable resolution and all structural scales from gross anatomy and medical imaging, via optical and electron microscopy, to molecular characterisation. As with other '-omics', quantification is an important part of morphomics and, because biological systems exist and operate in 3D space, precise descriptions of form, content and spatial relationships require the quantification of structure in 3D. Revealing and quantifying structural detail inside the specimen is achieved currently in two main ways: (i) by some form of reconstruction from serial physical or tomographic slices or (ii) by using randomly-sampled sections and simple test probes (points, lines, areas, volumes) to derive stereological estimates of global and/or individual quantities. The latter include volumes, surfaces, lengths and numbers of interesting features and spatial relationships between them. This article emphasises the value of stereological design, sampling principles and estimation tools as a template for combining with alternative imaging techniques to tackle the 'big data' issue and advance knowledge and understanding of the morphome. The combination of stereology, TEM and immunogold cytochemistry provides a practical illustration of how this has been achieved in the sub-field of nanomorphomics. Applying these quantitative tools/techniques in a carefully managed study design offers us a deeper appreciation of the spatiotemporal relationships between the genome, metabolome and morphome which are integral to systems biology.

Keywords: electron microscopy; immunogold cytochemistry; morphome; morphomics; quantifying 3D structure; stereology.


Figures

Figure 1
Figure 1
Morphomics as an integral part of systems biology. The genome is essentially constant but the epigenome is more variable and influences the transcriptome, proteome, metabolome, physiome and morphome. As well as the proteome, the glycome and lipidome (not shown) will affect the metabolome, physiome and morphome. All may be influenced in turn by the exposome (the totality of environmental conditions to which the system becomes exposed). This simple and incomplete representation serves to emphasise that all these fields have roles to play in furthering our understanding of biological systems and how they alter under various conditions.
Figure 2
Figure 2
Quantifying 3D morphology. A morphomics study will require decisions about the specimen(s) to be examined and imaging techniques with which to visualise them. Some form of sectioning/slicing (physical, optical, medical, tomographic) will be applied and may involve serial slices or random (SUR or simple random) slices. The former allows reconstruction of 3D structure and the latter extrapolation via stereological methods. Some forms of image reconstruction (e.g. MRI, CT, electron tomography and micro-CT) also permit stereological quantification. The outcome is a quantitative description of the 3D morphology of the specimen(s). CT, computed tomography; MRI, magnetic resonance imaging.
Figure 3
Figure 3
The principle of SUR sampling: sub-sampling from an exhaustive set of serial slices. In many forms of tomography, the whole specimen (or a part thereof) is reconstructed from an exhaustive set of serial slices through it. The slices might be obtained mechanically, optically or by medical imaging. Where 3D structural quantities are required from the specimen, it is much more efficient to make stereological estimates based on a SUR subset of these slices. Here, a specimen (e.g. an organ) has been serially cut into just 32 slices of thickness d with a random start position between 0 and d. Taking a SUR sample of every 5th slice with a random start between 1 and 5 (here, 4) yields slices 4, 9, 14, 19, 24 and 29. Using the right-facing section plane of each slice as the viewing plane, the resulting precision of estimation (for, say, specimen volume) is unlikely to overwhelm the natural variation between independent specimens belonging to the same study group. Indeed, the total observed variation (equal to the natural variation + estimation precision) depends more crucially on the number of specimens examined within a group.
Figure 4
Figure 4
SUR sampling undertaken as part of a sampling cascade. Here, a multistage SUR sampling cascade is applied to a specimen in four stages. Stage A: the specimen is cut into serial slices and every 5th slice (red circles) is selected for further sampling. Stage B: each of the selected slices is overlaid with a quadratic lattice and SUR sampled to obtain tissue pieces (red circles). The selected tissue pieces are sub-sampled to provide sections for LM and TEM. Stage C: an SUR sample of LM fields of view (highlighted red circles) is obtained by moving the microscope stage at step intervals in x- and y-directions across each chosen section. Stage D: a ribbon of TEM sections is placed on copper grid and an SUR sample of fields of view from one section is obtained (highlighted red circles, middle section).
Figure 5
Figure 5
Workflow for a study involving stereology, TEM and post-embedding immunogold cytochemistry. Four main decision steps are identified in a multistage cascade sampling scheme followed by quantification. From the group(s) to be studied, a set of specimens is selected and these might be replicates of cell cultures, cells isolated from bodily fluids or whole cells removed from some tissue/organ (Step 1). Next, the specimen is prepared for examination by the chosen imaging technique (Step 2). With immunoEM, this involves fixing, embedding and sectioning specimens for TEM and then on-section labeling for immunogold cytochemistry. The steps may involve further sub-sampling of the specimens and randomisation of section location (SUR sampling) and orientation (IUR sampling). Finally, the method of quantification is chosen (Step 3). For immunoEM, this could involve using stereology to count (i) gold particles, (ii) test points and/or (iii) intersections between test lines and membrane traces. Again, these have random sampling requirements in terms of location and orientation. Finally, data handling involves using appropriate descriptive and inferential statistics (Step 4). Similar workflows can be adopted for other imaging modalities including electron tomography and micro-CT.

Similar articles

Cited by

References

    1. Amiry-Moghaddam M, Ottersen OP. Immunogold cytochemistry in neuroscience. Nat Neurosci. 2013;7:798–804. - PubMed
    1. Aoyama K, Takagi T, Hirase A, et al. STEM tomography for thick biological specimens. Ultramicroscopy. 2008;109:70–80. - PubMed
    1. Baddeley AJ, Gundersen HJG, Cruz-Orive LM. Estimation of surface area from vertical sections. J Microsc. 1986;142:259–276. - PubMed
    1. Baudoin J-P, Jerome WG, Kübel C, et al. Whole-cell analysis of low-density lipoprotein uptake by macrophages using STEM tomography. PLoS ONE. 2013;8:e55022. - PMC - PubMed
    1. Blazquez-Llorca L, Merchán-Pérez A, Rodríguez JR, et al. FIB/SEM technology and Alzheimer's Disease: three-dimensional analysis of human cortical synapses. J Alzheimers Dis. 2013;34:995–1013. - PubMed