. 2016 Jan;75(1):126-36.
doi: 10.1002/mrm.25576. Epub 2015 Mar 6.

Free-breathing, motion-corrected, highly efficient whole heart T2 mapping at 3T with hybrid radial-cartesian trajectory

Affiliations

Free-breathing, motion-corrected, highly efficient whole heart T2 mapping at 3T with hybrid radial-cartesian trajectory

Hsin-Jung Yang et al. Magn Reson Med. 2016 Jan.

Abstract

Purpose: To develop and test a time-efficient, free-breathing, whole heart T2 mapping technique at 3.0T.

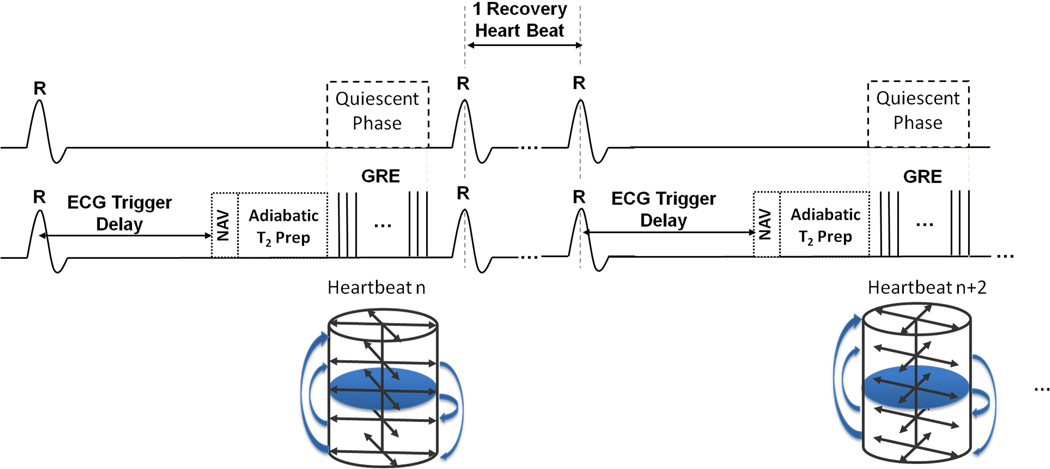
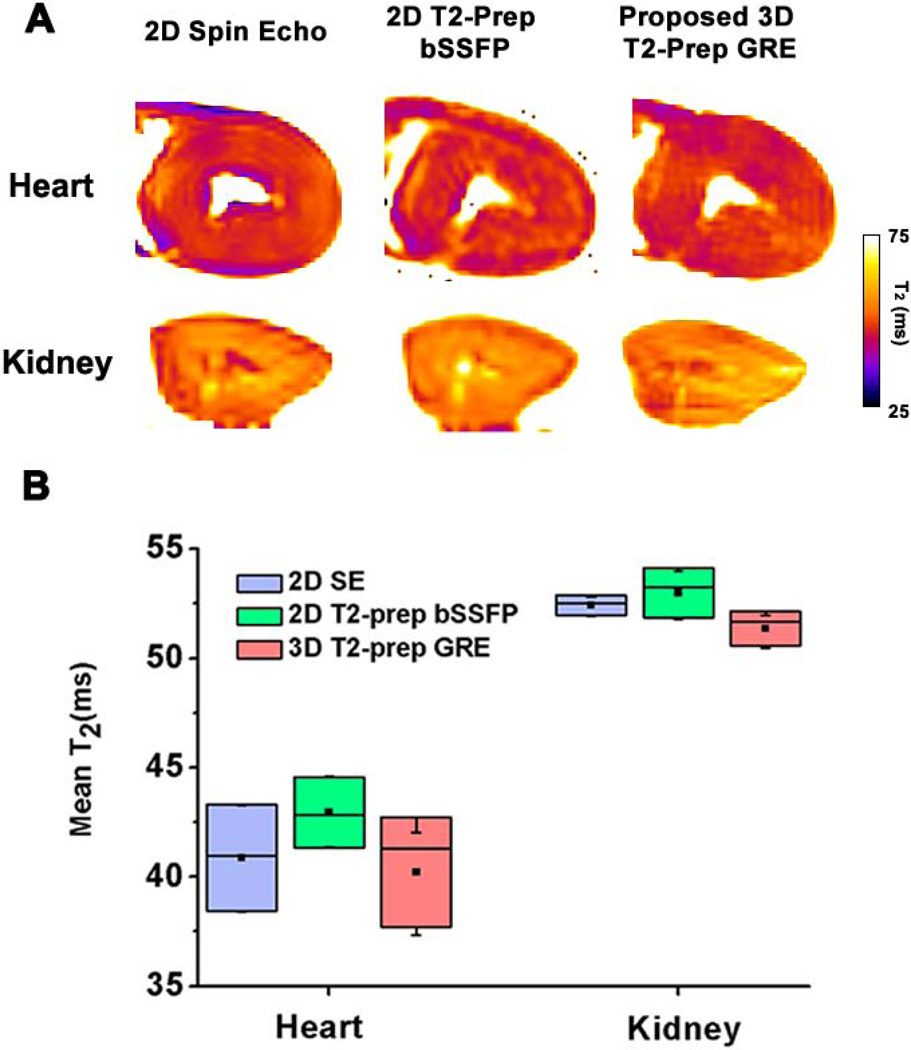
Methods: ECG-triggered three-dimensional (3D) images were acquired with different T2 preparations at 3.0T during free breathing. Respiratory motion was corrected with a navigator-guided motion correction framework at near perfect efficiency. Image intensities were fit to a monoexponential function to derive myocardial T2 maps. The proposed 3D, free breathing, motion-corrected (3D-FB-MoCo) approach was studied in ex vivo canine hearts and kidneys, healthy volunteers, and canine subjects with acute myocardial infarction (AMI).

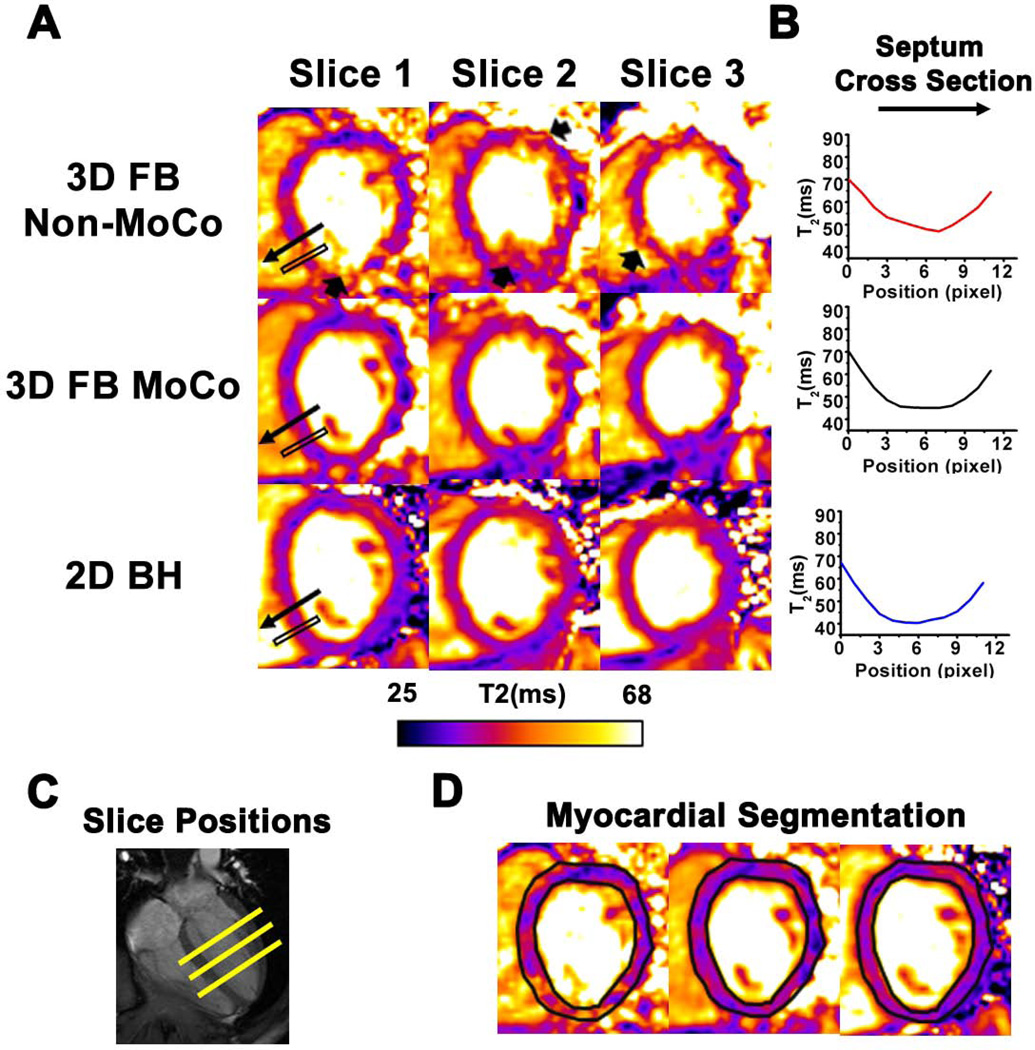
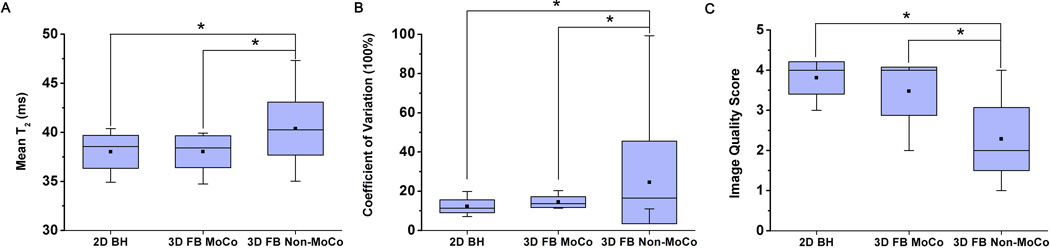
Results: Ex vivo T2 values from proposed 3D T2 -prep gradient echo were not different from two-dimensional (2D) spin echo (P = 0.7) and T2 -prep balanced steady-state free precession (bSSFP) (P = 0.7). In healthy volunteers, compared with 3D-FB-MoCo and breath-held 2D T2 -prep bSSFP (2D-BH), non-motion-corrected (3D-FB-Non-MoCo) myocardial T2 was longer, had a larger coefficient of variation (COV), and had a lower image quality (IQ) score (T2 = 40.3 ms, COV = 38%, and IQ = 2.3; all P < 0.05). Conversely, the mean and COV and IQ of 3D-FB-MoCo (T2 = 37.7 ms, COV = 17%, and IQ = 3.5) and 2D-BH (T2 = 38.0 ms, COV = 15%, and IQ = 3.8) were not different (P = 0.99, P = 0.74, and P = 0.14, respectively). In AMI, T2 values and edema volumes from 3D-FB-MoCo and 2D-BH were closely correlated (R(2) = 0.88 and 0.96, respectively).

Conclusion: The proposed whole heart T2 mapping approach can be performed within 5 min with similar accuracy to that of the 2D-BH T2 mapping approach.

Keywords: cardiac BOLD MRI; cardiac T2 mapping; fast imaging; myocardial edema.


Figures

Fig. 1
Fig. 1. Pulse sequence timing diagram and k-space trajectory
Details of the pulse sequence and the relative timing are presented in panels A and B. GRE readout is triggered during the quiescent period at mid diastole with a proper trigger delay from the R wave. Panel C shows an example of the stack-of-stars trajectory with 2 radial lines in each subset and 5 partitions.
Fig. 2
Fig. 2. Image reconstruction steps
Panel A shows a representative case of combining undersampled low-resolution images from a common respiratory phase from different TEs to arrive at composite data sets for each bin. This is shown for Bin 3 here. Similar steps are taken to arrive at data for Bins 1, 2 and reference bin (Ref Bin, end expiratory phase). Panel B shows the steps associated with motion correction (binning based on navigator signal, estimation of motion and image reconstruction) and parameter fitting. In essence, the k-space data is first combined with different TEs and separated into different respiratory bins based on the navigator signal. From each bin, a low-resolution composite image representing different respiratory position was reconstructed. On the basis of the reference bin, the affine motion parameters of all other (target) bins were estimated with ITK and stored for motion correction. Finally, k-space data with different T2 preparations were gridded independently and applied with corresponding affine transformation to yield motion-corrected images. Subsequently the pixel-wise fitting is performed using the images at different TEs to estimate T2.
Fig. 3
Fig. 3. Representative short-axis T2 maps and box-plot of mean myocardial T2 from explanted dog hearts and kidneys obtained with 2D spin echo, 2D T2-prep SSFP and 3D T2-prep GRE acquisitions
(A) Slice-matched T2 maps obtained at the level of mid ventricle from an explanted dog heart and mid slice of dog kidney using the different T2 approaches are shown. Mean T2 values (B) between the approaches were not different for heart and kidney.
Fig. 4
Fig. 4. Representative short-axis T2 maps and T2 profile across a representative region in the septum acquired from a healthy volunteer using 2D BH, 3D FB MoCo and 3D FB Non-MoCo approaches
T2 maps reconstructed using weighted images from the different TEs at the three short-axis positions are shown in panel A. Note the loss of detail and variation in signal intensity in 3D FB Non-MoCo images (arrows), which is absent in 3D FB MoCo and 2D BH T2 maps. In panel B, T2 profile within the black box containing the septal wall of slice 1 is shown. In the 3D FB Non-MoCo profile, T2 was significantly higher and showed larger deviation in the myocardial region relative to 3D FB MoCo and 2D BH. Corresponding slice positions of the short-axis images along the long axis of the heart (C) and representative myocardial segmentation contours (D) are also shown for reference.
Fig. 5
Fig. 5. Quantitative measures of mean T2 (A), COV T2 (B) and Image Quality scores (C) between 2D BH, 3D FB MoCo and 3D FB Non-MoCo approaches obtained from healthy volunteers
Across all measures, 2D BH and 3D FB MoCo approaches were not different but both were significantly different (* represents p<0.05) from 3D FB Non-MoCo approach.
Fig. 6
Fig. 6
Representative short-axis images obtained from a canine on day 4 post-MI (A), the statistical relations between 2D BH and 3D MoCo for T2 and edema volume and the statistical relations between T2-based edematous and LGE volume across all animals (B–G). (A) Slice-matched T2 maps from 2D BH and 3D FB MoCo, as well as LGE images obtained from a canine at the basal, mid ventricle (Mid) and apical sections are shown. Contours delineating the edematous volumes are presented in the right column. Note the close correspondence between hyperintense regions identified on 2D BH and 3D FB MoCo T2 maps (black arrows) and their relation to hyperintense regions in LGE images (yellow arrows). Also note that the 2D BH images are blurrier due to cardiac motion (due to single-shot acquisitions in the presence of high heart rates in canines with recent infarction), which is not the case with the proposed approach. Linear regression analysis between T2 values (edematous territories and remote myocardium) of slice-matched 3D FB MoCo and 2D BH acquisitions and the corresponding Bland-Altman analysis are shown in panels B and C, respectively. Linear regression: y = 0.9 x − 3.4, where y = T2 from 3D FB MoCo and x = T2 from 2D BH acquisitions, with R2 = 0.88, p<0.05 and bias = 0.8 ms. Linear regression analysis between slice-matched 3D FB MoCo and 2D BH acquisitions for Edema volume and the corresponding Bland-Altman analysis are shown in panels D and E, respectively. Linear regression: y1 = 1.1 x1 −2.4, where y1 = Edema volume from 3D FB MoCo and x1 = Edema volume from 2D BH acquisitions, with R2 = 0.96, p<0.05 and bias = 0.6%. Linear regression analysis between slice-matched 3D FB MoCo Edema and LGE volume and the corresponding Bland-Altman analysis are shown in panels F and G, respectively. Linear regression: y2 = 0.7 x2 −3.4, where y1 = LGE volume and x1 = Edema volume from 3D FB MoCo acquisitions, with R2 = 0.8, p<0.05 and bias = 8%.

References

    1. Abdel-Aty H, Zagrosek A, Schulz-Menger J, Taylor AJ, Messroghli D, Kumar A, Gross M, Dietz R, Friedrich MG. Delayed enhancement and T2-weighted cardiovascular magnetic resonance imaging differentiate acute from chronic myocardial infarction. Circulation. 2004;109(20):2411–2416. - PubMed
    1. Friedrich MG, Sechtem U, Schulz-Menger J, Holmvang G, Alakija P, Cooper LT, White JA, Abdel-Aty H, Gutberlet M, Prasad S, Aletras A, Laissy JP, Paterson I, Filipchuk NG, Kumar A, Pauschinger M, Liu P. International Consensus Group on Cardiovascular Magnetic Resonance in M. Cardiovascular magnetic resonance in myocarditis: A JACC White Paper. Journal of the American College of Cardiology. 2009;53(17):1475–1487. - PMC - PubMed
    1. Verhaert D, Thavendiranathan P, Giri S, Mihai G, Rajagopalan S, Simonetti OP, Raman SV. Direct T2 quantification of myocardial edema in acute ischemic injury. JACC Cardiovascular imaging. 2011;4(3):269–278. - PMC - PubMed
    1. Usman AA, Taimen K, Wasielewski M, McDonald J, Shah S, Giri S, Cotts W, McGee E, Gordon R, Collins JD, Markl M, Carr JC. Cardiac magnetic resonance T2 mapping in the monitoring and follow-up of acute cardiac transplant rejection: a pilot study. Circulation Cardiovascular imaging. 2012;5(6):782–790. - PubMed
    1. Payne AR, Casey M, McClure J, McGeoch R, Murphy A, Woodward R, Saul A, Bi X, Zuehlsdorff S, Oldroyd KG, Tzemos N, Berry C. Bright-blood T2-weighted MRI has higher diagnostic accuracy than dark-blood short tau inversion recovery MRI for detection of acute myocardial infarction and for assessment of the ischemic area at risk and myocardial salvage. Circulation Cardiovascular imaging. 2011;4(3):210–219. - PubMed

Publication types