. 2015 Mar 10;10(9):1599-1613.
doi: 10.1016/j.celrep.2015.02.014. Epub 2015 Mar 5.

ErbB2 Pathway Activation upon Smad4 Loss Promotes Lung Tumor Growth and Metastasis

Affiliations

ErbB2 Pathway Activation upon Smad4 Loss Promotes Lung Tumor Growth and Metastasis

Jian Liu et al. Cell Rep. .

Abstract

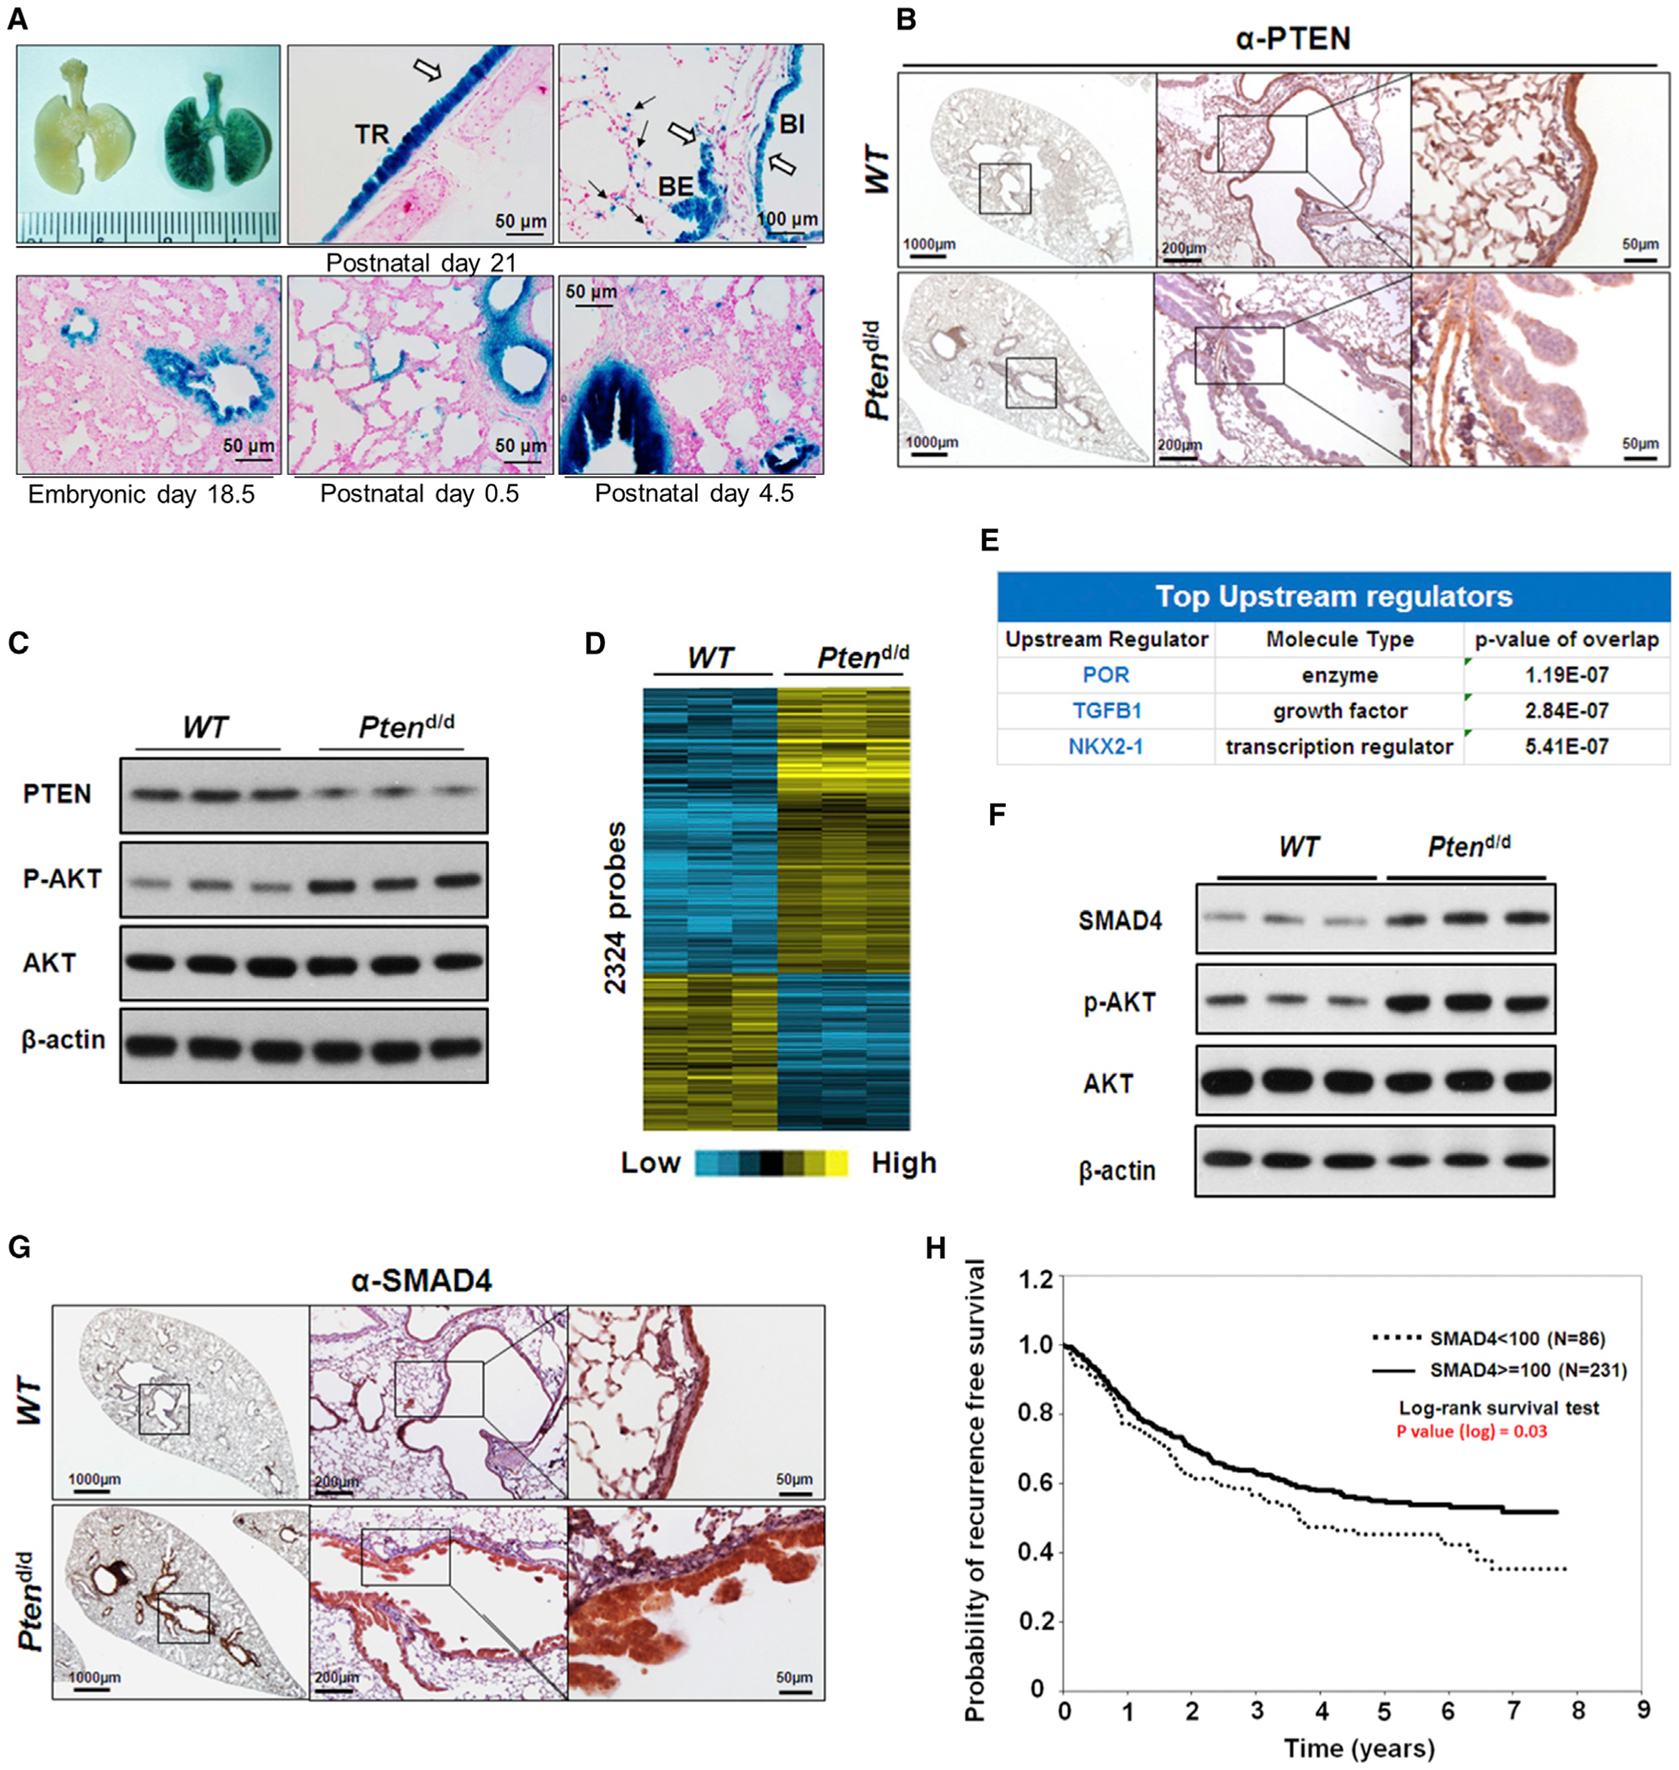
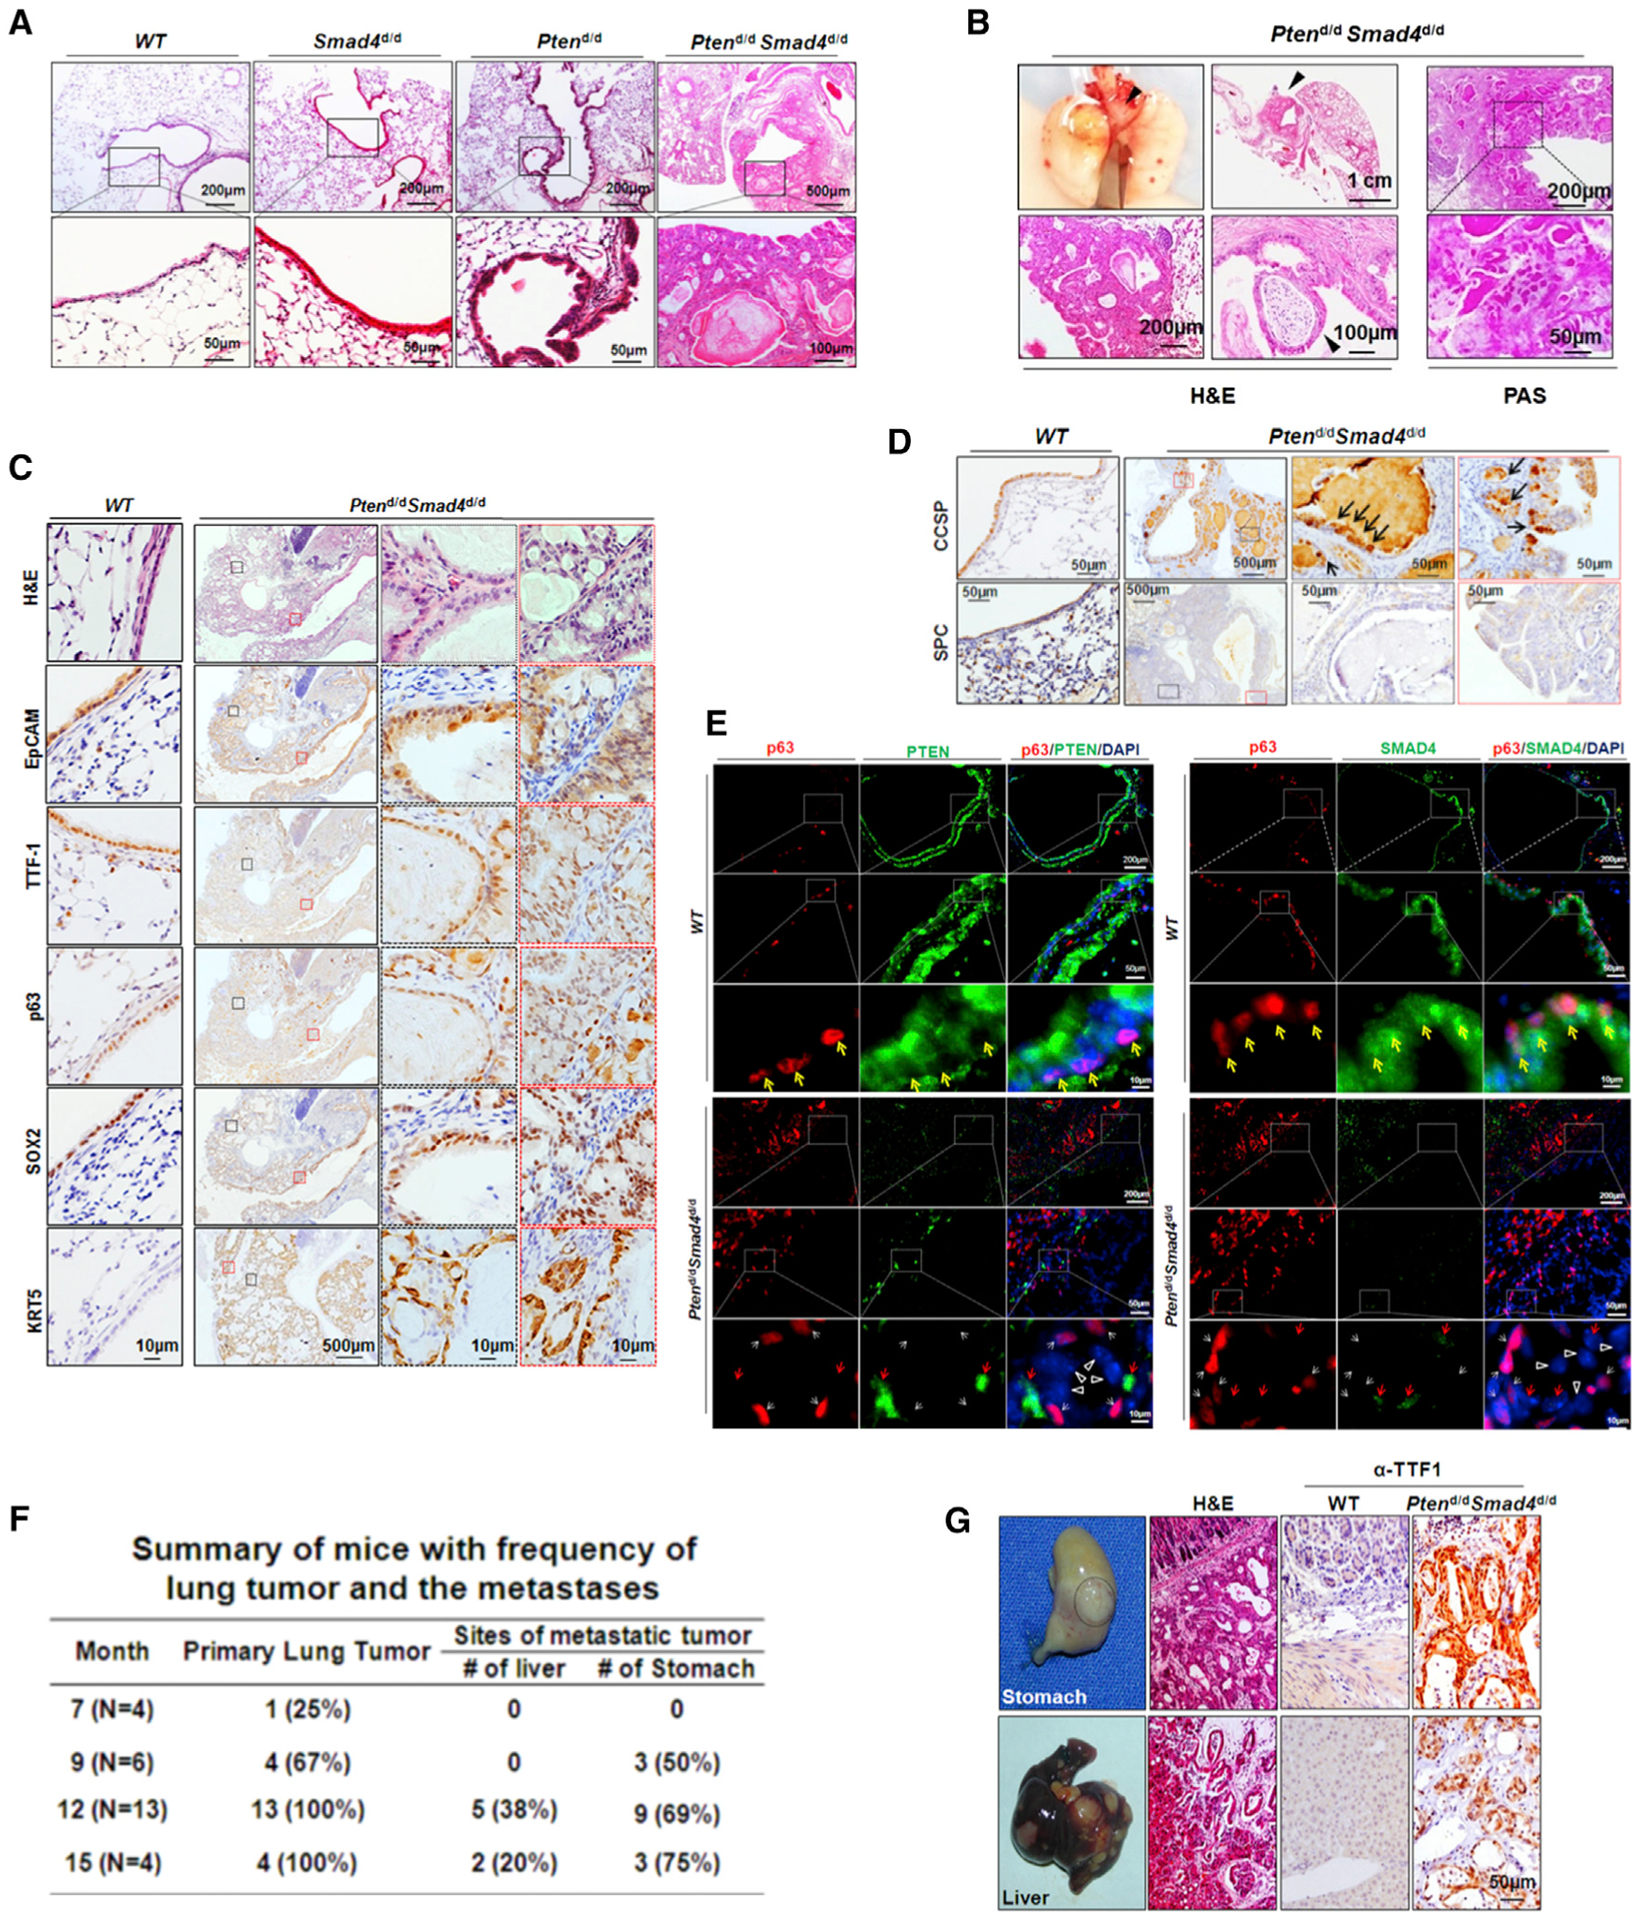
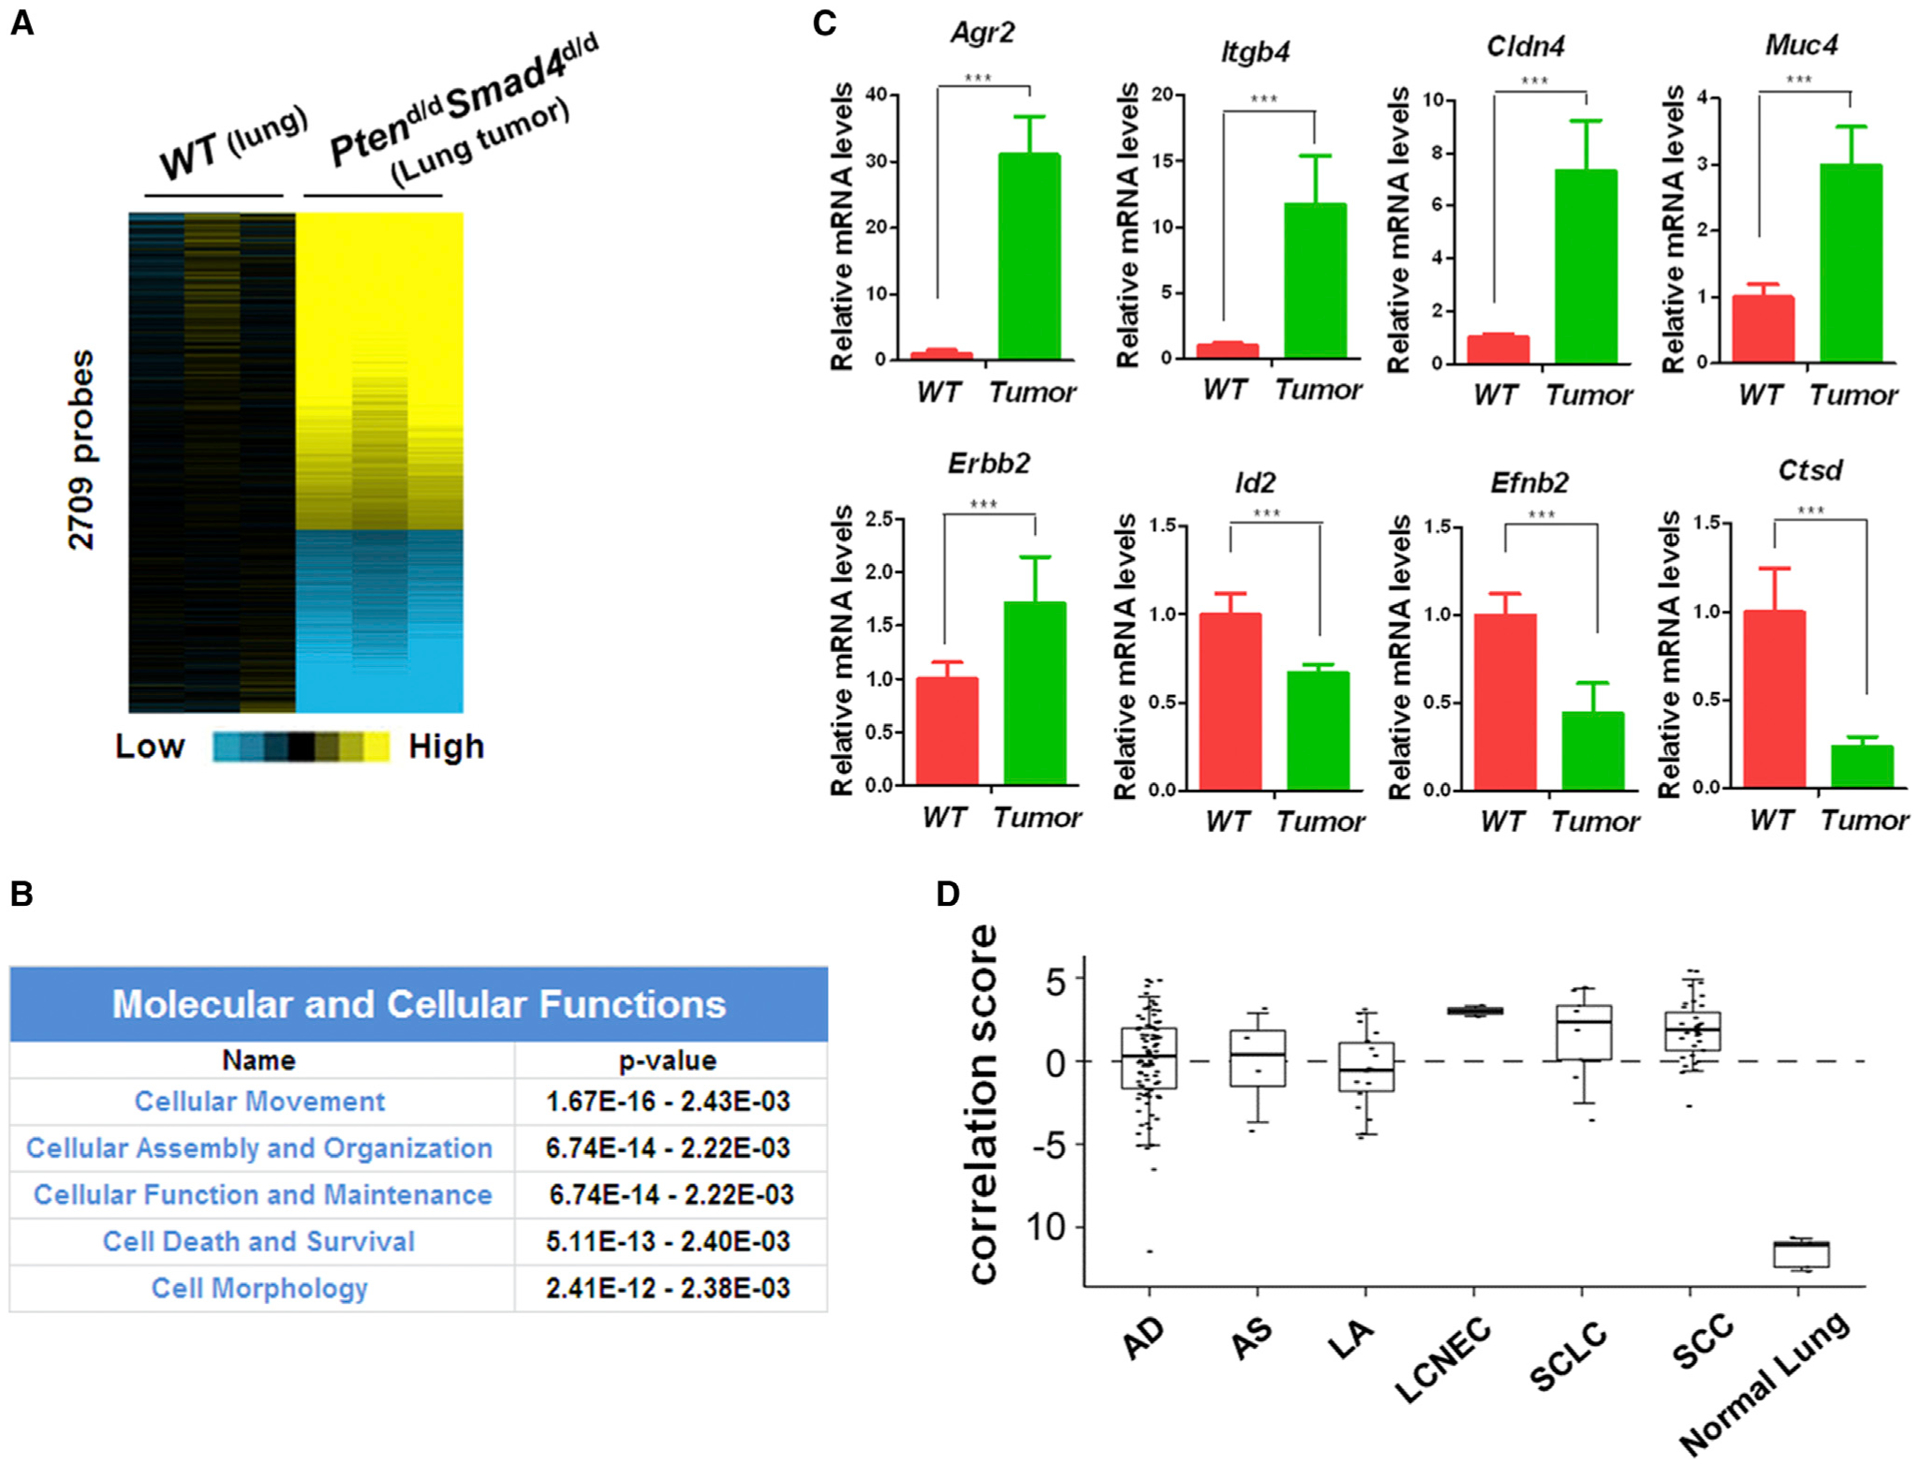
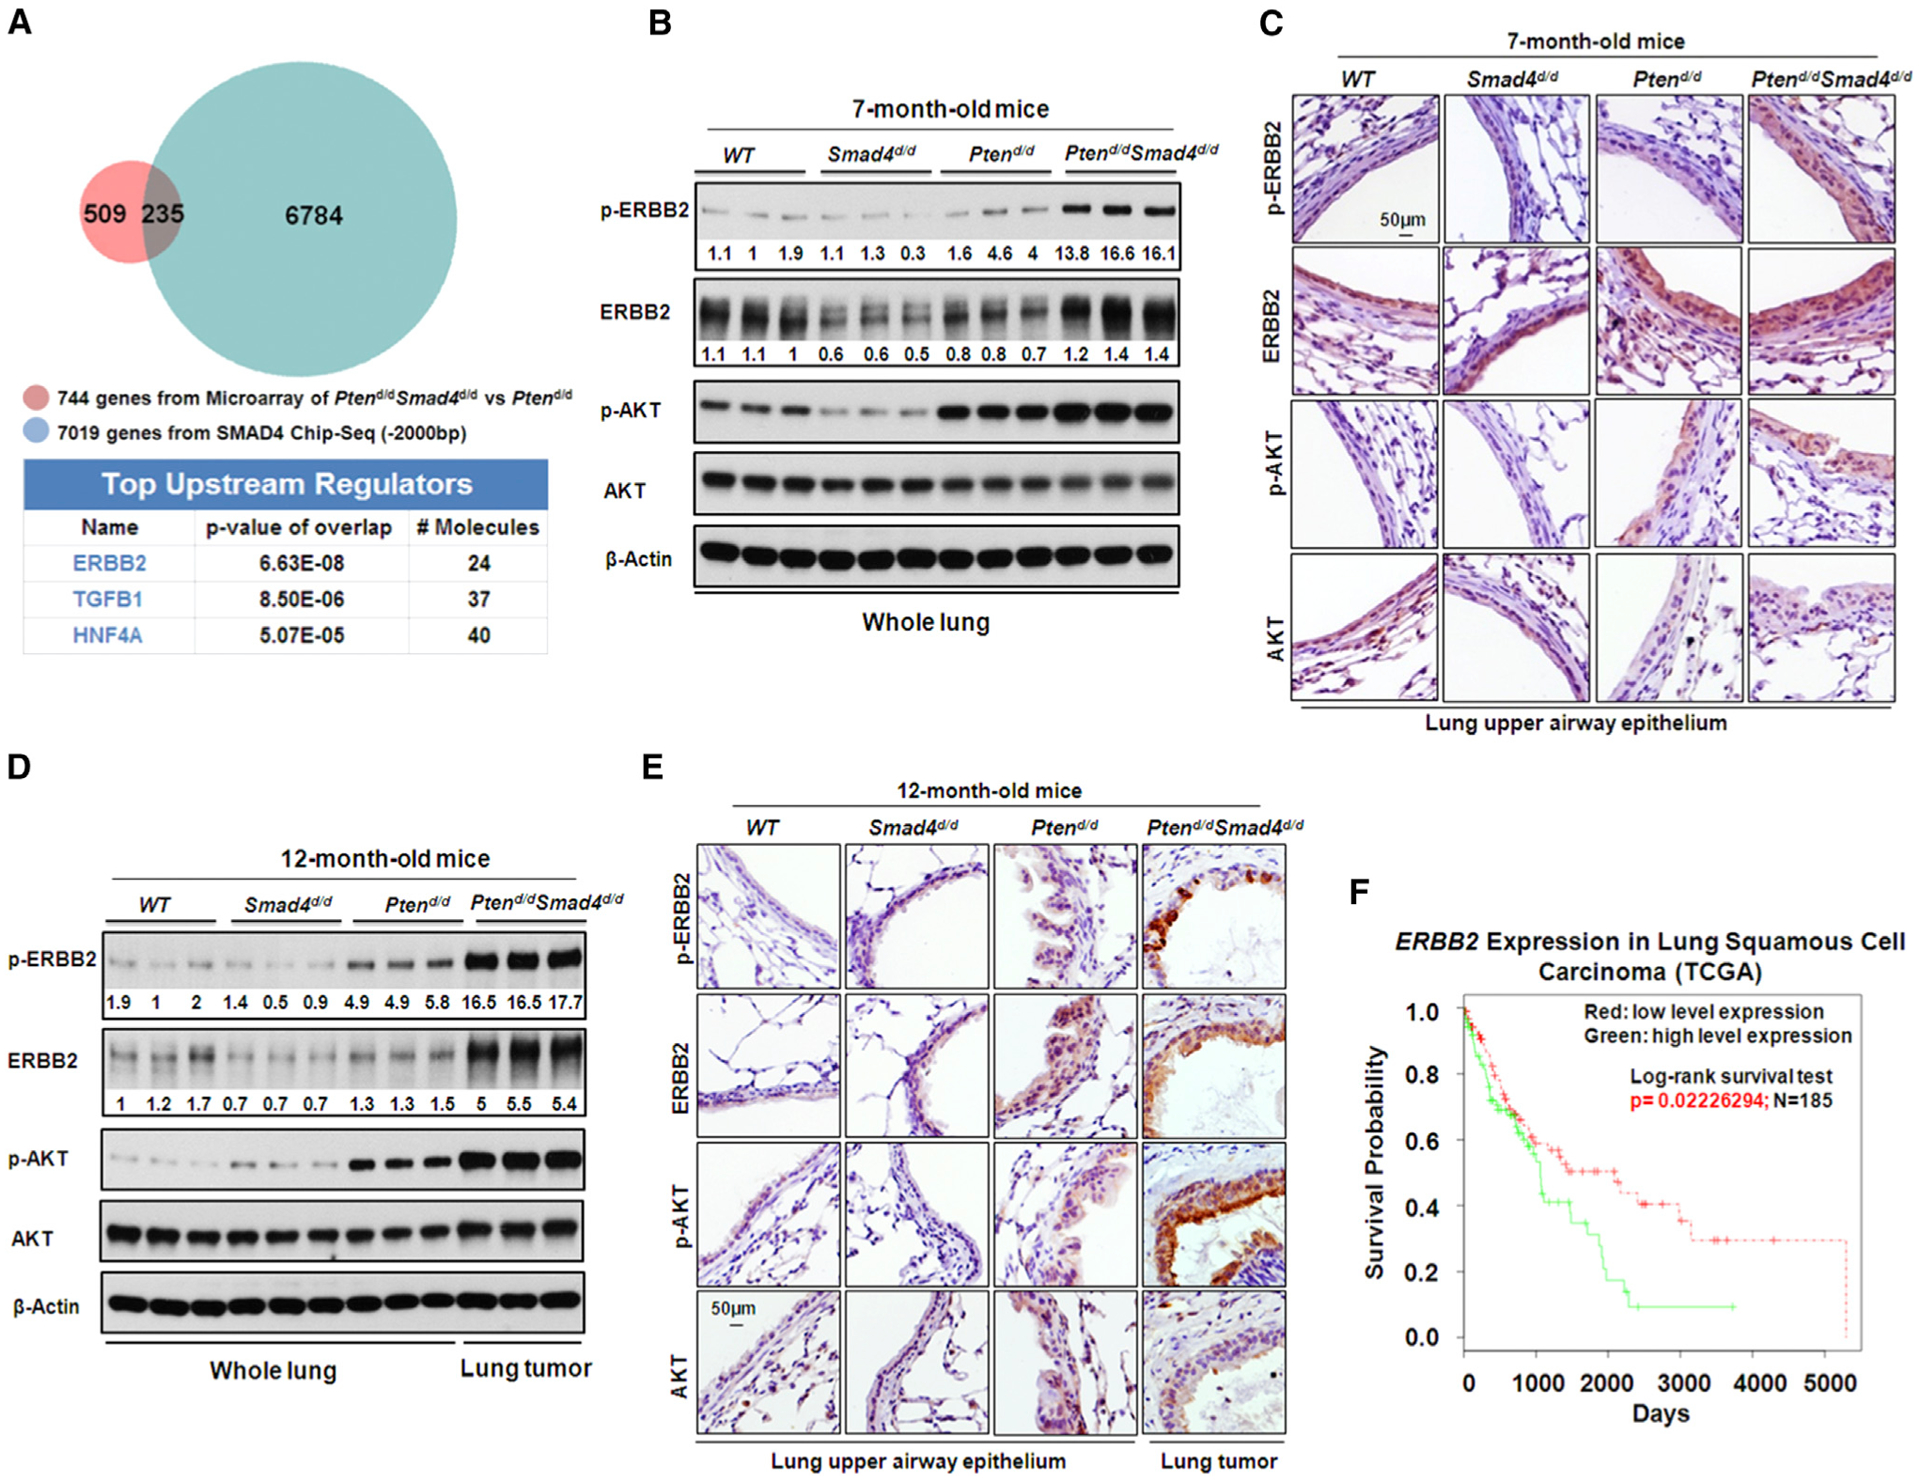
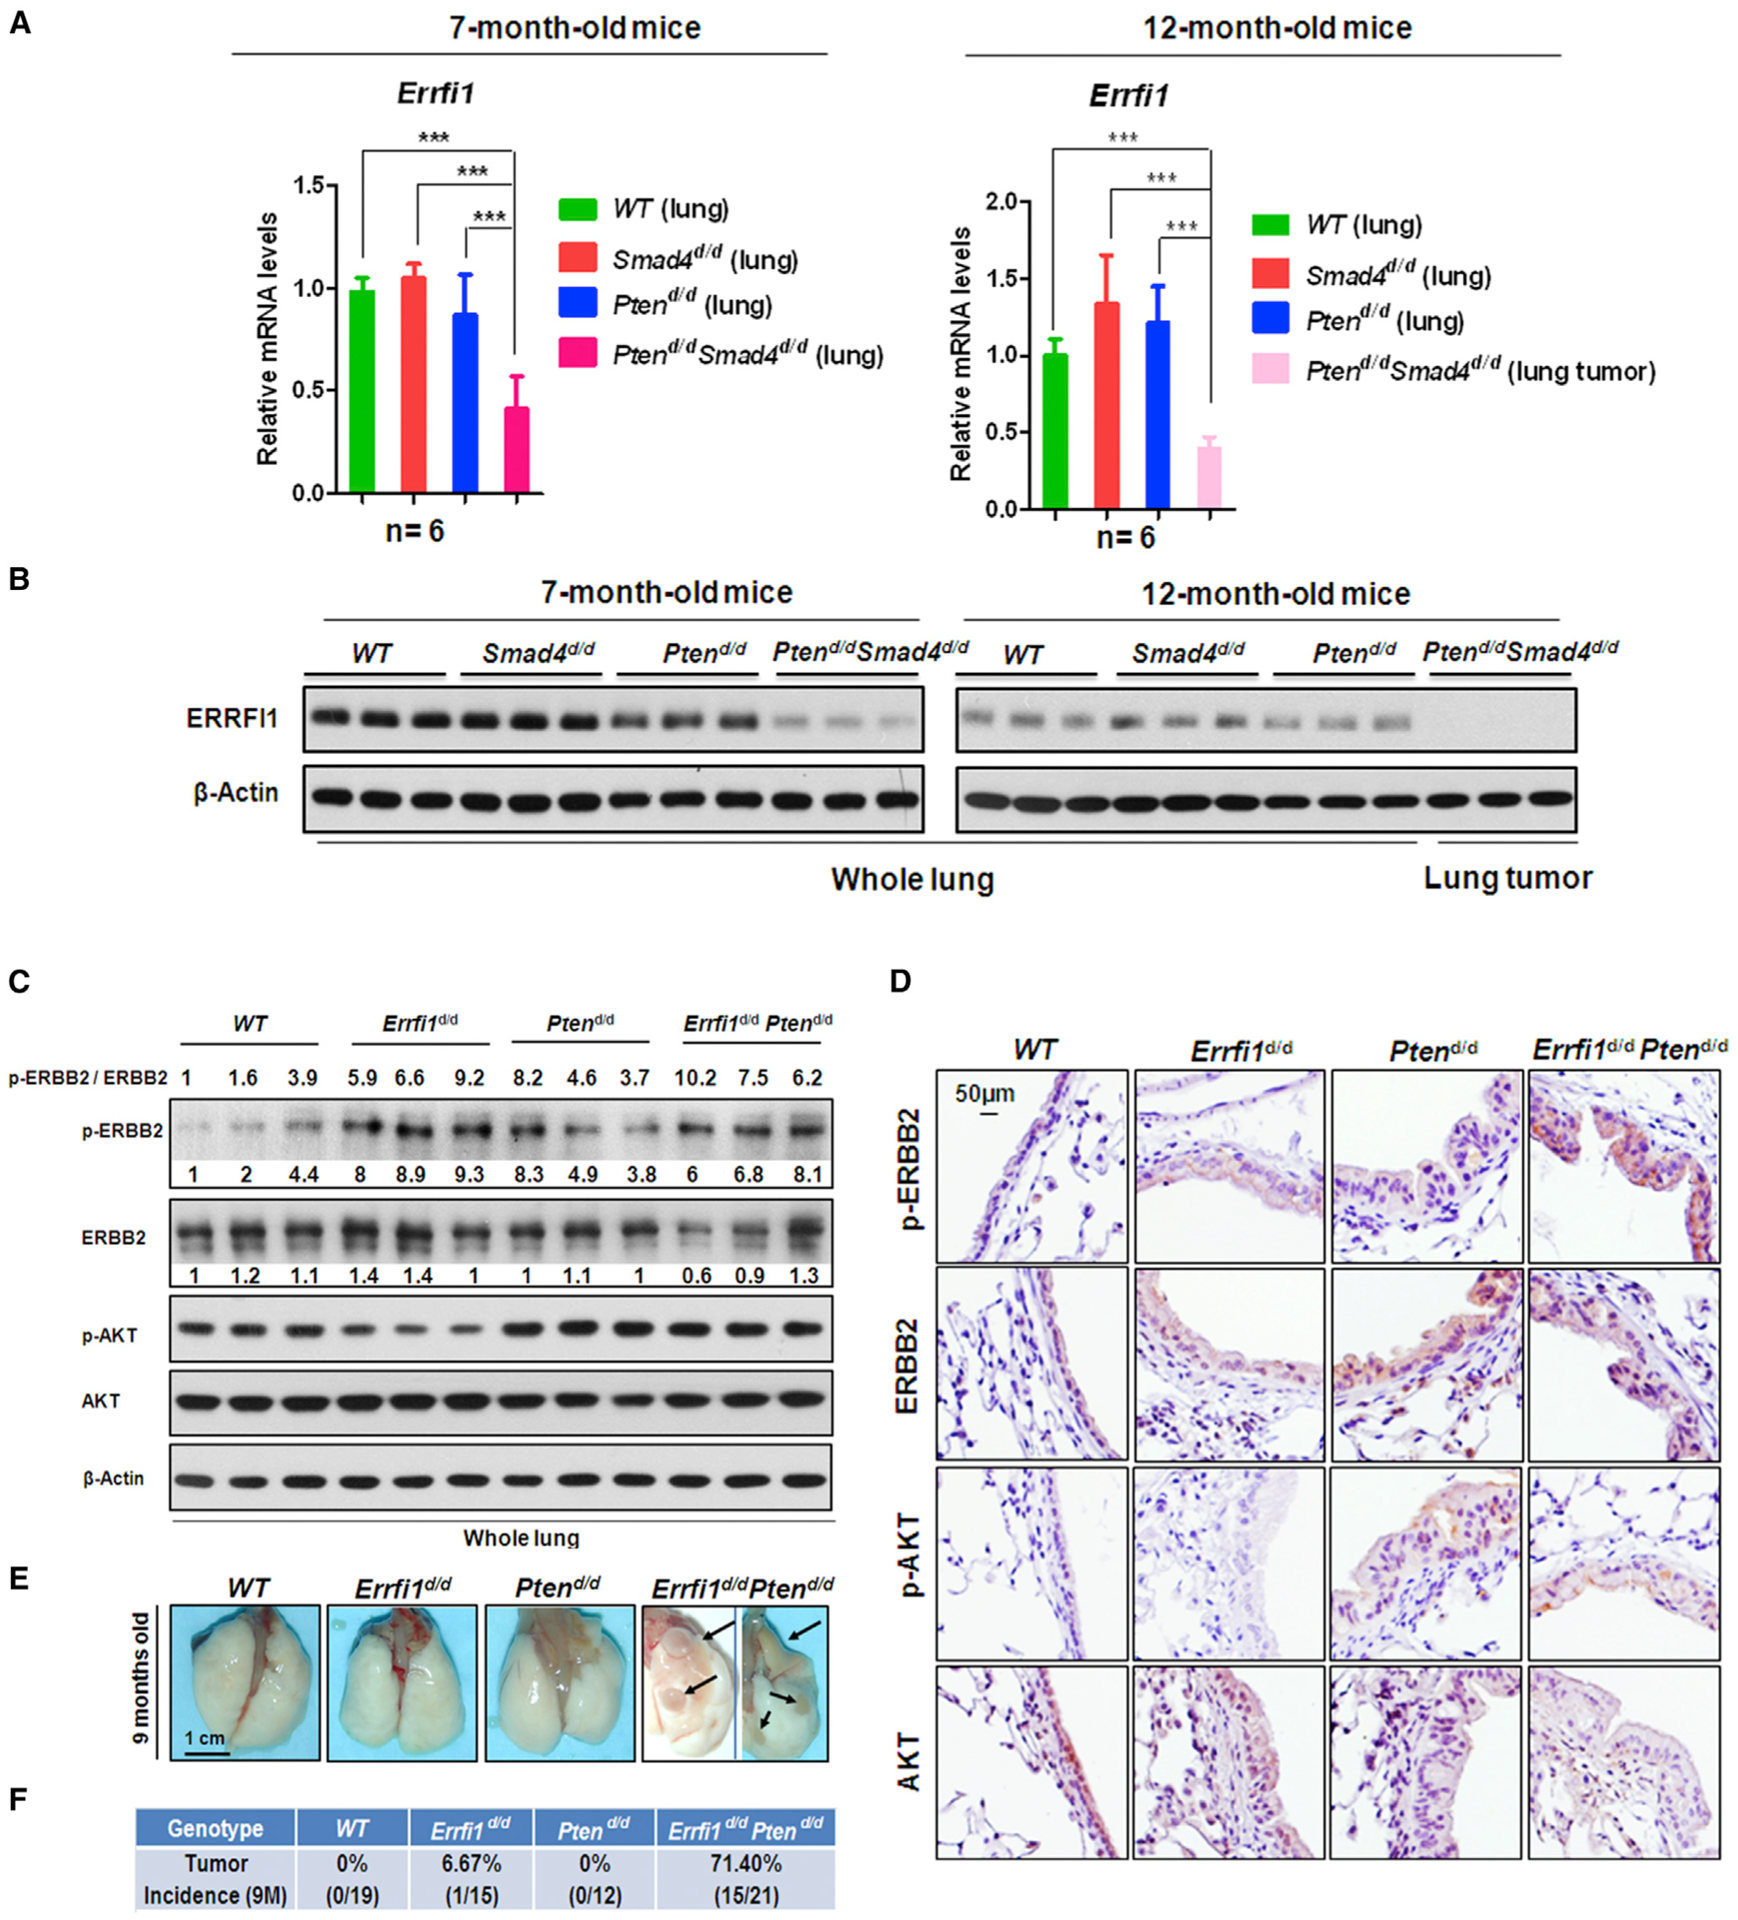
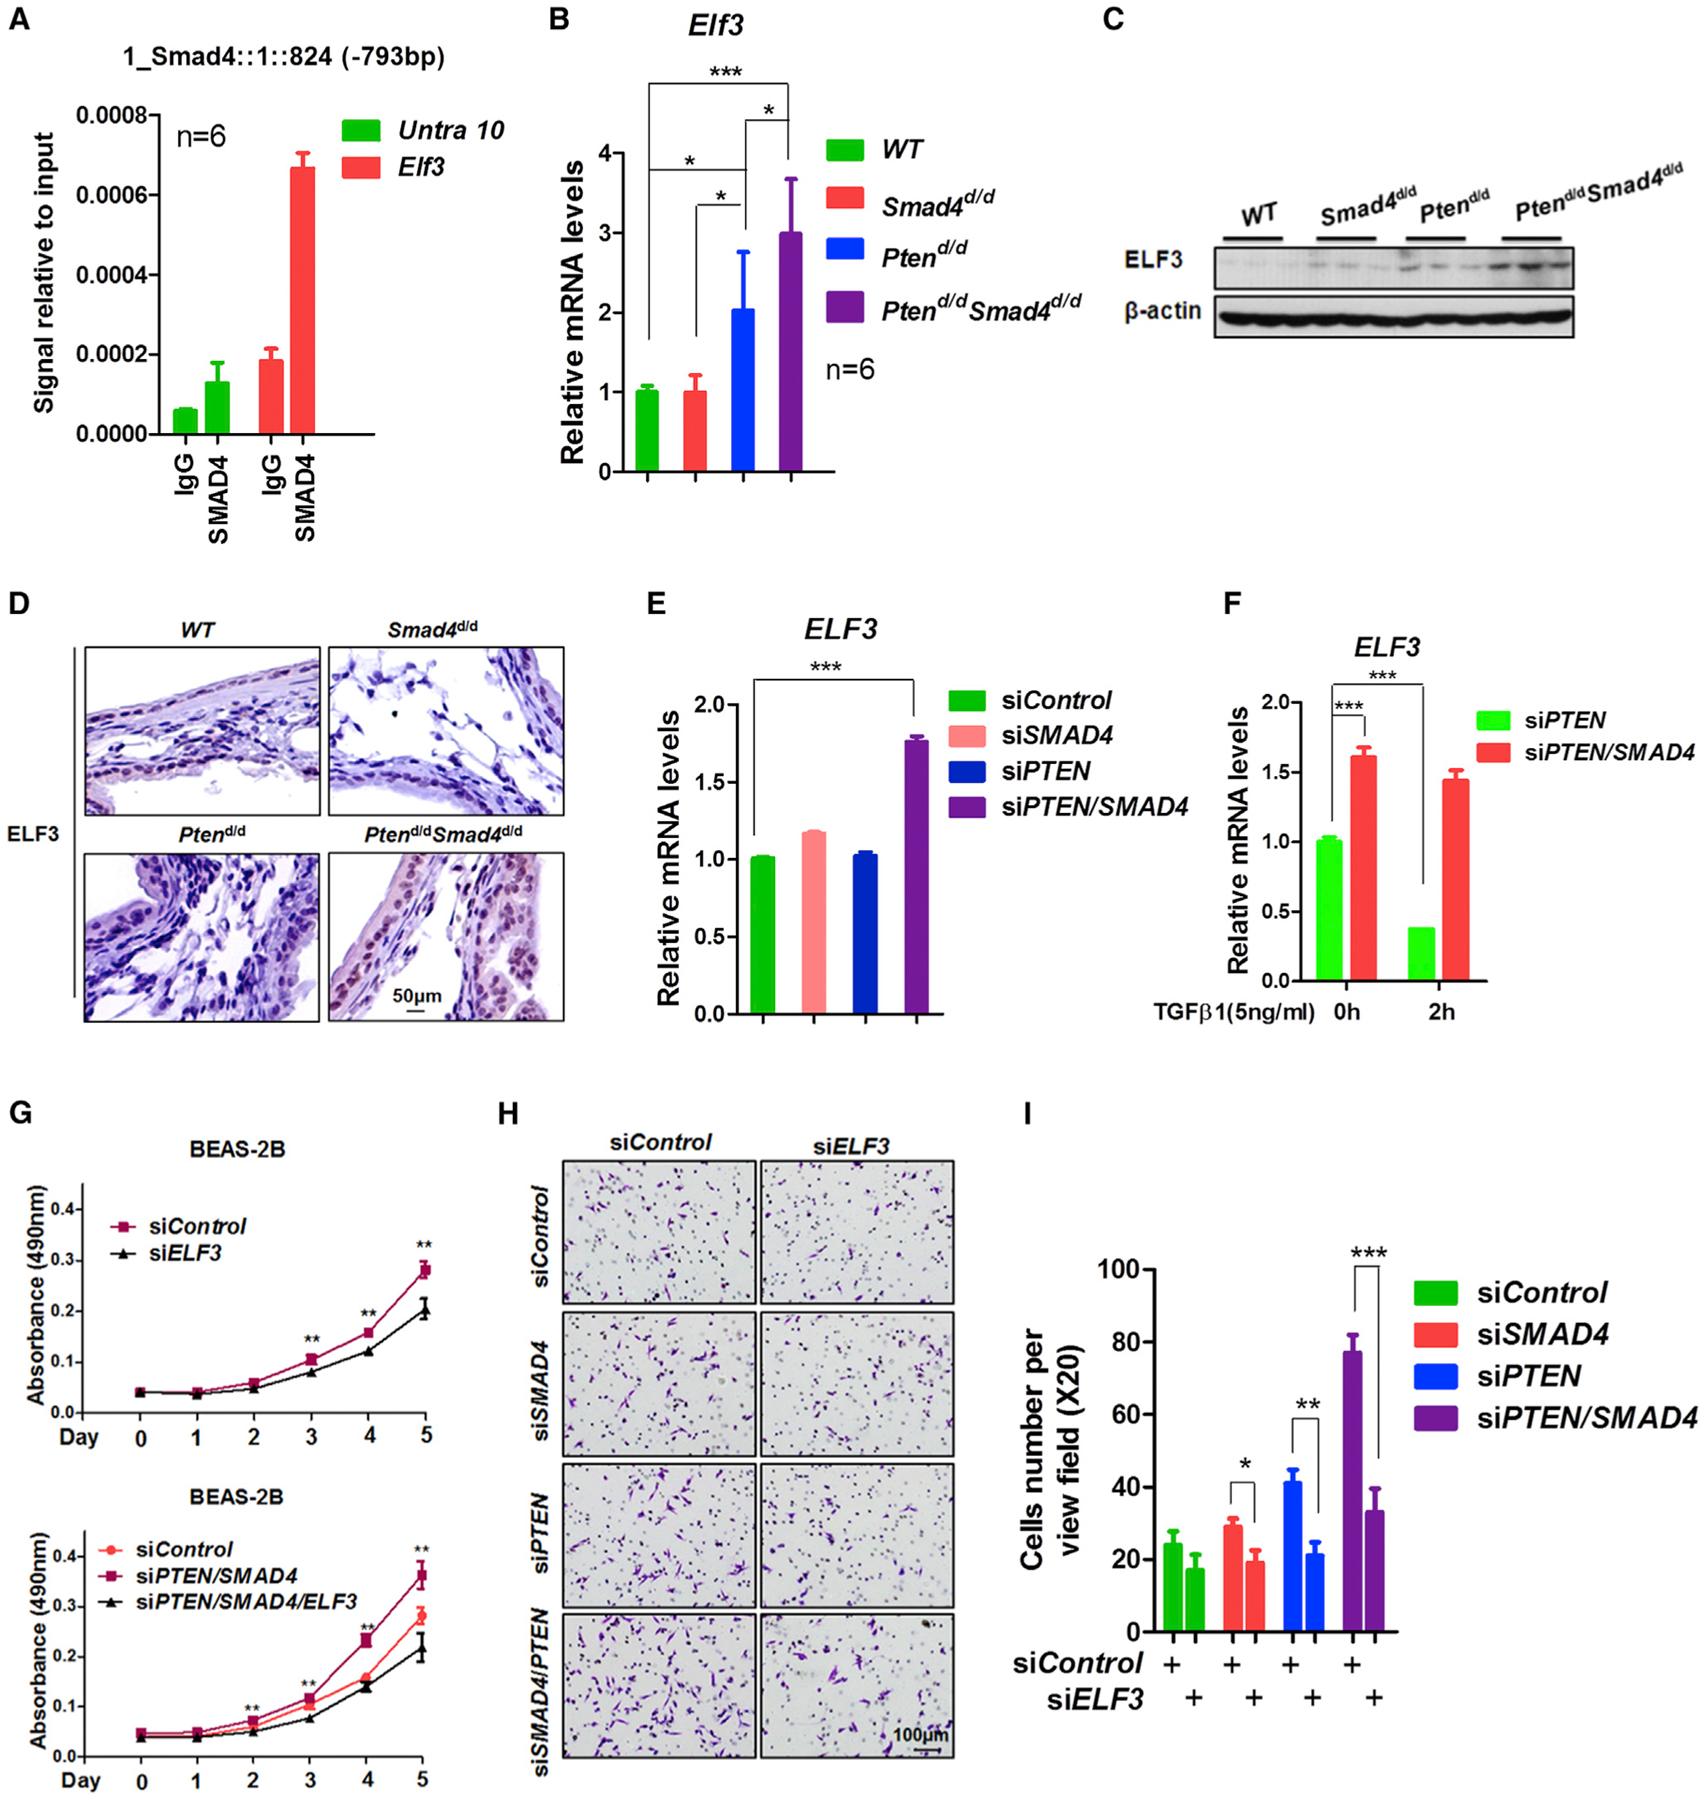
Lung cancer remains the leading cause of cancer death. Genome sequencing of lung tumors from patients with squamous cell carcinoma has identified SMAD4 to be frequently mutated. Here, we use a mouse model to determine the molecular mechanisms by which Smad4 loss leads to lung cancer progression. Mice with ablation of Pten and Smad4 in airway epithelium develop metastatic adenosquamous tumors. Comparative transcriptomic and in vivo cistromic analyses determine that loss of PTEN and SMAD4 results in ELF3 and ErbB2 pathway activation due to decreased expression of ERRFI1, a negative regulator of ERBB2 in mouse and human cells. The combinatorial inhibition of ErbB2 and Akt signaling attenuate tumor progression and cell invasion, respectively. Expression profile analysis of human lung tumors substantiated the importance of the ErbB2/Akt/ELF3 signaling pathway as both a prognostic biomarker and a therapeutic drug target for treating lung cancer.


Figures

Figure 1.
Figure 1.. Deletion of Pten in Mouse Bronchial Epithelial Cells Results in Hyperplasia and Alters TGF-β Signaling
(A) Representative whole-mount X-gal staining of mouse lungs in different stages. The blue X-gal staining showed CCSPiCre expressed in tracheal and bronchial airway epithelial cells in R26R (left) and CCSPiCre/R26R (right) mice (upper panel). The white arrows indicate the blue staining of X-gal in tracheal and bronchial airway epithelial cells and the black arrows indicate the staining of X-gal in the alveolar type II cells; trachea (TR), bronchi (BI), and bronchiole (BE). (B) IHC staining of PTEN in lungs of 7-month-old WT and Ptend/d mice. PTEN staining is strongly present in the epithelium (brown staining) of WT mice and not in the epithelial cells of the Ptend/d mouse lung. (C) WB analysis of PTEN and AKT expression and Akt phosphorylation (p-AKT) in lungs of 7-month-old mice. Increased p-AKT was observed in Ptend/d mouse lungs. (D) The heatmap for the 1,847 differentially regulated genes (2,324 probes) in the microarray analysis of lungs from 7-month-old Ptend/d mice (n = 6) when compared to 7-month-old WT mice (n = 6). (E) IPA of gene microarray data revealed top changed upstream regulators in Ptend/d mice, as compared to WT mice. (F) WB analysis of SMAD4 protein expression in 7-month-old mouse lungs. (G) IHC staining of SMAD4 (brown staining) in 7-month-old WT and Ptend/d mouse lungs. (H) Kaplan-Meier plot of probability of recurrence-free survival based on the cytoplasmic SMAD4 protein expression index in lung cancer patients from SMAD4 tissue array data set.
Figure 2.
Figure 2.. Deletion of Smad4 in the Pten-Null Background Promotes Tumor Growth and Metastasis
(A) H&E staining analysis of 9-month-old mouse lungs. Boxed areas are magnified in the panels directly below. (B) H&E and PAS staining analysis of primary lung tumors from 9-month-old Ptend/dSmad4d/d mice. Primary lung tumors are indicated by black arrows. (C) IHC staining of WT and Ptend/dSmad4d/d mouse lung tumors for p63, SOX2, KRT5, TTF1, and EpCAM. The regions labeled by black or red dash boxes are representative tumor epithelium magnified in adjacent panels. (D) IHC staining of CCSP, the marker for Club cells, and of SPC, the marker for type II alveolar cells, on WT and Ptend/dSmad4d/d mouse lungs. The regions labeled by black or red dash boxes are representative tumor epithelium magnified in adjacent panels. (E) Immunofluorescence staining of p63 and PTEN (left panel) or SMAD4 (right panel) in WT mouse lungs and Ptend/dSmad4d/d mouse tumors. Yellow arrows indicate the cells coexpressing p63 and PTEN/SMAD4; white arrows indicate the cells only expressing p63; red arrows indicate the cells only expressing PTEN/SMAD4; white triangles indicate the cells expressing neither p63 nor PTEN/SMAD4. (F) Summary of Ptend/dSmad4d/d mice with frequency of lung tumor and metastases as it relates to age. (G) Metastases in the stomach and liver from primary lung tumors. TTF1, a marker for the diagnosis of metastatic tumor from the lung, was positive in the stomach and liver.
Figure 3.
Figure 3.. Lung Tumor from Ptend/dSmad4d/d Mice Correlates Strongly with Human Lung Cancers
(A) The heatmap for the 2,128 differentially regulated genes (2,709 probes) in the microarray analysis of lung tumors from 12-month-old Ptend/dSmad4d/d mice (n = 3) when compared to lungs from 12-month-old WT mice (n = 3). (B) Top molecular and cellular functions identified by IPA of the gene microarray data from lung tumors of Ptend/dSmad4d/d mice, in comparison with that of WT mouse lungs. (C) Quantitative real-time PCR analysis of some of these significantly altered genes related to cell movement in the microarray (Student’s t test, p value is ***p < 0.001). Three lungs of WT mice and three lung tumors of Ptend/dSmad4d/d mice were analyzed. (D) Alignment of the gene signature of our Ptend/dSmad4d/d mouse tumors with the Takeuchi lung cancer database (GSE11969). A score greater than zero represents a positive correlation with the murine gene signature. This data set encompasses expression profiles in 149 patients with NSCLC, nine patients with SCLC, and five patients with normal lung tissue. AD (n = 90, adenocarcinoma), AS (n = 4, adenosquamous carcinoma, LA (n = 18, large-cell carcinoma), and LCNEC (n = 2, large-cell neuroendocrine carcinoma). SCLC (n = 9, small cell lung cancer), SCC (n = 35, squamous cell lung cancer), and normal lung tissue (n = 5). Boxplot represents 5%, 25%, 75%, median, and 95%.
Figure 4.
Figure 4.. Deletion of Smad4 in Pten-Null Background Activates the ErbB2/Akt Signaling
(A) Top changed upstream regulators identified by IPA of the intersection genes between gene microarray data set and SMAD4 ChIP-seq data set. (B and C) WB (B) and IHC (C) analyses of protein expression and phosphorylation of the ERBB2/AKT signaling pathway in 7-month-old mouse lungs. p-ERBB2, ERBB2 phosphorylation. p-AKT, AKT phosphorylation. Number below each protein band indicates the relative band intensity (signal) measured by ImageJ software (NIH). (D and E) IHC (D) and WB analyses (E) of protein expression and phosphorylation of ERBB2/AKT signaling pathway in 12-month-old mouse lungs and lung tumors. Number below each protein band indicates the relative band intensity (signal) measured by ImageJ software (NIH). (F) Kaplan-Meier plot of survival probability based on the ERBB2 mRNA expression index in squamous cell lung carcinoma patients from TCGA data set. The mean expression value of ERBB2 across all investigated patients was calculated. Patients with ERBB2 expression higher than mean ERBB2 expression were classified into the ERBB2 high group, while patients with ERBB2 expression lower than mean ERBB2 expression were classified into the ERBB2 low group.
Figure 5.
Figure 5.. Blockade of ErbB2/Akt Signaling Pathway Inhibits Tumor Growth Induced by Pten/Smad4 Deficiency
(A) Two chamber invasion assays of Beas-2B cells with knockdown of PTEN and SMAD4 (siSMAD4/PTEN) and the treatment of kinase inhibitors as indicated. (B) Quantification of the results (A) using one-way ANOVA (p value is *p < 0.05, **p < 0.01, ***p < 0.01). (C–G) Inhibition of tumor formation in 9-month-old Ptend/dSmad4d/d mice the treatment of kinase inhibitors. Representative whole-lung images and H&E staining of lung tissues in WT and Ptend/dSmad4d/d mice are shown in (C). Quantitative analysis of tumor growth in Ptend/dSmad4d/d mice with or without the treatment of kinase inhibitors is shown in (D)–(G). Statistical analysis was performed using one-way ANOVA (p value is *p < 0.05, **p < 0.01, ***p < 0.01) on the ratio of whole lung to whole body and using Student’s t test (p value is **p < 0.01) on the maximal diameter and the number of surface tumors. Black arrows indicate lung tumors.
Figure 6.
Figure 6.. Errfi1, a Negative Regulator of ErbB2 Signaling, Plays Critical Roles in Tumor Progression in the Pten-Null Background
(A and B) Quantitative real-time PCR (A) and WB (B) analyses of Errfi1 expression level in mouse lungs and lung tumors. (C and D) WB (C) and IHC (D) analyses of p-ERBB2/ERBB2 and p-AKT/AKT signaling in 9-month-old mouse lungs. (E and F) Primary lung tumors were observed in the Errfi1d/dPtend/d mouse lungs. (E) The primary lung tumors are indicated by black arrows. (F) Summary of Errfi1d/dPtend/d mice with frequency of lung tumor.
Figure 7.
Figure 7.. ELF3 Is a Novel Target Gene of the ErbB2 Pathway and Is Directly Regulated by SMAD4 in PTEN-Null or -Low Background
(A) ChIP-qPCR analysis of SMAD4 binding on the Elf3 promoter region in 7-month-old Ptend/d mouse lungs. The primers for Untra 10 are targeted on the untranslated region 10. (B–D) Quantitative real-time PCR (B), WB (C), and IHC (D) analyses of Elf3 expression in 7-month-old mouse lungs. (E) Quantitative real-time PCR analysis of ELF3 mRNA expression in BEAS-2B cells after knockdown of PTEN and/or SMAD4. (F) Quantitative real-time PCR analysis of the ELF3 mRNA expression in BEAS-2B cells with the knockdown of PTEN and SMAD4 and with or without the treatment of TGF-β1. Statistical analysis was performed using one-way ANOVA (p value is *p < 0.05, **p < 0.01, and ***p < 0.001). (G) MTT assay of cell viability in Beas-2B cells after the knockdown of PTEN, SMAD4, and ELF3. Statistical analysis was performed using Student’s t test (p value is **p < 0.01). (H and I) Two-chamber invasion assay of Beas-2B cells after knockdown of PTEN, SMAD4, and/or Elf3. Representative images of cell invasion are shown in (H), and quantitation of cell invasion is shown in (I). Statistical analysis was performed using Student’s t test (p value is *p < 0.05, **p < 0.01, ***p < 0.01).

References

    1. Ahmad I, Patel R, Singh LB, Nixon C, Seywright M, Barnetson RJ, Brunton VG, Muller WJ, Edwards J, Sansom OJ, and Leung HY (2011). HER2 overcomes PTEN (loss)-induced senescence to cause aggressive prostate cancer. Proc. Natl. Acad. Sci. USA 108, 16392–16397. - PMC - PubMed
    1. Anastasi S, Sala G, Huiping C, Caprini E, Russo G, Iacovelli S, Lucini F, Ingvarsson S, and Segatto O (2005). Loss of RALT/MIG-6 expression in ERBB2-amplified breast carcinomas enhances ErbB-2 oncogenic potency and favors resistance to Herceptin. Oncogene 24, 4540–4548. - PubMed
    1. Arcila ME, Chaft JE, Nafa K, Roy-Chowdhuri S, Lau C, Zaidinski M, Paik PK, Zakowski MF, Kris MG, and Ladanyi M (2012). Prevalence, clinicopathologic associations, and molecular spectrum of ERBB2 (HER2) tyrosine kinase mutations in lung adenocarcinomas. Clin. Cancer Res 18, 4910–4918. - PMC - PubMed
    1. Cancer Genome Atlas Research Network (2012). Comprehensive genomic characterization of squamous cell lung cancers. Nature 489, 519–525. - PMC - PubMed
    1. Cancer Genome Atlas Research Network (2014). Comprehensive molecular profiling of lung adenocarcinoma. Nature 511, 543–550. - PMC - PubMed