. 2015 Mar 10:5:8920.
doi: 10.1038/srep08920.

Visualization of synaptic domains in the Drosophila brain by magnetic resonance microscopy at 10 micron isotropic resolution

Affiliations

Visualization of synaptic domains in the Drosophila brain by magnetic resonance microscopy at 10 micron isotropic resolution

Choong H Lee et al. Sci Rep. .

Abstract

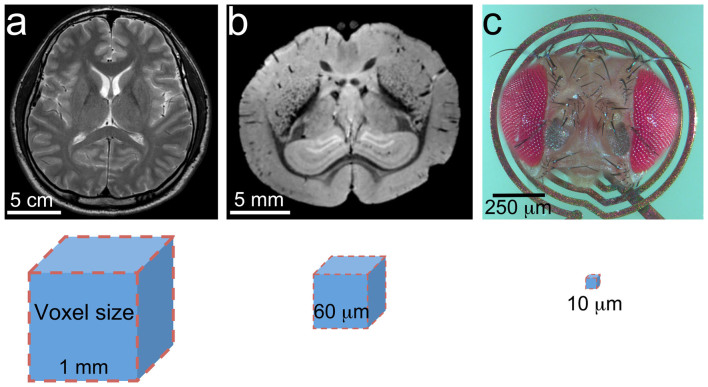
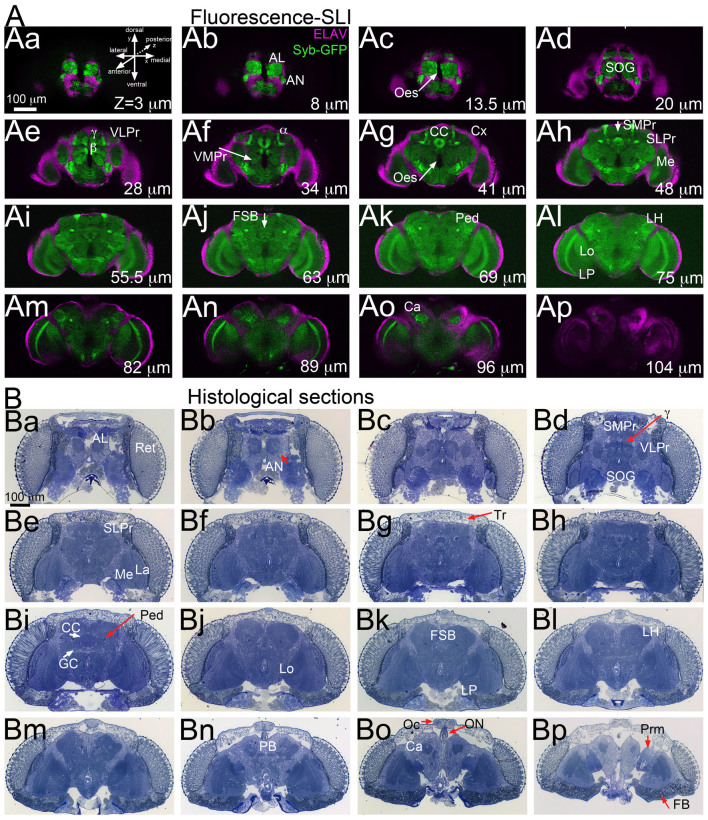
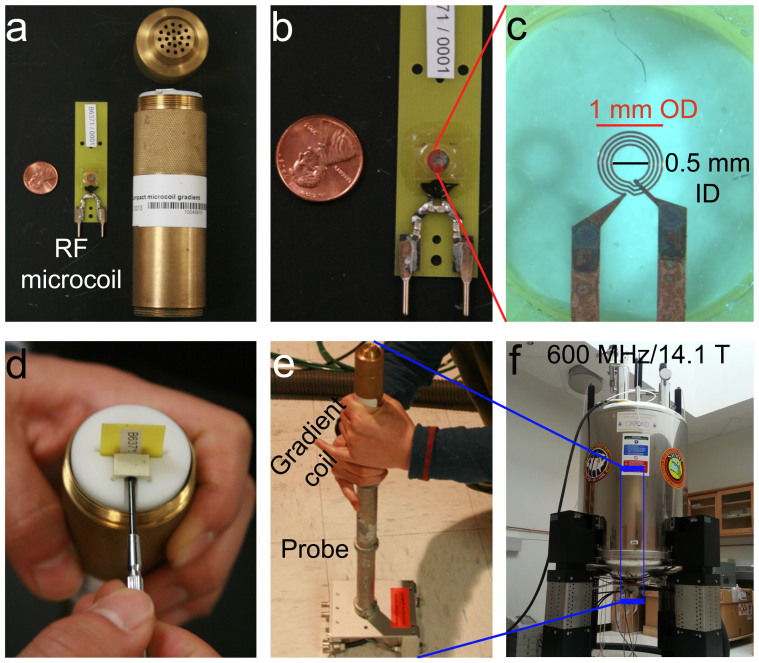
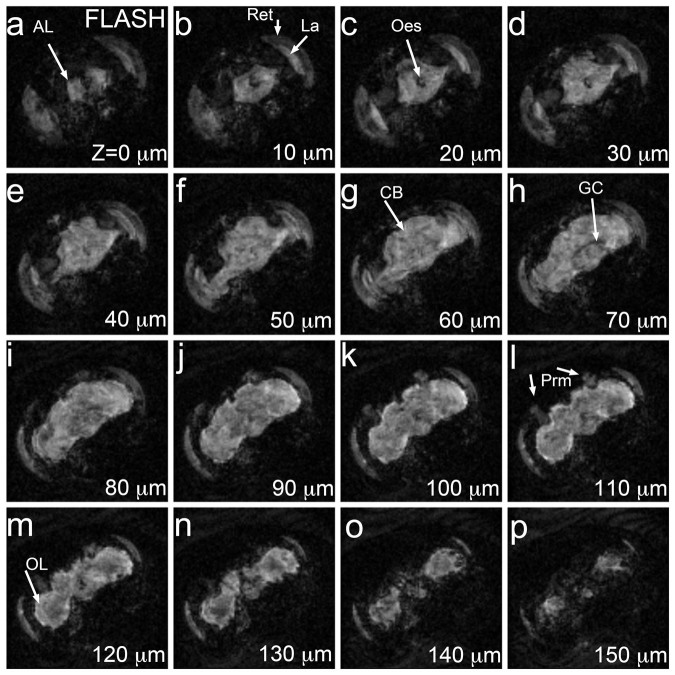
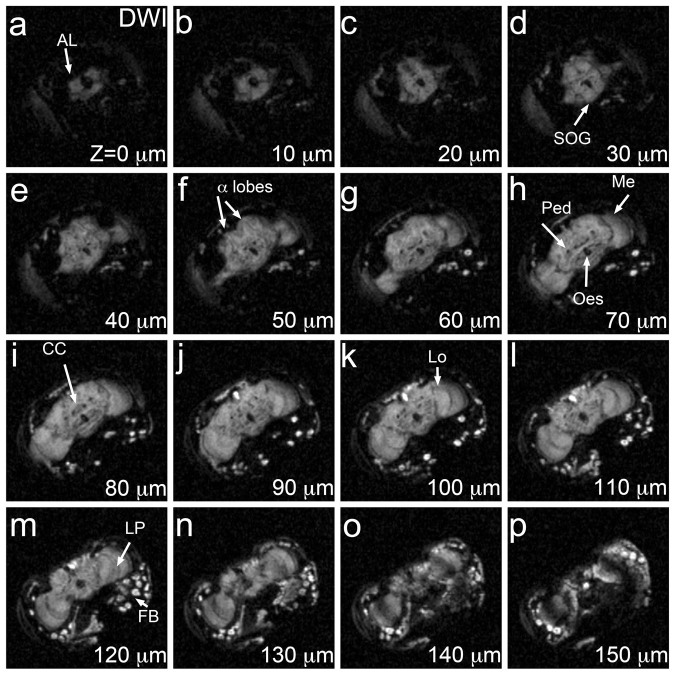
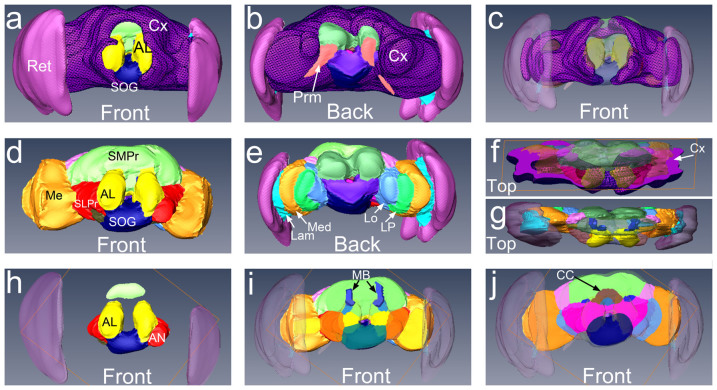
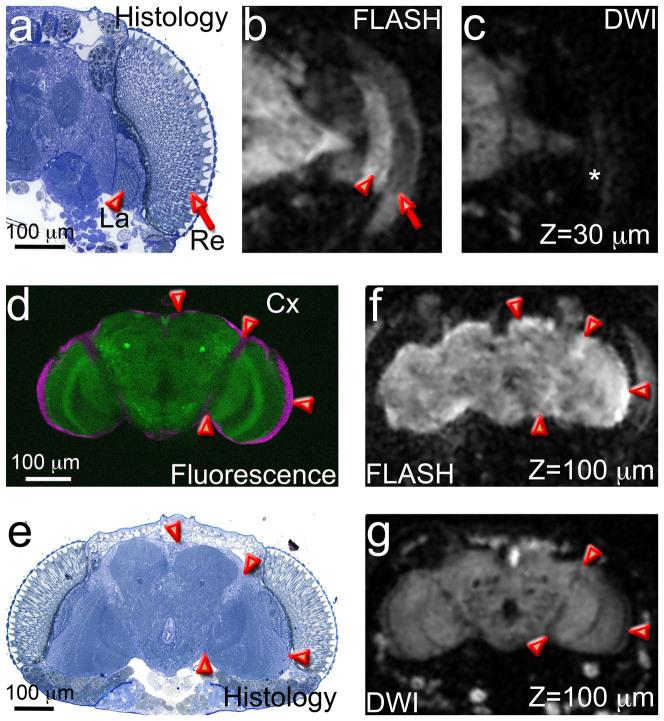
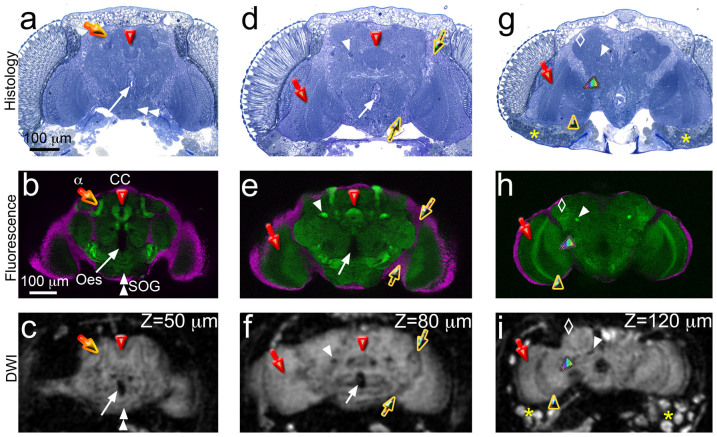
Understanding the complex architecture, connectivity, and pathology of the human brain is a major application of magnetic resonance imaging (MRI). However, the cellular basis of MR signal is still poorly understood. The advent of MR microscopy (MRM) enables imaging biological samples at cellular resolution, helping to interpret the nature of MR signal at the cellular level. In this regard, the small Drosophila brain can reveal key aspects of MR signal through the visualization of complex, intact neuronal structures in their native spatial arrangement. Applying state-of-the-art MR technology, we imaged fixed Drosophila heads at 10 μm isotropic resolution by two endogenously contrasted MRM sequences. The improved MRM sensitivity described here delivered the highest 3D resolution of an intact animal head reported so far. 3D fast low angle shot (FLASH) revealed strong signal in most internal tissues, particularly in the brain cortex, which contains the cell bodies of neurons and glia. Remarkably, 3D diffusion weighted imaging (DWI) delivered unprecedented contrast within the modular brain neuropil, revealing hyperintense signal in synapse-rich microdomains. Thus, the complex Drosophila brain revealed unknown features of FLASH and DWI with potential applications in characterizing the structure and pathology of the mammalian brain.


Figures

Figure 1
Figure 1. Illustration providing a general representation of the scales of MR imaging between mammalian and fly brains.
(a) Human brain imaged at 1 mm resolution as indicated by voxel size. (b) Mouse brain imaged at 60 μm. (c) Drosophila head on an RF microcoil prepared for imaging at 10 μm. Voxel sizes not shown at scale.
Figure 2
Figure 2. Drosophila brains imaged by optical microscopy.
(A) Frontal optical sections of a fluorescent brain imaged by structured light imaging (SLI). Fly brains expressing synaptic-bound GFP (Syb-GFP), green in all neurons under the control of Elav-Gal4 display green signal throughout the neuropil. The signal of Syb-GFP enables the identification of several brain centers and axonal paths. The anti-Elav antibody (magenta) labels the nuclei of all neurons in the cortex, surrounding both the central brain and the optic lobes. (B) Frontal serial semi-thin sections (1 μm thick) of a whole head stained with toluidine blue. The intensity of the staining reflects the underlying organization of different brain regions, with the darker blue indicating compact axonal branches (ped) and synaptic microdomains (MB, EB). Depth of selected optical sections is indicated in μm, from anterior to posterior. α, β, γ: mushroom body lobes; AL: antennal lobe; AN: antennal nerve; Ca: calyx; CC: central complex; Cx: cortex; FB: fat bodies; FSB: fan-shaped body; GC: giant commissure; La: lamina; LH: lateral horn; Lo: lobula; Lp: lobula plate; Me: medulla; Oc: ocelli; Oes: oesophagus; ON: ocellar nerve; Ped: pedunculus; Prm: posterior retractor muscle; Ret: retina; SMPr; superior-medial protocerebrum; SLPr: superior-lateral protocerebrum; SOG: suboesophageal ganglion; Tr: trachea; VLPr: ventro-lateral protocerebrum; VMPr: ventro-medial protocerebrum. The orientation of all the brain series is indicated in in panel Aa.
Figure 3
Figure 3. The MRM hardware: magnet, gradient coils, and RF microcoils.
(a) The RF planar microcoil and the gradient coil. (b) Detail of the RF microcoil showing the position of the sample well. (c) Magnification of the sample well with the planar 500 μm diameter microcoil. (d) Assembly of the RF microcoil inside the gradient coil. (e) and (f) Assembly of the gradient coil into the probe that is inserted vertically into the center of the magnet.
Figure 4
Figure 4. 3D FLASH at 10 μm3 resolution.
3D FLASH along the frontal plane of a fixed Drosophila head. Depth is indicated in μm, starting with the most anterior image. Most internal head structures, including retina, lamina, head muscles, and the entire brain, are hyperintense. From 80 to 130 μm deep, the brain shows a brighter halo in the periphery corresponding to the cortex. Acquisition time was 36 hours. Structures were minimally annotated in these panels to preserve the integrity of the MR images (see figure 2 for abbreviations). CB: central brain; OL: optic lobe. The orientation of these brains is the same as in Fig. 2Aa.
Figure 5
Figure 5. 3D DWI at 10 μm3 resolution.
3D DW MRM of the same Drosophila head. The DW MRM series is slightly darker than FLASH MRM, but provides exquisite contrast in the brain neuropil. Most head structures show low signal, including the retina, the lamina, and the head muscles. But the brain shows fine detail of the modular microarchitecture of the neuropil. Fat bodies in the posterior ventral area appear very bright. Acquisition time was 44 hours. Structures were minimally annotated in these panels to preserve the integrity of the MR images (see figure 2 for abbreviations). The orientation of these brains is the same as in Fig. 2Aa.
Figure 6
Figure 6. A reconstruction of the 3D architecture of the Drosophila brain.
(a) Frontal view of the brain and the eyes. The cell bodies of the cortex are indicated in patterned purple. (b) Posterior view of the brain and the eyes. (c) Frontal view of the cortex with transparent neuropil and retina. (d) Frontal view of the brain neuropil and the eyes. The antennal lobes (yellow) are the anterior most neuropil of the fly brain. (e) Posterior view of the brain neuropil. The different domains of the eye and optic lobes are clearly delineated: retina (purple), lamina (cyan), medulla (orange), lobula plate (green), and lobula (blue). (f) Top view of cortex and neuropil. (g) Top view of the neuropil and eyes. The axonal projections of the mushroom bodies (dark blue) are prominently labeled in the central brain. (h) Simplified frontal view of the brain neuropil showing the antenna lobes (yellow), antennal nerves (red), and suboesophageal ganglion (dark blue). (i) Frontal view of the brain neuropil without the anterior domains. The dorsal projections of the mushroom bodies are indicated in blue, the superior medial protocerebrum in green, and the ventro-lateral protocerebrum in red. (j) Located centrally, we identified the round central complex (light blue and brown). To the sides, we outlined the ventro-medial protocerebrum (pink), to the back the superior-posterior protocerebrum (light green), and lateral to it, the lateral horn (light pink).
Figure 7
Figure 7. Example of FLASH and DWI microimages discriminating different head structures.
(a–c) MRM signal in the retina and the lamina. (a) The fly retina (Re, arrow) is composed of 800 ommatidia, the visual units, containing eight photoreceptors each and surrounded by pigment cells and other support cells. The lamina (La, arrowhead) lies underneath the retina and collects the axonal projections of the photoreceptors into cartridges. (b) In FLASH, the lamina is hyperintense (arrowhead) and the retina produces a weaker signal (arrow). (c) In DWI, both retina and lamina (*) produce weak signal. (d–g) MRM signal in the cortex. (d) In the fluorescent brain, anti-Elav labels the neuronal nuclei in the brain cortex (magenta, arrowheads). (e) In the brain section, the staining is weaker around the central brain and the optic lobes (arrowheads). (f) Single FLASH microimage at 100 μm depth showing stronger signal in the brain periphery (arrowheads) and between the central brain and the optic lobes, where the cell bodies are located. (g) Single DWI microimage at 100 μm depth showing high contrast inside the brain, with hypointense areas between the central brain and the optic lobes, where the cell bodies are located (arrowheads).
Figure 8
Figure 8. Dissection of the brain neuropil by 3D DWI.
(a–c) The anterior-medial brain. (a) and (b) The most prominent structures are the mushroom body lobes (α lobes shown, orange arrow) and the central complex (CC, red arrowhead). The suboesophageal ganglion occupies the ventral side (SOG, double white arrowhead). In the center, the esophageal opening (white arrow) is not labeled in the fluorescent brain, but the histological section reveals the esophagus lining and two small muscles. (c) In DW MRM, the α lobes are hyperintense and are surrounded by a dark halo. The CC is only beginning to show. The SOG is bright ventrally, while the esophageal opening is hypointense. (d–f) The middle brain. (d) and (e) The pedunculus (ped, white arrowhead) forms a thick nerve bundle that crosses the brain, while the CC forms a prominent ring structure in the center. The medulla (red arrow) is the anterior most neuropil of the optic lobes. (f) In DWI, the pedunculus is hypointense, while the CC is surrounded by hypointense tissue. The medulla appears as a homogenous domain of the optic lobes. The esophagus and the cortical area between the central brain and the optic lobes (yellow arrows) are hypointense. (g–i) The posterior brain. (g) and (h) The three domains of the optic lobes are visualized: medulla, lobula (rainbow arrow), and lobula plate (yellow arrowhead). The pedunculus still traverses the brain until it reached the Kenyon cells. The lateral horn (white diamond) shows intense blue and GFP labeling. The fat bodies (yellow *) are indicated in G. (i) In DWI, the three domains of the optic lobes are separated by hypointense axonal tracks. Only one pedunculus is detected due to a slight tilting of the brain. The lateral horn is hyperintense on the left side. The fat bodies produce strong signal ventral to the brain.

Similar articles

Cited by

References

    1. Keller P. J. Imaging morphogenesis: technological advances and biological insights. Science 340, 1234168, 10.1126/science.1234168 (2013). - DOI - PubMed
    1. Maglione M. & Sigrist S. J. Seeing the forest tree by tree: super-resolution light microscopy meets the neurosciences. Nat Neurosci 16, 790–797, 10.1038/nn.3403 (2013). - DOI - PubMed
    1. Lauterbur P. C. Image formation by induced local interactions: examples employing nuclear magnetic resonance. Nature 242, 190–191 (1973). - PubMed
    1. Eccles C. & Callaghan P. High resolution imaging: the NMR microscope. J Magn Reson 68, 393–398 (1986).
    1. Johnson G., Thompson M. G., L. S. & Hayes C. Nuclear magnetic resonance imaging at microscopic resolution. J Magn Reson 68, 129–137 (1986).

Publication types

LinkOut - more resources