. 2015 May;138(Pt 5):1167-81.
doi: 10.1093/brain/awv039. Epub 2015 Mar 9.

Neuron-specific antioxidant OXR1 extends survival of a mouse model of amyotrophic lateral sclerosis

Affiliations

Neuron-specific antioxidant OXR1 extends survival of a mouse model of amyotrophic lateral sclerosis

Kevin X Liu et al. Brain. 2015 May.

Abstract

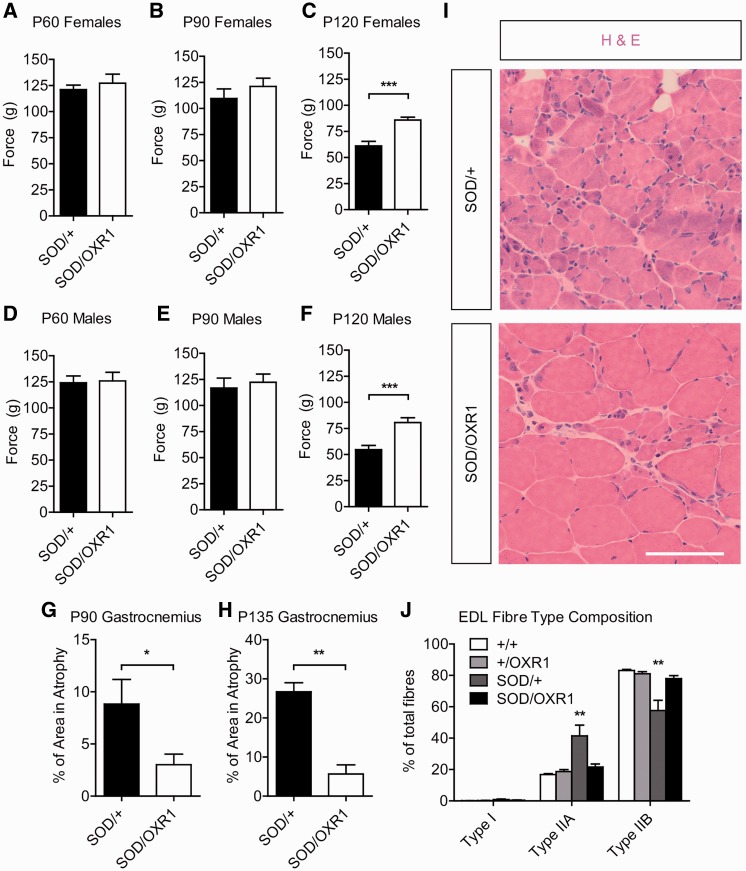
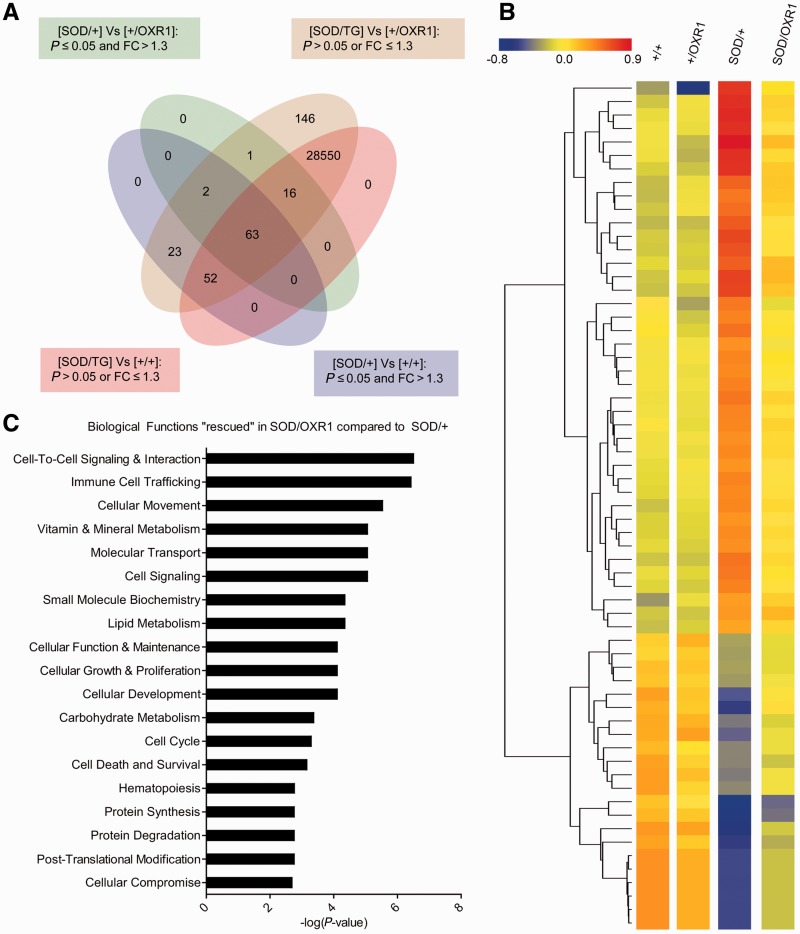
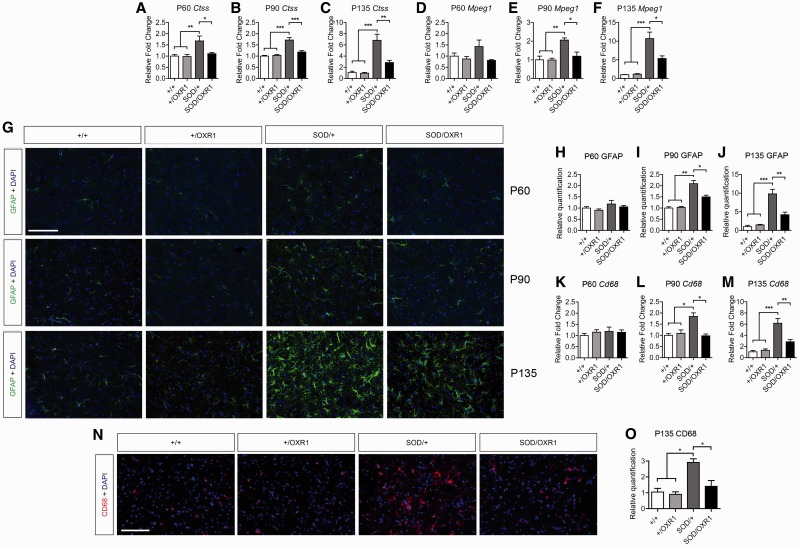
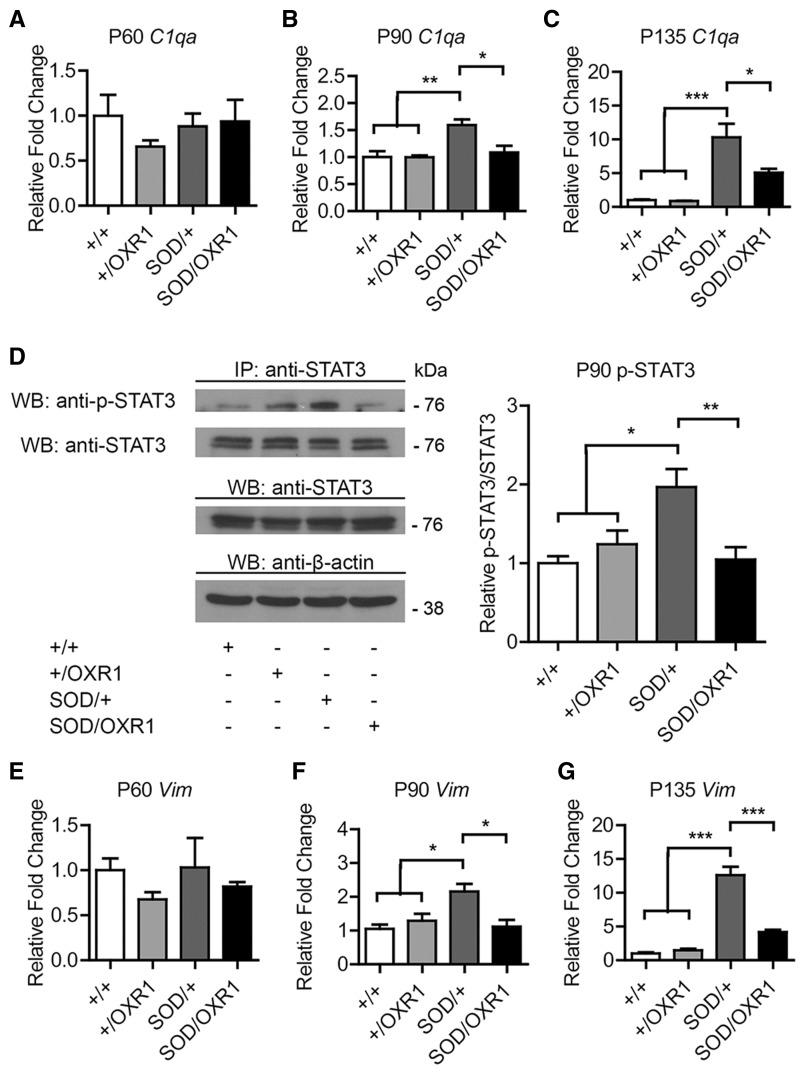
Amyotrophic lateral sclerosis is a devastating neurodegenerative disorder characterized by the progressive loss of spinal motor neurons. While the aetiological mechanisms underlying the disease remain poorly understood, oxidative stress is a central component of amyotrophic lateral sclerosis and contributes to motor neuron injury. Recently, oxidation resistance 1 (OXR1) has emerged as a critical regulator of neuronal survival in response to oxidative stress, and is upregulated in the spinal cord of patients with amyotrophic lateral sclerosis. Here, we tested the hypothesis that OXR1 is a key neuroprotective factor during amyotrophic lateral sclerosis pathogenesis by crossing a new transgenic mouse line that overexpresses OXR1 in neurons with the SOD1(G93A) mouse model of amyotrophic lateral sclerosis. Interestingly, we report that overexpression of OXR1 significantly extends survival, improves motor deficits, and delays pathology in the spinal cord and in muscles of SOD1(G93A) mice. Furthermore, we find that overexpression of OXR1 in neurons significantly delays non-cell-autonomous neuroinflammatory response, classic complement system activation, and STAT3 activation through transcriptomic analysis of spinal cords of SOD1(G93A) mice. Taken together, these data identify OXR1 as the first neuron-specific antioxidant modulator of pathogenesis and disease progression in SOD1-mediated amyotrophic lateral sclerosis, and suggest that OXR1 may serve as a novel target for future therapeutic strategies.

Keywords: ALS; inflammation; motor neuron disease; neurodegeneration; oxidative stress.


Figures

None
Oxidative stress is a key factor contributing to motor neuron injury in amyotrophic lateral sclerosis (ALS). Liu et al. show that overexpression of oxidation resistance 1 (Oxr1) in neurons reduces pathology and extends lifespan in an ALS mouse model. Manipulation of OXR1 levels may have therapeutic benefit in neurodegenerative disease.
Figure 1
Figure 1
Tg(Prnp-Oxr1) mice overexpress OXR1 specifically in neurons. (A) Prnp-promoter drives overexpression of HA-tagged full-length OXR1 as early as embryonic Day 13.5 (E13.5) in the spinal cord as shown by western blot in Tg(Prnp-Oxr1) mice (+/OXR1) when compared with wild-type (+/+). (B) Representative western blot showing a 5-fold increase in spinal cord expression of OXR1 (arrow) in +/OXR1 mice when compared with wild-type. The same membrane was reprobed with anti-HA to show HA-tagged full-length OXR1 and anti-β-actin as the loading control for quantification; values are mean ± SEM (n = 3 per genotype; ***P < 0.001, two-tailed Student’s t-test). Sizes of the bands correspond to those in (A). (C) Immunohistochemical staining for NeuN, a marker for neurons (arrows), and HA-tagged OXR1, in the spinal cord, demonstrating that Prnp-promoter driven OXR1 overexpression in +/OXR1 mice is specific to neurons. Scale bar = 50 µm. P1 = postnatal Day 1; WB = western blot.
Figure 2
Figure 2
Neuronal overexpression of OXR1 extends lifespan of SOD1G93A mice. Kaplan-Meier log rank test for survival, showing OXR1 overexpression increases median survival (A) from 149 days for SOD/+ females to 178 days for SOD/OXR1 females; and (B) from 149 days for SOD/+ males to 174 days for SOD/OXR1 males (n = 10–12 per sex per genotype). (A and B) Survival curves are significantly different by Mantel-Cox test, P < 0.0001 (χ2 = 24.99) for males, and P < 0.0001 (χ2 = 22.05) for females. OXR1 overexpression delays disease onset, defined by the age of maximum body weight, (C) from 106 days for SOD/+ females to 122 days for SOD/OXR1 females; and (D) from 110 days for SOD/+ males to 122 days for SOD/OXR1 males. OXR1 overexpression slows disease progression, defined by time of disease onset to end-stage, (E) from 43 days for SOD/+ females to 53 days for SOD/OXR1 females; and (F) from 37 days for SOD/+ males to 48 days for SOD/OXR1 males. (CF) Values are mean ± SEM (n = 9–16 per sex per genotype; *P < 0.05, **P < 0.01, ***P < 0.001; two-tailed Student’s test).
Figure 3
Figure 3
Neuronal overexpression of OXR1 improves motor function and motor neuron survival in SOD1G93A mice. (A) SOD/OXR1 females and (B) males have improved motor performance on the accelerating Rotarod when compared with SOD/+ females and males, respectively. (A and B) Values are mean ± SEM of motor performance (seconds, s) for mice still alive at each respective time point (n = 9–11 per sex per genotype at Days 60–120 and n = 6–11 per sex per genotype at Days 135–165 due animals reaching end-stage; *P < 0.05, **P < 0.01, ***P < 0.001, Mann-Whitney U-tests). Representative images of Nissl-stained motor neurons in matching lumbar spinal cord cross-sections at Day 90 (C) and Day 135 (E). Motor neuron survival counts in lumbar spinal cord cross-sections at Day 90 (D) and Day 135 (F); values are mean ± SEM (n = 3–4 per genotype; *P < 0.05, **P < 0.01; 1-way ANOVA, with Tukey’s post hoc tests). Scale bar = 100 µm. (G) Western blot showing reduced induction of HMOX1 (HO-1, arrow) in SOD/OXR1 mice. The same membrane was re-probed with anti-β-actin as the loading control for quantification; values are mean ± SEM (n = 3 per genotype; *P < 0.05, **P < 0.01; one-way ANOVA, with Tukey’s post hoc tests). (H) Immunohistochemical staining for HMOX1 and NeuN in the spinal cord demonstrating HMOX1 expression in neurons. Scale bar = 30 µm. P90 = postnatal Day 90; P135 = postnatal Day 135; WB = western blot.
Figure 4
Figure 4
Neuronal overexpression of OXR1 delays muscle pathology in SOD1G93A ALS mice. (A–C) SOD/OXR1 females show significantly improved muscle strength (g) on a grip strength test when compared with SOD/+ females at (C) Day 120 (P120), but not at (A) Day 60 (P60) or (B) Day 90 (P90). (DF) SOD/OXR1 males show significantly improved muscle strength (g) on grip strength test when compared with SOD/+ males at (F) Day 120, but not at (D) Day 60 or (E) Day 90. (AF) Values are mean ± SEM (n = 12–24 per genotype; ***P < 0.001, Mann-Whitney U tests). (G and H) Gastrocnemius muscle atrophy is decreased in SOD/OXR1 mice compared with SOD/+ mice at (G) Day 90 and (H) Day 135. (G and H) Values are mean ± SEM (n = 3–6 per genotype; *P < 0.05, **P < 0.01, two-tailed Student’s test). (I) Representative images of haemotoxylin and eosin (H&E) stained gastrocnemius muscle fibres at Day 135. (J) Extensor digitorum longus (EDL) muscles of SOD/+ mice have increased type IIA and decreased type IIB fibres, when compared to wild-type (+/+), +/OXR1, and SOD/OXR1 mice at Day 90. Values are mean ± SEM (n = 4–6 per genotype; **P < 0.01, two-way ANOVA, followed by Bonferroni post hoc tests).
Figure 5
Figure 5
Neuronal OXR1 overexpression delays early transcriptome changes in SOD1G93A spinal cord. (A) Venn diagram illustrates the common expression overlap from microarray analysis to identify 63 ‘rescued’ genes; those that are significantly changed (P ≤ 0.05) by >1.3-fold in SOD/+ spinal cord, but not significantly changed (P > 0.05) or by <1.2-fold in the SOD/OXR1 spinal cord at Day 90 after correcting for multiple comparisons. (B) Heat map of normalized signal intensity values for all genes identified as ‘rescued’ by neuronal OXR1 overexpression at Day 90. (C) Pathway analysis demonstrates that neuronal OXR1 overexpression delays SOD1G93A-induced changes in diverse molecular pathways at Day 90. Significance of identified pathways is presented as a –log(P-value), where P ≤ 0.05 is –log(P-value) ≥ 1.3.
Figure 6
Figure 6
Neuronal OXR1 overexpression decreases neuroinflammation in SOD1G93A spinal cord. (AC) SOD1G93A-induced expression of Ctss, a marker of neuroinflammation, in the spinal cord is reduced in SOD/OXR1 mice at Days 60, 90 and 135 as shown by quantitative RT-PCR. (DF) Induced expression of Mpeg1, a macrophage marker, in the SOD1G93A spinal cord is reduced by overexpression of OXR1 at Day 90 (P90), and Day 135 (P135) as shown by quantitative RT-PCR. (GJ) Immunohistochemical staining for GFAP on matching sections of lumbar spinal cord, showing significantly decreased astrogliosis in SOD/OXR1 mice when compared to SOD/+ mice at Days 90 and 135. (KM) Induced expression of Cd68, a marker of microgliosis, in the SODG93A spinal cord is significantly reduced in SOD/OXR1 mice at Days 90 and 135 as shown by quantitative RT-PCR. (NO) Immunohistochemical staining for CD68 on matching sections of lumbar spinal cord shows decreased microgliosis in SOD/OXR1 mice when compared to SOD/+ mice at Day 135. Values are mean ± SEM [n = 3–5 per genotype (AF and KM), n = 3 per genotype (GJ and NO); *P < 0.05, **P < 0.01, ***P < 0.001, one-way ANOVA with Tukey’s post hoc tests]. Scale bars = 100 µm.
Figure 7
Figure 7
Neuronal OXR1 overexpression delays activation of neuroinflammatory pathways in the spinal cord of SOD1G93A ALS mice. (AC) SOD1G93A induced activation of genes C1qa, which encodes C1q α component, is reduced in SOD/OXR1 mice at Days 90 (P90) and 135 (P135). (D) Immunoprecipitation showing induced expression of phosphorylated-STAT3 in the SOD1G93A spinal cord is reduced by overexpression of OXR1 at Day 90. Quantification of p-STAT3, and values are mean ± SEM (n = 5 per genotype; *P < 0.05, **P < 0.01, one-way ANOVA with Tukey’s post hoc tests). The same blot was reprobed with anti-STAT3. Expression controls for STAT3 and β-actin from total cell lysates are also shown from an independent blot. Complete blot images are shown in Supplementary Fig. 3P–S. (E and G) SOD1G93A induced activation of Vim, a target of STAT3, is significantly reduced in SOD/OXR1 mice at Days 90 and 135. (AC and EG) Values are mean ± SEM (n = 3–5 per genotype; *P < 0.05, **P < 0.01, ***P < 0.001, one-way ANOVA with Tukey’s post hoc tests). IP = immunoprecipitation; WB = western blot.

References

    1. Abe K, Aoki M, Ikeda M, Watanabe M, Hirai S, Itoyama Y. Clinical characteristics of familial amyotrophic lateral sclerosis with Cu/Zn superoxide dismutase gene mutations. J Neurol Sci. 1996;136:108–16. - PubMed
    1. Barber SC, Shaw PJ. Oxidative stress in ALS: key role in motor neuron injury and therapeutic target. Free Radica Biol Med. 2010;48:629–41. - PubMed
    1. Beal MF, Ferrante RJ, Browne SE, Matthews RT, Kowall NW, Brown RH., Jr Increased 3-nitrotyrosine in both sporadic and familial amyotrophic lateral sclerosis. Ann Neurol. 1997;42:644–54. - PubMed
    1. Benatar M. Lost in translation: treatment trials in the SOD1 mouse and in human ALS. Neurobiol Dis. 2007;26:1–13. - PubMed
    1. Boillee S, Yamanaka K, Lobsiger CS, Copeland NG, Jenkins NA, Kassiotis G, et al. Onset and progression in inherited ALS determined by motor neurons and microglia. Science. 2006;312:1389–92. - PubMed

Publication types

MeSH terms