. 2015 May;28(5):559-69.
doi: 10.1016/j.echo.2015.01.024. Epub 2015 Mar 7.

Right ventricular function in preterm and term neonates: reference values for right ventricle areas and fractional area of change

Affiliations

Right ventricular function in preterm and term neonates: reference values for right ventricle areas and fractional area of change

Philip T Levy et al. J Am Soc Echocardiogr. 2015 May.

Abstract

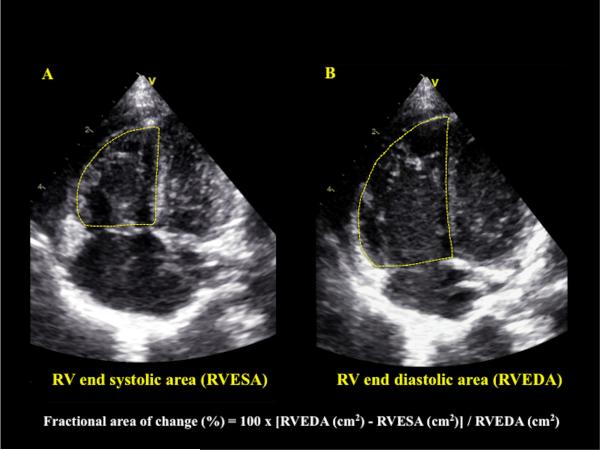
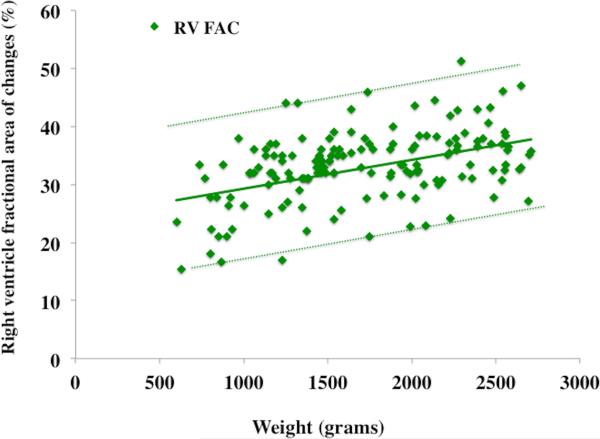
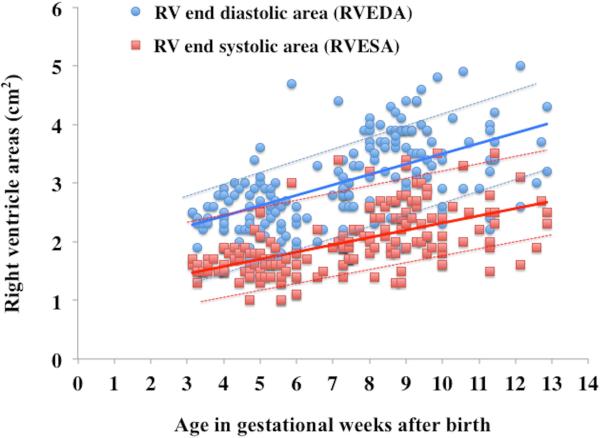
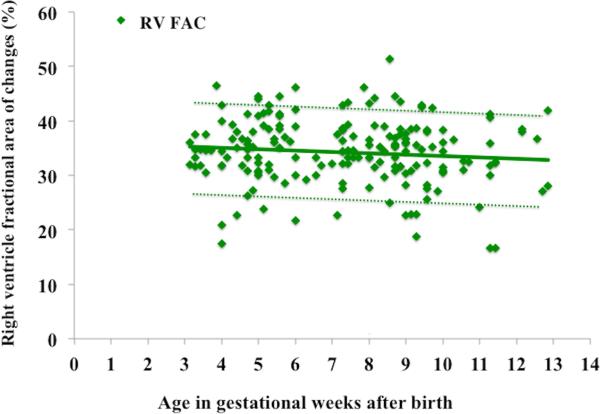
Background: Right ventricular (RV) fractional area of change (FAC) is a quantitative two-dimensional echocardiographic measurement of RV function. RV FAC expresses the percentage change in the RV chamber area between end-diastole (RV end-diastolic area [RVEDA]) to end-systole (RV end-systolic area [RVESA]). The objectives of this study were to determine the maturational (age- and weight-related) changes in RV FAC and RV areas and to establish reference values in healthy preterm and term neonates.

Methods: A prospective longitudinal study was conducted in 115 preterm infants (23-28 weeks' gestational age at birth, 500-1,500 g). RV FAC was measured at 24 hours of age, 72 hours of age, and 32 and 36 weeks' postmenstrual age (PMA). The maturational patterns of RVEDA, RVESA, and RV FAC were compared with those in 60 healthy full-term infants in a cross-sectional study (≥37 weeks, 3.5 ± 1 kg), who underwent echocardiography at birth (n = 25) and 1 month of age (n = 35). RVEDA and RVESA were traced in the RV-focused apical four-chamber view, and FAC was calculated using the formula 100 × [(RVEDA - RVESA)/RVEDA)]. Premature infants who developed chronic lung disease or had clinically and hemodynamically significant patent ductus arteriosus were excluded (n = 55) from the reference values. Intra- and interobserver reproducibility analysis was performed.

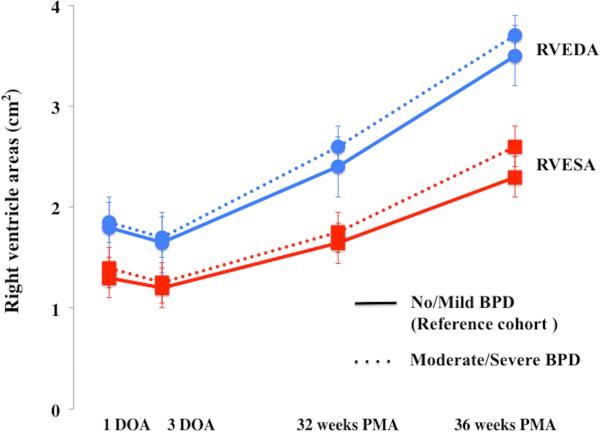
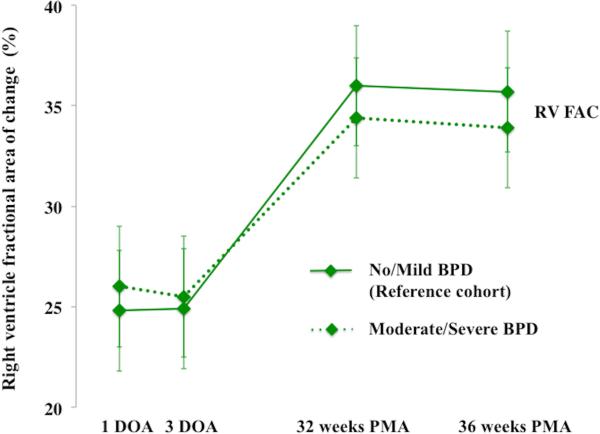
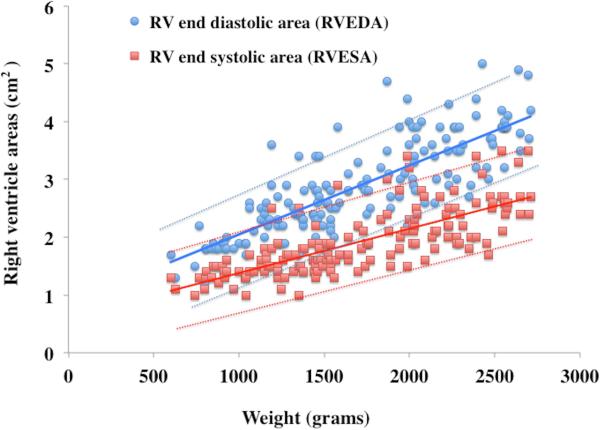
Results: RV FAC ranged from 26% at birth to 35% by 36 weeks' PMA in preterm infants (n = 60) and increased almost 2 times faster in the first month of age compared with healthy term infants (n = 60). Similarly, RVEDA and RVESA increased throughout maturation in both term and preterm infants. RV FAC and RV areas were correlated with weight (r = 0.81, P < .001) but were independent of gestational age at birth (r = 0.3, P = .45). RVEDA and RVESA were correlated with PMA in weeks (r = 0.81, P < .001). RV FAC trended lower in preterm infants with bronchopulmonary dysplasia (P = .04) but was not correlated with size of patent ductus arteriosus (P = .56). There was no difference in RV FAC based on gender or need for mechanical ventilation.

Conclusions: This study establishes reference values of RV areas (RVEDA and RVESA) and RV FAC in healthy term and preterm infants and tracks their maturational changes during postnatal development. These measures increase from birth to 36 weeks' PMA, and this is reflective of the postnatal cardiac growth as a contributor to the maturation of cardiac function These measures are also linearly associated with increasing weight throughout maturation. This study suggests that two-dimensional RV FAC can be used as a complementary modality to assess global RV systolic function in neonates and facilitates its incorporation into clinical pediatric and neonatal guidelines.

Keywords: Cardiac function; Fractional area of change; Neonates; Prematurity; Right ventricle.


Figures

Figure 1
Figure 1. Calculation of RV FAC
This is an example of how to generate and calculate right ventricular fractional area change (RV FAC). RV FAC was obtained by tracing the RV endocardium in A) end-systole (RV end systolic area, RVESA) and B) end-diastole (RV end diastolic area, RVEDA). For RVESA and RVEDA, a ‘sail sign’ was traced from the septal side of the tricuspid annular plane (septal-tricuspid annular hinge point) to (ii) apical-septal point and then to the (iii) RV free wall side (RVFW) of the tricuspid annular plane (lateral-tricuspid annular hinge point)., Care was taken to include the trabeculations in the measurements of the area by tracing the RVEDA and RVESA between RV trabeculations and the compact layer of the ventricle.,, The RVESA and RVEDA were measured at the frames just before tricuspid valve opening and just after the valve closure, respectively., Fractional area of change = 100 x ((RVEDA (cm2) - RVESA (cm2)) / RVEDA (cm2).
Figure 2
Figure 2. Maturational patterns of RV areas and fractional area of change
(A) RV areas: From one to three days of the age (DOA) there was no difference in right ventricle end diastolic area, RVEDA, (blue circles with blue lines) and right ventricle end systolic area, RVESA, (red squares with red lines) between the reference cohort (infants with mild or no BPD, solid lines) and the infants with moderate or severe BPD (dotted lines). However, by 32 weeks PMA there was a statistically significant increase in RVEDA and RVESA (p=0.034) amongst the infants with moderate or severe BPD. From 32 to 36 weeks PMA, RVEDA increased at the same rate between the groups, but RVESA increased more rapidly in the infants with moderate or severe BPD. (B) RV FAC: Initially, at one and three DOA there were no statistical differences in the RV FAC (p=0.902), between the reference cohort (No or mild BPD, green diamonds with solid green line) and the infants with moderate or severe BPD (green diamonds with dotted green line). However, by 32 weeks PMA, RV FAC was decreased in infants with moderate and severe BPD as compared to the reference cohort.
Figure 3
Figure 3. Weight related percentile charts in preterm neonates
Weight versus observed mean value of (A) RVEDA (blue circles with blue lines), RVESA (red squares with red lines) and (B) RV FAC (green diamonds with green lines). The mean is indicated by solid lines, the errors bars ± 2SD are indicated by dotted lines.
Figure 4
Figure 4. Post-gestational Age (in weeks) related percentile charts in preterm neonates
Age after birth versus observed mean value (A) RVEDA (blue circles with blue lines), RVESA (red squares with red lines) and (B) RV FAC (green diamonds with green lines). The means are indicated by solid lines, the error bars ± 2SD are indicated by dotted lines.

Similar articles

Cited by

References

    1. Lewandowski AJ, Bradlow WM, Augustine D, Davis EF, Francis J, Singhal A, et al. Right Ventricular Systolic Dysfunction in Young Adults Born Preterm. Circulation. 2013;128:713–20. - PubMed
    1. Rajagopal S, Forsha D, Risum N, Hornik CP, Poms AD, Fortin TA, et al. Comprehensive Assessment of Right Ventricu lar Function in Patients with Pulmonary Hypertension with Global Longitudinal Peak Systolic Strain Derived from Multiple Right Ventricular Views. J Am Soc Echocardiogr. 2014;27:657–65. - PubMed
    1. Kawut SM, Barr RG, Lima JAC, Praestgaard A, Johnson WC, Chahal H, et al. Right ventricular structure is associated with the risk of heart failure and cardiovascular death: the Multi-Ethnic Study of Atherosclerosis (MESA)--right ventricle study. Circulation. 2012;126:1681–8. - PMC - PubMed
    1. Jurcut R, Giusca S, La Gerche A, Vasile S, Ginghina C, Voigt JU. The echocardiographic assessment of the right ventricle: what to do in 2010? Eur J Echocardiogr. 2010;11:81–96. - PubMed
    1. Lang RM, Badano LP, Mor-Avi V, Afilalo J, Armstrong A, Ernande L, et al. Recommendations for chamber quantification. J Am Soc Echocardiogr. 2015;28:1–39. - PubMed

Publication types