. 2015 Mar 10:6:6471.
doi: 10.1038/ncomms7471.

Identification of FOXM1 as a therapeutic target in B-cell lineage acute lymphoblastic leukaemia

Affiliations

Identification of FOXM1 as a therapeutic target in B-cell lineage acute lymphoblastic leukaemia

Maike Buchner et al. Nat Commun. .

Abstract

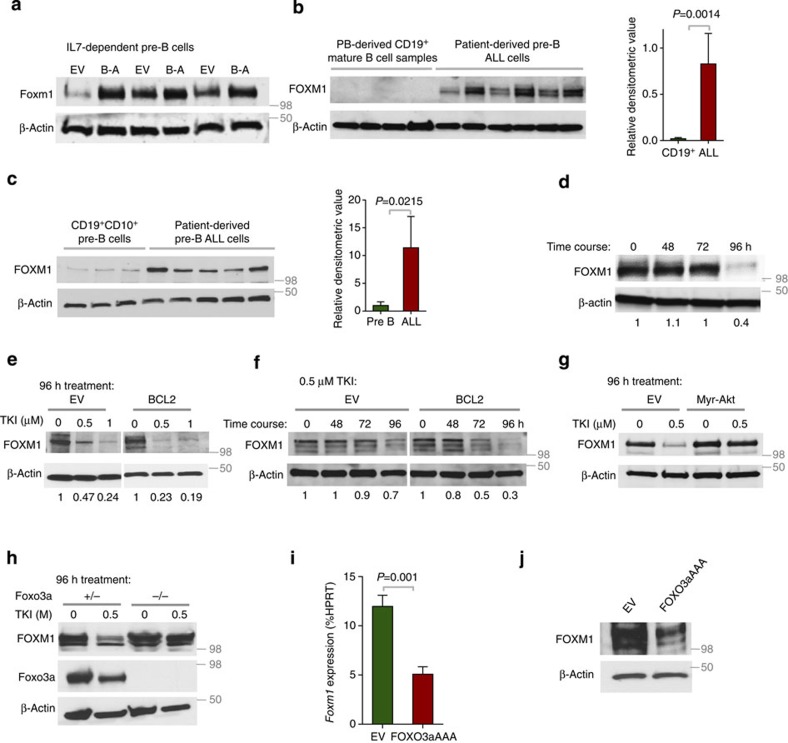
Despite recent advances in the cure rate of acute lymphoblastic leukaemia (ALL), the prognosis for patients with relapsed ALL remains poor. Here we identify FOXM1 as a candidate responsible for an aggressive clinical course. We show that FOXM1 levels peak at the pre-B-cell receptor checkpoint but are dispensable for normal B-cell development. Compared with normal B-cell populations, FOXM1 levels are 2- to 60-fold higher in ALL cells and are predictive of poor outcome in ALL patients. FOXM1 is negatively regulated by FOXO3A, supports cell survival, drug resistance, colony formation and proliferation in vitro, and promotes leukemogenesis in vivo. Two complementary approaches of pharmacological FOXM1 inhibition-(i) FOXM1 transcriptional inactivation using the thiazole antibiotic thiostrepton and (ii) an FOXM1 inhibiting ARF-derived peptide-recapitulate the findings of genetic FOXM1 deletion. Taken together, our data identify FOXM1 as a novel therapeutic target, and demonstrate feasibility of FOXM1 inhibition in ALL.


Figures

Figure 1
Figure 1. FOXM1 expression is dispensable for normal B-cell survival and development.
(a) FOXM1 mRNA expression in sorted progenitor and B-cell fractions according to microarray data (b) qRT–PCR of FOXM1 in human B-cell progenitor fractions with COX6B used as a reference, mean values of n=3 (technical replicates); ±s.e.m. (c) qRT–PCR of Foxm1 in Hardy B-cell fractions is shown with Hprt used as a reference, n=3 (technical replicates); ±s.e.m.; representative example of two independent BM sorts. (d) Viability of Foxm1fl/fl B-cell precursors was analysed daily after induction of deletion by 4-OHT; representative results of three independent experiments are shown. (e) Immunoblot of Foxm1 deletion induced by 4-OHT in Foxm1fl/fl B-cell precursors. (f) Representative examples of Hardy Fraction A–C′ for wt BM and Mb1-Cretg/+ Foxm1fl/fl are shown. (g) BM of Mb1-Cretg/+ Foxm1fl/fl (n=4) and Mb1 wt Foxm1fl/fl (n=3) littermates were cultured in the presence of IL-7. κ LC expression was induced by IL-7 withdrawal and analysed by flow cytometry after 48 h, statistical significance was tested by Student’s t-test. (h) IL-7 cultures Mb1 wt (n=2) and from Mb1-Cretg/+ Foxm1fl/fl (n=4) littermates were analysed for Foxm1 expression by immunoblot to confirm Cre-mediated Foxm1 deletion.
Figure 2
Figure 2. Regulation of FOXM1 expression in patient-derived pre-B ALL cells.
(a) Foxm1 expression levels of three matched samples of IL-7-dependent B-cell precursors (in the presence of IL-7) and BCR-ABL1-transformed ALL-like cells (IL-7 independent). (b,c) Immunoblot analysis for the expression of FOXM1 in normal CD19+ B cells (b) derived from peripheral blood (PB) or CD19+ CD10+ B-cell precursors (c) derived from BM and patient-derived pre-B ALL; loading order for ALL: ICN1 (Ph+), PDX2 (Ph+), SFO5 (normal karyotype), LAX7 (normal karyotype), LAX7R (normal karyotype), LAX2 (Ph+) and PDX2 (Ph+), MPX2 (Ph+), MPX3 (Ph+), MPX5 (Ph+), BLQ5 (Ph+), respectively; shown with β-actin as loading control. Mean densitometric values relative to loading control are shown in the bar graphs ±s.e.m., significance was determined by Student’s t-test. (d) Time course of FOXM1 protein levels after TKI treatment (shown for ICN1), β-actin was used as a loading control; representative result of three independent experiments is shown. (e) Human Ph+ ALL cells (PDX2) were treated with TKI at low doses for 96 h and analysed for FOXM1 expression with β-actin as a loading control with and without overexpression of BCL2, representative result of three independent experiments is shown. (f) Time course analysis of FOXM1 expression in PDX2 with either empty vector or BCL2 overexpression. (g) Immunoblot analysis of Foxm1 with and without the expression of constitutively active Myr-Akt in murine ALL, treated with low concentrations of TKI or control for 96 h. (h) Immunoblot analysis Foxm1 expression in murine BCR-ABL1-transformed Foxo3a+/− and Foxo3a−/− ALL treated with low concentrations of TKI or control for 4 days; representative result of three independent experiments is shown. (i) Foxm1 qRT–PCR was performed on day 2 after transduction with EV or a constitutively active form of FOXO3a (FOXO3aAAA), Hprt was used as a reference, n=3; ±s.e.m., Student’s t-test was used for statistical analysis. (j) Foxm1 protein levels were measured 3 days after the introduction of a constitutively active form of FOXO3a (FOXO3aAAA), with β-actin as a loading control.
Figure 3
Figure 3. FOXM1 is a predictor of poor clinical outcome in pre-B ALL.
(a) Gene expression profiling of 60 cases of first relapse childhood ALL samples were analysed for FOXM1 expression and stratified into intermediate and high-risk groups according to a combination of prognostic factors of the relapse trial of the German Berlin–Frankfurt–Münster (BFM) study group ALL-REZ BFM 2002 (left panel; Wilcoxon rank-sum test was used for statistical analysis). Analysis of the same data set was correlated with time to relapse: very early relapse (within 18 months after initial diagnosis; n=14), early relapse (>18 months after initial diagnosis but <6 months after cessation of frontline treatment; n=10) and late relapse (>6 months after cessation of frontline treatment; n=28; right panel; Kruskal–Wallis rank-sum test was used for statistical analysis). (b) FOXM1 expression as determined by the gene expression profiling of matched samples of ALL at time of diagnosis and relapse. (c) Inverse correlation of FOXM1 with FOXO1A and FOXO3A mRNA levels in patients with Ph+ ALL in the ECOG E2993 trial (n=55; Pearson correlation test). (d) Patients with Ph+ ALL in the ECOG E2993 trial (n=55) were segregated into two groups based on higher or lower than median ratio of mRNA levels of FOXM1/FOXO3A. OS of patients in the FOXM1/FOXO3AHi versus FOXM1/FOXO3ALow group was compared by Kaplan–Meier analysis with the P value determined by Log-rank Mantle–Cox test. (e) FOXM1 target genes on a data set collected by the German ALL-REZ BFM 2002 of the BFM study group (n=60) and AML (data retrieved from The Cancer Genome Atlas). A colour scale indicates whether the expression level of a gene is significantly associated with poor (in red colour) or favourable (in blue colour) patient outcome or not significant (in white colour), based on the parameters of relapse, risk stratification (as determined by Wilcoxon rank-sum test) and OS (as determined by Log-rank Mantle–Cox test).
Figure 4
Figure 4. Foxm1 mediates the proliferation and survival of leukaemia cells in a mouse model of Ph+ ALL.
(a) Deletion of Foxm1 in Foxm1fl/fl ALL cells is shown by immunoblot with β-actin as a loading control. (b) Viability of ALL cells after induction of deletion was measured daily by flow cytometry (fluorescence-activated cell sorting blots are shown in Supplementary Fig. 4a; representative example of three independent experiments). (c) Comparison of viability in Foxm1fl/fl EV and Cre on day 0 and day 10 after 4-OHT, n=3; ±s.e.m., Student’s t-test was used for statistical analysis. (d) Cell cycle progression was measured based on BrdU incorporation and DNA content (7 AAD) after 2 days of 4-OHT treatment, n=3 (technical replicates); ±s.e.m., Student’s t-test was used for statistical analysis; representative example of four independent experiments. (e) 20,000 Foxm1fl/fl EV and Cre ALL cells were plated in methylcellulose for 20 days in the presence of 4-OHT, colonies formed were counted; n=3; ±s.e.m., Student’s t-test was used for statistical analysis, scale bar represents 1 cm, squared section is twofold enlarged. (f) Kaplan–Meier analysis of NOD/SCID mice that were injected with 100,000 Foxm1fl/fl EV or Cre ALL cells pretreated with 4-OHT for 24 h in vitro is shown. Statistical analysis was performed by Log-rank Mantle–Cox test. (g) Kaplan–Meier analysis of NOD/SCID mice that were injected with 100,000 Foxm1fl/fl EV or Cre ALL cells and treated for 10 days with tamoxifen in corn oil i.p. is shown, n=7 per group. Statistical analysis was performed by Log-rank Mantle–Cox test. (h,i) Immunoblot revealed normal levels of Foxm1 after ex vivo and in vivo deletion (indicating outgrowth of clones with incomplete deletion); complete deletion in vitro in pre-B cells in the presence of 4-OHT is shown for day 14 (i).
Figure 5
Figure 5. Foxm1 enables resistance to TKIs in Ph+ ALL.
(a) Foxm1fl/fl EV or Cre ALL cells were stained with 2′7′-dichlorofluorescein diacetate (DCFDA), which labels cells based on intracellular levels of ROS after the indicated time of 4-OHT treatment. Mean fluorescence intensities (MFI) for DCFDA are depicted; n=3 (biological replicates); ±s.e.m., Student’s t-test was used for statistical analysis. (b) qRT–PCR analysis for Cat, Sod1 and Foxm1 mRNA levels in Foxm1fl/fl EV or Cre ALL-like cells, Hprt is used as a reference, n=3; ±s.e.m., Student’s t-test was used for statistical analysis. (c) Immunoblot analysis of Cat d2 after 4-OHT in Foxm1fl/fl EV or Cre ALL cells is shown. β-Actin serves as a loading control; samples are derived from three independent experiments. (d) Single-locus ChIP assay was performed on patient-derived ALL (PDX2) with normal rabbit IgG as a negative control. (+) indicates a previously described binding domain of FOXM1, (−) indicates the negative control, either within the same gene promoter or in the ACTA1 gene promoter; representative result of two independent experiments is shown. (e) Cat mRNA levels are measured after 4 h of imatinib treatment by quantitative real-time PCR with Hprt as a reference gene n=3; ±s.e.m., Student’s t-test was used for statistical analysis, two independent experiments are shown. (f) Cat expression levels are shown in the presence and absence of Foxm1, with and without imatinib treatment. (g) Imatinib (TKI)-sensitivity of BCR-ABL1-transformed Foxm1fl/fl ALL cells was measured in dose–response experiments after 72 h, starting 2 days after 4-OHT treatment. Relative values to untreated cells are displayed. Foxm1/ and Foxm1+/+ cells (EV; closed circles) are shown as well as overexpression of Cat for both conditions (open circles); representative result of three independent experiments is shown.
Figure 6
Figure 6. In vivo efficacy of a peptide-based FOXM1 inhibitor in patient-derived ALL cells.
(a) Analysis of FOXM1 target genes after 24 h of 10 μM ARF peptide treatment of patient-derived ALL samples (shown for LAX2), COX6B was used as a reference gene, n=3; ±s.e.m., Student’s t-test was used for statistical analysis. (b) Efficacy of 30 μM ARF peptide on Foxm1+/+ and Foxm1/ cells after 72 h to confirm specificity; measured by CCK-8 viability assay; n=3; ±s.e.m., Student’s t-test was used for statistical analysis. (c) Confocal microscopy of control or ARF peptide-treated ALL samples (shown for LAX7R), stained for the nucleoli marker fibrillarin (green) and FOXM1 (red) and 4′,6-diamidino-2-phenylindole (DAPI). Scale bar represents 8 μm; representative result of three independent experiments. (d) FOXM1 protein expression after ARF peptide treatment after 24 h (shown for LAX7R) (e) Dose–response for ARF26–44 peptide of pre-B ALL versus B-NHL (green) and CML cell lines (black), ICNI and PDX2 are Ph+ALL, SFO5, LAX7 and LAX7R are normal karyotype ALL (red). (f) Annexin V/DAPI staining after 48 h of 10 μM imatinib in the presence of control peptide or ARF peptide of ICN1. (g) Intracellular ROS levels determined by DCFDA staining in ALL cells treated for 4 h with 10 μM ARF peptide or control peptide (PDX2). (h) Leukaemia burden in mice after injection of 500,000 human luciferase-labelled pre-B ALL cells (LAX7R) and treatment for 10 days with ARF peptide, measured by luciferase bioimaging. (i) A Kaplan–Meier analysis compared overall survival of transplant recipients in the two groups; n=7 per group. Statistical analysis was performed by Log-rank Mantle–Cox test.
Figure 7
Figure 7. In vivo efficacy of the FOXM1 inhibitor Thiostrepton in patient-derived ALL cells.
(a) Thiostrepton structure is shown. (b) Immunoblot of FOXM1, FOXO3a, FOXO1 and β-actin as loading control after 18 h of treatment with thiostrepton at the indicated concentration. (c) Analysis of FOXM1 target genes after 24 h of 10 μM ARF peptide treatment of patient-derived ALL samples (shown for LAX2). (d) Efficacy of 0.5 μM Thiostrepton on Foxm1+/+ and Foxm1/ cells after 72 h to confirm specificity; measured by CCK-8 viability assay, n=3; ±s.e.m., Student’s t-test was used for statistical analysis; representative result of three independent experiments. (e) Dose–response of pre-B ALL (red) versus B-cell lymphoma (green) or CML cell lines (black). (f) Intracellular ROS levels in Foxm1fl/fl EV+DMSO (vehicle) and Foxm1fl/fl EV+thiostrepton after 4 h. As a positive control Foxm1fl/fl Cre-ER 4-OHT ALL cells (day 1) was included. (g) ROS levels were determined in the presence and absence of Foxm1 and with and without thiostrepton for 4 h with no further increase of ROS in the three independent Foxm1-deleted ALL-like cell lines, MFI levels are shown, n=3; ±s.e.m., Student’s t-test was used for statistical analysis. (h) ROS induction in human patient-derived Ph+ALL cells (shown for PDX2) after 4 h of thiostrepton treatment is shown. (i) Leukaemia burden in mice after injection of 500,000 human luciferase-labelled pre-B ALL cells (LAX7R) and treated for seven consecutive days with 50 mg kg−1 Thiostrepton i.v., measured by luciferase bioimaging. (j) A Kaplan–Meier analysis compared the OS of transplant recipients in the two groups. Statistical analysis was performed by Log-rank Mantle–Cox test. (k) Immunoblot analysis of FOXM1, FOXO3a and FOXO1 in human xenografted ALL (LAX7R) harvested from mice showing signs of leukaemia, and then treated with three doses of thiostrepton at 50 mg kg−1 or vehicle control.

Similar articles

Cited by

References

    1. Chen X. et al.. The forkhead transcription factor FOXM1 controls cell cycle-dependent gene expression through an atypical chromatin binding mechanism. Mol. Cell. Biol. 33, 227–236 (2013) . - PMC - PubMed
    1. Chen Y. J. et al.. A conserved phosphorylation site within the forkhead domain of FoxM1B is required for its activation by cyclin-CDK1. J. Biol. Chem. 284, 30695–30707 (2009) . - PMC - PubMed
    1. Laoukili J. et al.. Activation of FoxM1 during G2 requires cyclin A/Cdk-dependent relief of autorepression by the FoxM1 N-terminal domain. Mol. Cell. Biol. 28, 3076–3087 (2008) . - PMC - PubMed
    1. Park H. J. et al.. An N-terminal inhibitory domain modulates activity of FoxM1 during cell cycle. Oncogene 27, 1696–1704 (2008) . - PMC - PubMed
    1. Wang I. C. et al.. Forkhead box M1 regulates the transcriptional network of genes essential for mitotic progression and genes encoding the SCF (Skp2-Cks1) ubiquitin ligase. Mol. Cell. Biol. 25, 10875–10894 (2005) . - PMC - PubMed

Publication types

MeSH terms