. 2015 May;104(5):1575-91.
doi: 10.1002/jps.24379. Epub 2015 Mar 5.

Physical characterization and in vitro biological impact of highly aggregated antibodies separated into size-enriched populations by fluorescence-activated cell sorting

Affiliations

Physical characterization and in vitro biological impact of highly aggregated antibodies separated into size-enriched populations by fluorescence-activated cell sorting

Srivalli Telikepalli et al. J Pharm Sci. 2015 May.

Abstract

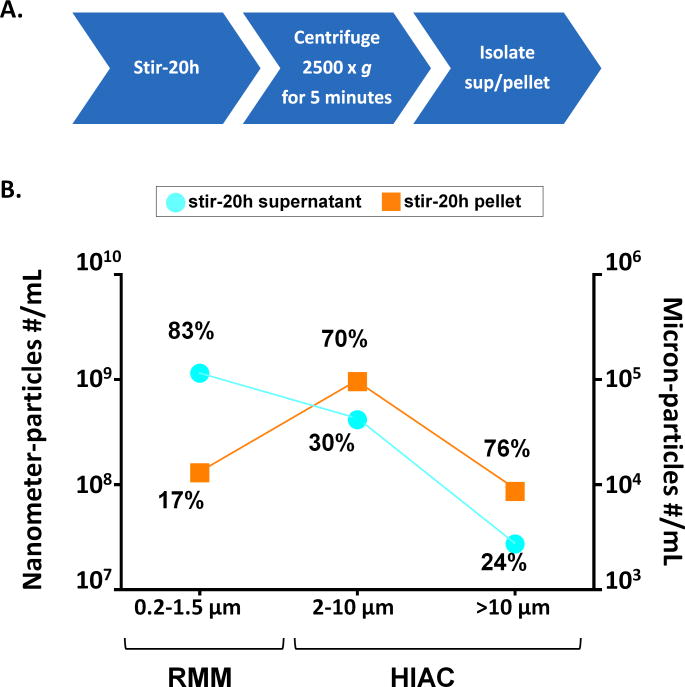
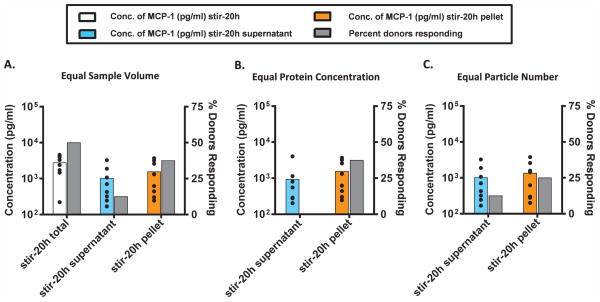
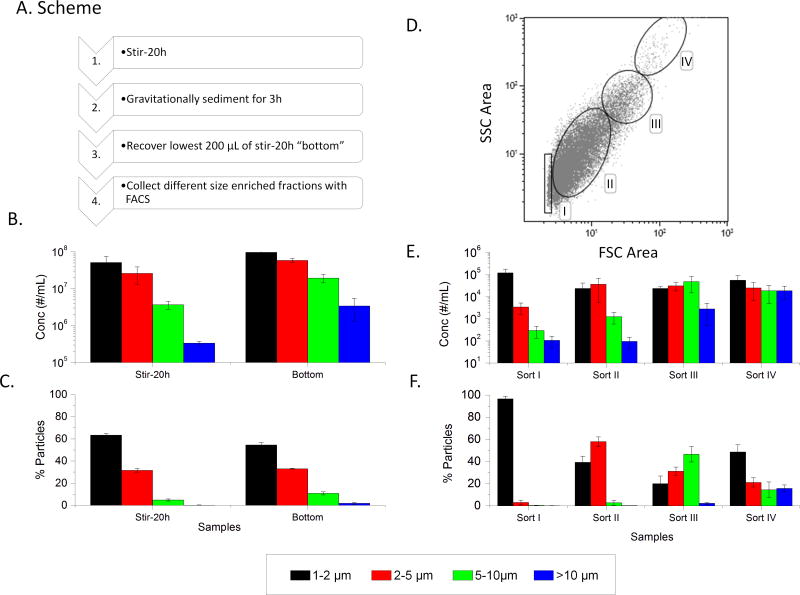
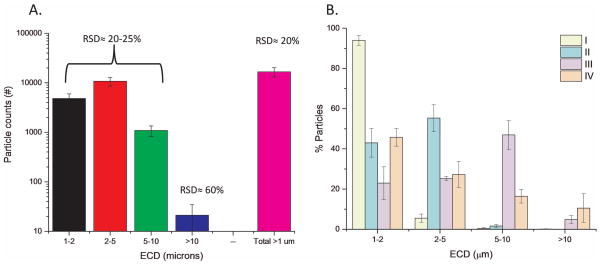
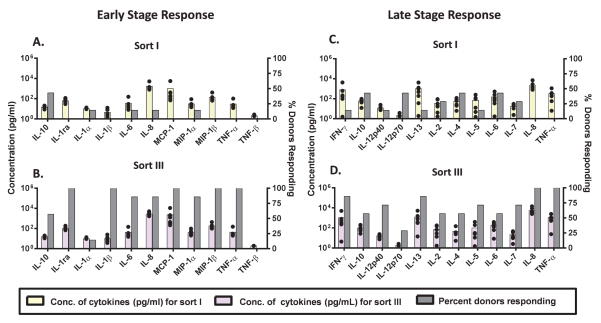
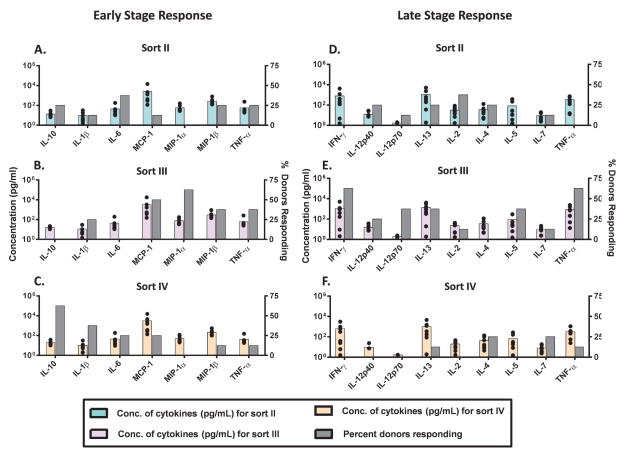
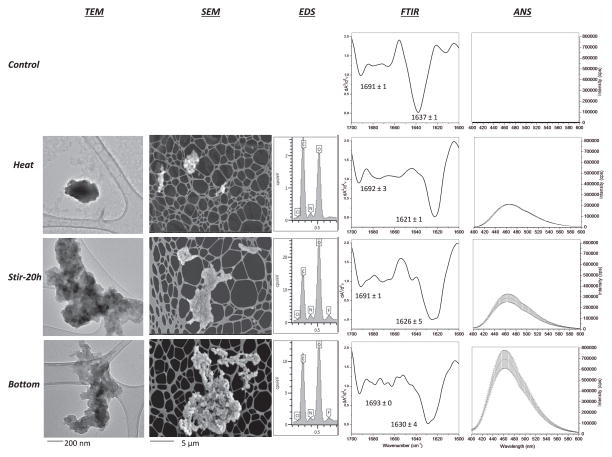
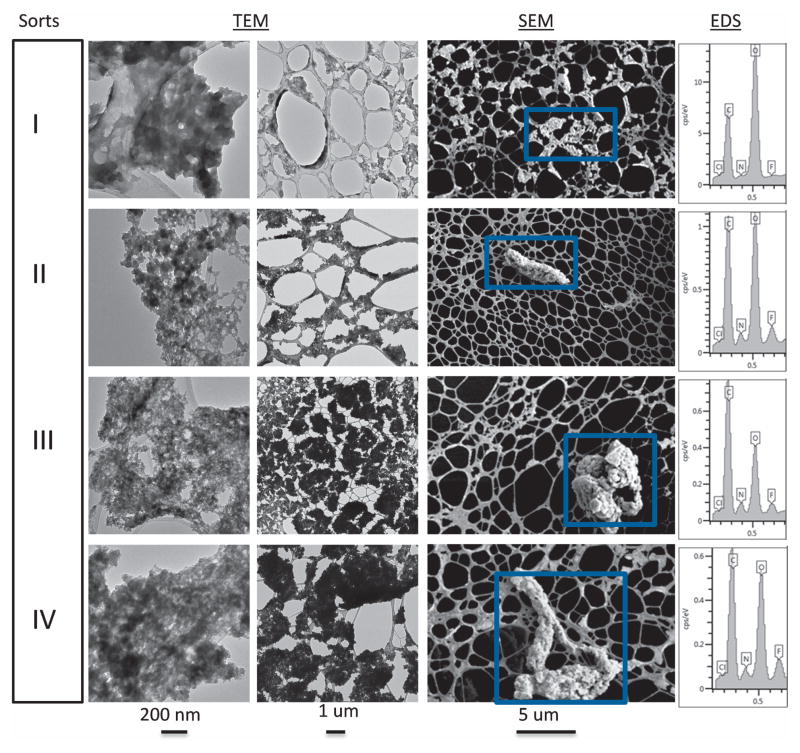
An IgG2 monoclonal antibody (mAb) solution was subjected to stirring, generating high concentrations of nanometer and subvisible particles, which were then successfully size-enriched into different size bins by low-speed centrifugation or a combination of gravitational sedimentation and fluorescence-activated cell sorting (FACS). The size-fractionated mAb particles were assessed for their ability to elicit the release of cytokines from a population of donor-derived human peripheral blood mononuclear cells (PBMC) at two phases of the immune response. Fractions enriched in nanometer-sized particles showed a lower response than those enriched in micron-sized particles in this assay. Particles of 5-10 μm in size displayed elevated cytokine release profiles compared with other size ranges. Stir-stressed mAb particles had amorphous morphology, contained protein with partially altered secondary structure, elevated surface hydrophobicity (compared with controls), and trace levels of elemental fluorine. FACS size-enriched the mAb particle samples, yet did not notably alter the overall morphology or composition of particles as measured by microflow imaging, transmission electron microscopy, and scanning electron microscopy-energy dispersive X-ray spectroscopy. The utility and limitations of FACS for size separation of mAb particles and potential of in vitro PBMC studies to rank-order the immunogenic potential of various types of mAb particles are discussed.

Keywords: IgG; immune response; immunogenicity; PBMC; in vitro; monoclonal antibody; particles; protein aggregation; proteins.


Figures

Figure 1
Figure 1
Separation of nanometer-sized vs. micron-sized stirring-induced particles of mAb2 by low speed centrifugation. A) Schematic of experimental setup, and B) particle number and size distributions of the fractionated samples are shown in three different size ranges. The concentration of smaller particles (0.2–1.5 μm) for both supernatant and pellet was obtained by Resonant Mass Measurement (RMM; estimated RSD ~30 %, see text). The concentration of particles 2 μm to greater than 10 μm was obtained from light obscuration measurements (HIAC; estimated RSD 1%-8%, see text). The percentages were calculated by dividing the number of particles in either the supernatant or pellet by the total number of particles present in both supernatant and pellet at a particular size range.
Figure 2
Figure 2
Peripheral blood mononuclear cells (PBMC) from 8 human donors were incubated with solutions of mAb2 particles (see Figure 1) and examined for the release of MCP-1. MCP-1 was measured by electro-chemiluminescence at the early phase (20 h incubation) at (A) equal sample volume, (B) equal protein concentration, and (C) equal particle numbers. The average concentration (n=8, colored bars) of MCP-1 and percentage of donors that responded (gray bars) to the aggregated mAb (two fold above the unstressed mAb2) is shown. The black dots represent the concentration of MCP-1 secreted by each individual donor. Different aggregate samples are shown horizontally as follows; stir-20h total (white), stir-20h supernatant (enriched in nanometer size particles; light blue), and stir-20h pellet (enriched in micron sized particles; orange); see Figure 1. The media and buffer-stressed controls responded far below the threshold, and the LPS positive control responded much more intensely (SI≫2.0) than the aggregated protein.
Figure 3
Figure 3
Enrichment of different micron sized mAb2 particle populations using FACS separation. (A) Flowchart of experimental steps. (B) Subvisible particle counts in stirred sample (stir-20h) and bottom fraction after gravitational settling (bottom sample) as measured by MFI. (C) The percentage of particles in each size bin for these same two samples. (D) Upon FACS sorting the bottom sample, a two dimensional dot plot of response from forward vs side scattering signals (FSC Area vs. SSC Area) is generated with gatings labeled Sort I–IV, (E) Sorts I–IV were analyzed for subvisible particle distribution with MFI. (F) The percentage of particles in each size bin were determined. The graphs represent the average of three separate experiments (N=3) with the error bars representing one standard deviation.
Figure 4
Figure 4
Determination of relative standard deviation percentage (RSD %) of MFI particle count and determination of enrichment factors for FACS separated samples of mAb2 particles. (A) Representative FACS sorted sample of stir-induced aggregated mAb2, obtained as outlined in Figure 3 and having undergone two freeze-thaw cycles, was used for repeat MFI testing to determine RSD % as a function of particle size bins (N=9 with the error bars representing one standard deviation), and (B) enrichment analysis of FACS sorted samples (Sort I, II, III, IV) after undergoing two freeze-thaw cycles. Data are an average of three separate experiments (N=3) with the error bars representing one standard deviation.
Figure 5
Figure 5
Peripheral blood mononuclear cells (PBMC) from 7 human donors were incubated with mAb2 particle samples collected from the FACS separation and analyzed for cytokine release. Sort I (containing enriched 1–2 μm particles) (A, C) and Sort III (containing enriched 5–10 μm particles) (B, D) from FACS separation as well as the relevant controls were tested for the release of cytokines by multiplex cytokine analysis at the early phase (20 h) (A, B) and late phase (7 day) (C, D). FACS samples were added to the PBMC culture at equal volume and similar particle concentration (high concentration; > 20,000+ particles/mL in culture). The average concentration across donors (N=7, colored bars) of the 11 cytokines tested at the early phase (A, B) and 12 cytokines tested at the late phase (C, D) is shown. The percentage of responding donors (gray bars) represents the number of the 7 donors tested that responded higher (by magnitude of secreted cytokine) to each sort. The black dots represent the concentration of cytokines secreted by each individual donor. The LPS-and PHA-positive controls responded much more intensely (SI≫2.0) than the aggregated protein samples (data not shown).
Figure 6
Figure 6
Peripheral blood mononuclear cells (PBMC) from 8 human donors were incubated with FACS isolated mAb2 particle samples (containing very little soluble aggregates): sort II (enriched in 2–5 μm particles) (A, D), sort III (enriched for 5–10 μm particles) (B, E), and sort IV (enriched for particles > 10 μm) (C, F) and analyzed for their cytokine release. The FACS samples were added to the PBMC culture at similar particle numbers (low concentration; >9,000+ particles/mL in culture). These FACS samples as well as the relevant controls were tested for the release of signature cytokines by multiplex cytokine analysis at the early phase (20h) and late phase (7 days). The average concentration across donors (N=8, colored bars) of representative cytokines tested at the early and at the late phases is shown. The percentage of responding donors (gray bars) represents the number of the 8 donors tested that responded higher (by magnitude of secreted cytokines) to each sort. The black dots represent the concentration of cytokines secreted by each individual donor.
Figure 7
Figure 7
Biophysical analysis of mAb2 solutions containing stirring-induced particles that were used as starting material for FACS separation. Control samples (unstressed and heat denatured) and two stirred samples (Stir-20h, Bottom) of mAb2 were characterized for morphology by SEM and TEM, composition by EDS, overall secondary structure by solution FTIR and FTIR microscopy, and surface hydrophobicity by extrinsic fluorescence using 1,8-ANS as indicated in this Figure. Representative TEM and SEM images are shown at two resolutions (the unstressed control had virtually no particles so no TEM and SEM images are shown). For FTIR analysis, shifts in two peaks for intramolecular beta sheet content (occurring between 1620 to 1640 cm−1 and 1690 to 1700 cm−1) were monitored in the second derivative FTIR spectra. The peak minima are shown for each sample (N=3 with the error bars representing one standard deviation).
Figure 8
Figure 8
Representative TEM (200 nm and 1 μm resolution) and SEM (5 μm resolution) images of mAb2 particles of four different FACS sorted samples (Sort I, II, III, IV). The SEM particle images (representative graphs shown here), selected by the blue boxes, were also analyzed for their elemental composition by EDS as shown in far right column of the figure.
Figure 9
Figure 9
Radar plots of MFI morphology data (aspect ratio and intensity; refer to the key in B) for subvisible particles of mAb2 present in the starting material for FACS (bottom sample) and FACS sorted samples (sorts I-IV, see text) are shown in A. Radar plots show MFI morphology data distributions of the micron sized particles that fall within each of the three size bins shown in the key of B. The data shown are the average of three separate experiments (N = 3) and the error represents one standard deviation.

Similar articles

Cited by

References

    1. Baker MP, Reynolds HM, Lumicisi B, Bryson CJ. Immunogenicity of protein therapeutics: The key causes, consequences and challenges. Self Nonself. 2010;1(4):314–322. - PMC - PubMed
    1. Boven K, Knight J, Bader F, Rossert J, Eckardt KU, Casadevall N. Epoetin-associated pure red cell aplasia in patients with chronic kidney disease: solving the mystery. Nephrology, dialysis, transplantation: official publication of the European Dialysis and Transplant Association - European Renal Association. 2005;20(Suppl 3):iii33–40. - PubMed
    1. Casadevall N. What is antibody-mediated pure red cell aplasia (PRCA)? Nephrology, dialysis, transplantation: official publication of the European Dialysis and Transplant Association - European Renal Association. 2005;20(Suppl 4):iv3–8. - PubMed
    1. Chirino AJ, Ary ML, Marshall SA. Minimizing the immunogenicity of protein therapeutics. Drug Discov Today. 2004;9(2):82–90. - PubMed
    1. Claman HN. Tolerance to a Protein Antigen in Adult Mice and the Effect of Nonspecific Factors. Journal of Immunology. 1963;91:833–839. - PubMed

Publication types

LinkOut - more resources