

Targeting of the hydrophobic metabolome by pathogens
- PMID: 25754025
- PMCID: PMC7169838
- DOI: 10.1111/tra.12280
Targeting of the hydrophobic metabolome by pathogens
Abstract
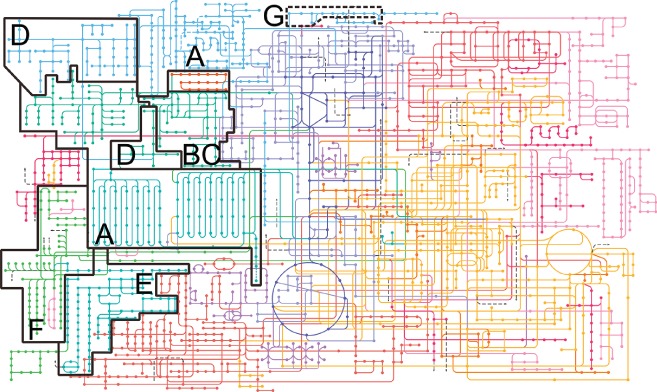
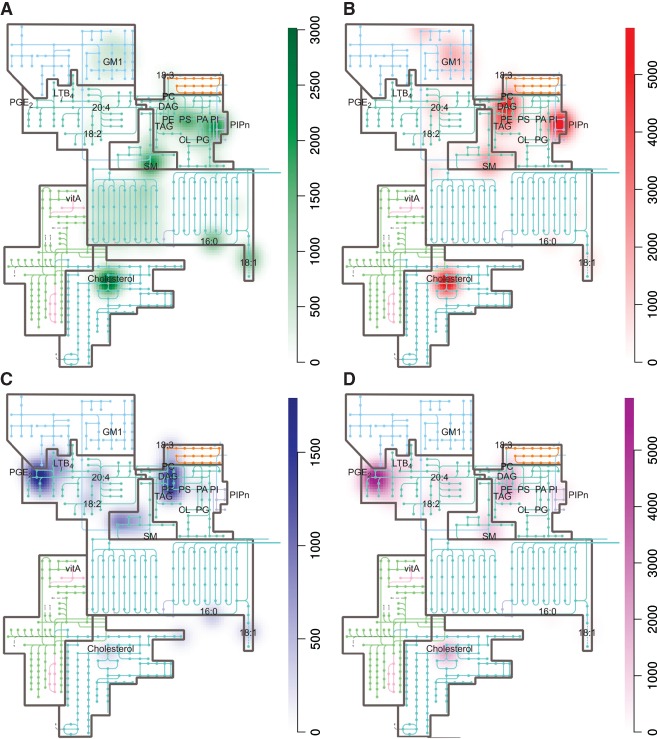
The hydrophobic molecules of the metabolome - also named the lipidome - constitute a major part of the entire metabolome. Novel technologies show the existence of a staggering number of individual lipid species, the biological functions of which are, with the exception of only a few lipid species, unknown. Much can be learned from pathogens that have evolved to take advantage of the complexity of the lipidome to escape the immune system of the host organism and to allow their survival and replication. Different types of pathogens target different lipids as shown in interaction maps, allowing visualization of differences between different types of pathogens. Bacterial and viral pathogens target predominantly structural and signaling lipids to alter the cellular phenotype of the host cell. Fungal and parasitic pathogens have complex lipidomes themselves and target predominantly the release of polyunsaturated fatty acids from the host cell lipidome, resulting in the generation of eicosanoids by either the host cell or the pathogen. Thus, whereas viruses and bacteria induce predominantly alterations in lipid metabolites at the host cell level, eukaryotic pathogens focus on interference with lipid metabolites affecting systemic inflammatory reactions that are part of the immune system. A better understanding of the interplay between host-pathogen interactions will not only help elucidate the fundamental role of lipid species in cellular physiology, but will also aid in the generation of novel therapeutic drugs.
Keywords: bacteria; fungi; host-pathogen interactions; lipidome; lipids; metabolome; parasites; viruses.
© 2015 John Wiley & Sons A/S. Published by John Wiley & Sons Ltd.
Figures
Similar articles
-
Lipids in host-pathogen interactions: pathogens exploit the complexity of the host cell lipidome.Prog Lipid Res. 2010 Jan;49(1):1-26. doi: 10.1016/j.plipres.2009.07.003. Epub 2009 Jul 26. Prog Lipid Res. 2010. PMID: 19638285 Free PMC article. Review.
-
Pathogen-derived extracellular vesicles coordinate social behaviour and host manipulation.Semin Cell Dev Biol. 2017 Jul;67:83-90. doi: 10.1016/j.semcdb.2017.03.004. Epub 2017 Mar 30. Semin Cell Dev Biol. 2017. PMID: 28366828 Review.
-
AMP-activated Protein Kinase As a Target For Pathogens: Friends Or Foes?Curr Drug Targets. 2016;17(8):942-53. doi: 10.2174/1389450116666150416120559. Curr Drug Targets. 2016. PMID: 25882224 Free PMC article. Review.
-
Palmitoylation, pathogens and their host.Biochem Soc Trans. 2013 Feb 1;41(1):84-8. doi: 10.1042/BST20120337. Biochem Soc Trans. 2013. PMID: 23356263 Review.
-
Emerging role of lipid droplets in host/pathogen interactions.J Biol Chem. 2012 Jan 20;287(4):2280-7. doi: 10.1074/jbc.R111.300202. Epub 2011 Nov 16. J Biol Chem. 2012. PMID: 22090026 Free PMC article.
Cited by
-
Host Lipid Bodies as Platforms for Intracellular Survival of Protozoan Parasites.Front Immunol. 2016 May 3;7:174. doi: 10.3389/fimmu.2016.00174. eCollection 2016. Front Immunol. 2016. PMID: 27199996 Free PMC article. Review.
-
Disruption of gut integrity and permeability contributes to enteritis in a fish-parasite model: a story told from serum metabolomics.Parasit Vectors. 2019 Oct 16;12(1):486. doi: 10.1186/s13071-019-3746-7. Parasit Vectors. 2019. PMID: 31619276 Free PMC article.
-
Open Field Study of Some Zea mays Hybrids, Lipid Compounds and Fumonisins Accumulation.Toxins (Basel). 2015 Sep 11;7(9):3657-70. doi: 10.3390/toxins7093657. Toxins (Basel). 2015. PMID: 26378580 Free PMC article.
-
Functional metabolomics: from biomarker discovery to metabolome reprogramming.Protein Cell. 2015 Sep;6(9):628-37. doi: 10.1007/s13238-015-0185-x. Epub 2015 Jul 2. Protein Cell. 2015. PMID: 26135925 Free PMC article. Review.
-
Playing Jekyll and Hyde-The Dual Role of Lipids in Fatty Liver Disease.Cells. 2020 Oct 6;9(10):2244. doi: 10.3390/cells9102244. Cells. 2020. PMID: 33036257 Free PMC article. Review.
References
-
- Smith CA, O'Maille G, Want EJ, Qin C, Trauger SA, Brandon TR, Custodio DE, Abagyan R, Siuzdak G. METLIN: a metabolite mass spectral database. Ther Drug Monit 2005;27:747–751. - PubMed
-
- Fenn JB, Mann M, Meng CK, Wong SF, Whitehouse CM. Electrospray ionization for mass spectrometry of large biomolecules. Science 1989;246:64–71. - PubMed
Publication types
MeSH terms
Grants and funding
LinkOut - more resources
Full Text Sources
Other Literature Sources
Medical
