. 2015 Dec;20(12):1538-45.
doi: 10.1038/mp.2015.9. Epub 2015 Mar 10.

Gene networks specific for innate immunity define post-traumatic stress disorder

Affiliations

Gene networks specific for innate immunity define post-traumatic stress disorder

M S Breen et al. Mol Psychiatry. 2015 Dec.

Abstract

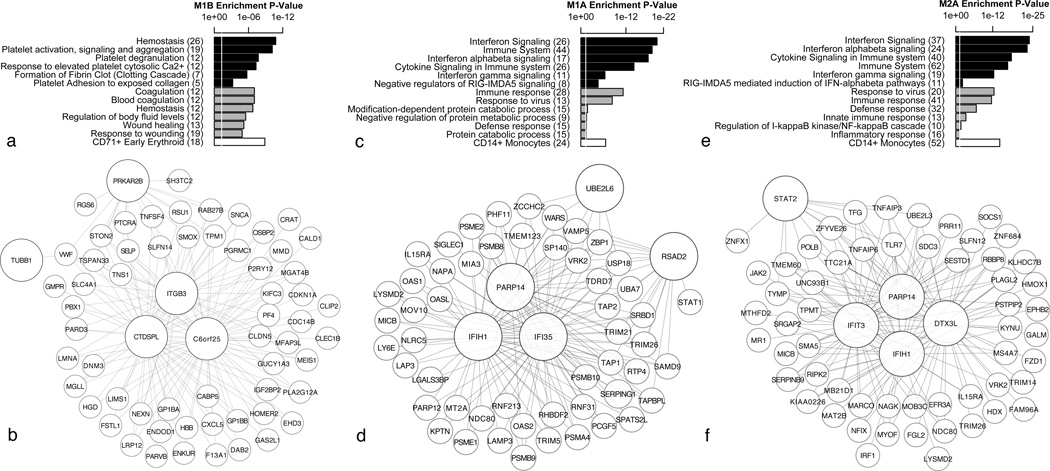
The molecular factors involved in the development of Post-Traumatic Stress Disorder (PTSD) remain poorly understood. Previous transcriptomic studies investigating the mechanisms of PTSD apply targeted approaches to identify individual genes under a cross-sectional framework lack a holistic view of the behaviours and properties of these genes at the system-level. Here we sought to apply an unsupervised gene-network based approach to a prospective experimental design using whole-transcriptome RNA-Seq gene expression from peripheral blood leukocytes of U.S. Marines (N=188), obtained both pre- and post-deployment to conflict zones. We identified discrete groups of co-regulated genes (i.e., co-expression modules) and tested them for association to PTSD. We identified one module at both pre- and post-deployment containing putative causal signatures for PTSD development displaying an over-expression of genes enriched for functions of innate-immune response and interferon signalling (Type-I and Type-II). Importantly, these results were replicated in a second non-overlapping independent dataset of U.S. Marines (N=96), further outlining the role of innate immune and interferon signalling genes within co-expression modules to explain at least part of the causal pathophysiology for PTSD development. A second module, consequential of trauma exposure, contained PTSD resiliency signatures and an over-expression of genes involved in hemostasis and wound responsiveness suggesting that chronic levels of stress impair proper wound healing during/after exposure to the battlefield while highlighting the role of the hemostatic system as a clinical indicator of chronic-based stress. These findings provide novel insights for early preventative measures and advanced PTSD detection, which may lead to interventions that delay or perhaps abrogate the development of PTSD.


Conflict of interest statement

The authors declare no conflict of interest.

Figures

Figure 1
Figure 1
Hierarchical cluster tree and post-deployment module structure in Dataset 1. Hierarchical cluster tree (dendrogram) of the combine post-deployment network of PTSD cases (N=47) and controls (N=47) comprising 10,184 genes. Each line represents a gene (leaf) and each low-hanging cluster represents a group of co-expressed genes with similar network connections (branch) on the tree. The first band underneath the tree indicates the nine detected, and subsequently analyzed, network modules. Genes shaded in grey were not assigned to a particular module and represent background noise. For a comprehensive functional annotation of each module and calculation of all significant module-trait relationships see Supplementary Table 3.
Figure 2
Figure 2
Module significance (MS) and module eigengene (ME) expression boxplots. MS was measured across all pre- and post-deployment modules in Dataset 1. WGCNA detected ten modules post-deployment from a combination of PTSD cases and control (a) and twenty-two modules at pre-deployment from a combination of PTSD risk cases and controls (c). The y-axis indicates MS by calculating the average −log10 p-values, generated by a moderated t test, for each gene within a particular module, when assessing differential expression between PTSD cases and controls. Here, a kruskal-wallis p-value was used only for descriptive purposes and not inferential. Modules denoted with an asterisk (*) have ME values significantly correlated to conditional states (i.e. PTSD cases or controls). Representative modules with high MS at post-deployment and pre-deployment were investigated for module expression differences. Differences in ME expression were measured using a two-tailed student’s t test on and a p-value < 0.05 is considered significant. Boxplots are displayed for each main group. Significant differences in ME expression were observed in post-deployment modules M1B and M1A (b) and in pre-deployment module M2A (d).
Figure 3
Figure 3
Module characterization for Dataset 1. Enrichment analysis and correlation networks for modules M1B (a & b) and M1A (c & d) identified post-deployment, and module M2A (e & f) identified pre-deployment in Dataset 1. Enrichment analysis was used to identify the top 6 REACTOME ontology terms (black bars), the top 6 DAVID ontology terms (grey bars) and the most significant cell-type signature (white bar) over-represented in the list of genes within each module. All terms were deemed significant as assessed by a hypergeometric test FDR corrected p-value <0.05 displayed as a white line. The total number of genes within each significant term is denoted within the brackets associated with that term. Gene-networks were constructed selecting the top 150 most significant connections ranked by kME. Nodes represent genes and edges represent correlations. The top 5 hub genes, those most correlated to ME values, are shown in larger sizes.
Figure 4
Figure 4
Venn Diagram of Innate Immune Modules across Dataset 1 and Dataset 2. Venn Diagram (a) depicting significant overlap in genes belonging to modules M1A post-deployment and M2A pre-deployment in Dataset 1 as well as modules M3A post-deployment and M4A pre-deployment in Dataset 2. Gene overlap () with associated hypergeometric p-value, in italics, are depicted for all pairwise comparisons of module genes (b). The overlap identified 51 genes found across all four analyses (c) which are displayed in the table along with the corresponding kME rank (i.e. rank of connectivity) for each gene within a particular module. A high rank indicates hub gene status (i.e. PTSD risk and PTSD associated markers). Numbers in bold outline the top 10 hub genes across each module, respectively. Genes are ordered accordingly to M2A kME. All 51 genes are displayed via heatmap in Supplementary Figure 4.

References

    1. Ramchand R, Schell TL, Karney BR, Osilla KM, Burns RM, Caldarone LB. Disparate prevalence estimates of PTSD among service members who served in Iraq and Afghanistan: possible explanations. J. Trauma. Stress. 2010;23:59–68. - PubMed
    1. Heinzelmann M, Gill J. Epigenetic Mechanisms Shape the Biological Response to Trauma and Risk for PTSD: A Critical Review. Nursing Research and Practice. 2013;2013:1–10. - PMC - PubMed
    1. Zieker J, Zieker D, Jatzko A, Dietzsch J, Niesel K, Schmitt A, et al. Differential gene expression in peripheral blood of patients suffering from post-traumatic stress disorder. Molecular Psychiatry. 2007;12.2:116–118. - PubMed
    1. Yehuda R, Holsboer F, Buxbaum JD, Miller-Myhsok B, Schmeidler J, Rein T, et al. Gene Expression Patterns Associated with Posttraumatic Stress Disorder Following Exposure to the World Trade Center Attacks. Biological Psychiatry. 2009;66.7:708–711. - PubMed
    1. Neylan TC, Sun B, Rempel H, Ross J, Lenoci M, O’Donovan A, et al. Suppressed monocyte gene expression profile in men versus women with PTSD. Brain, Behavior, and Immunity. 2011;25.3:524–531. - PMC - PubMed

Publication types