

Relative cerebral blood volume is a potential predictive imaging biomarker of bevacizumab efficacy in recurrent glioblastoma
- PMID: 25754089
- PMCID: PMC4490872
- DOI: 10.1093/neuonc/nov028
Relative cerebral blood volume is a potential predictive imaging biomarker of bevacizumab efficacy in recurrent glioblastoma
Abstract
Background: To analyze the relevance of dynamic susceptibility-weighted contrast-enhanced MRI (DSC-MRI) derived relative cerebral blood volume (rCBV) analysis for predicting response to bevacizumab (BEV) in patients with recurrent glioblastoma (rGB).
Methods: A total of 127 patients diagnosed with rGB receiving either bevacizumab (71 patients, BEV cohort) or alkylating chemotherapy (56 patients, non-BEV cohort) underwent conventional anatomic MRI and DSC-MRI at baseline and at first follow-up after treatment initiation. The mean rCBV of the contrast-enhancing tumor (cT1) as well as cT1 and fluid-attenuated inversion recovery (FLAIR) volumes at both time points were correlated with progression-free survival (PFS) and overall survival (OS) using Cox proportional hazard models, logistic regression, and the log-rank test.
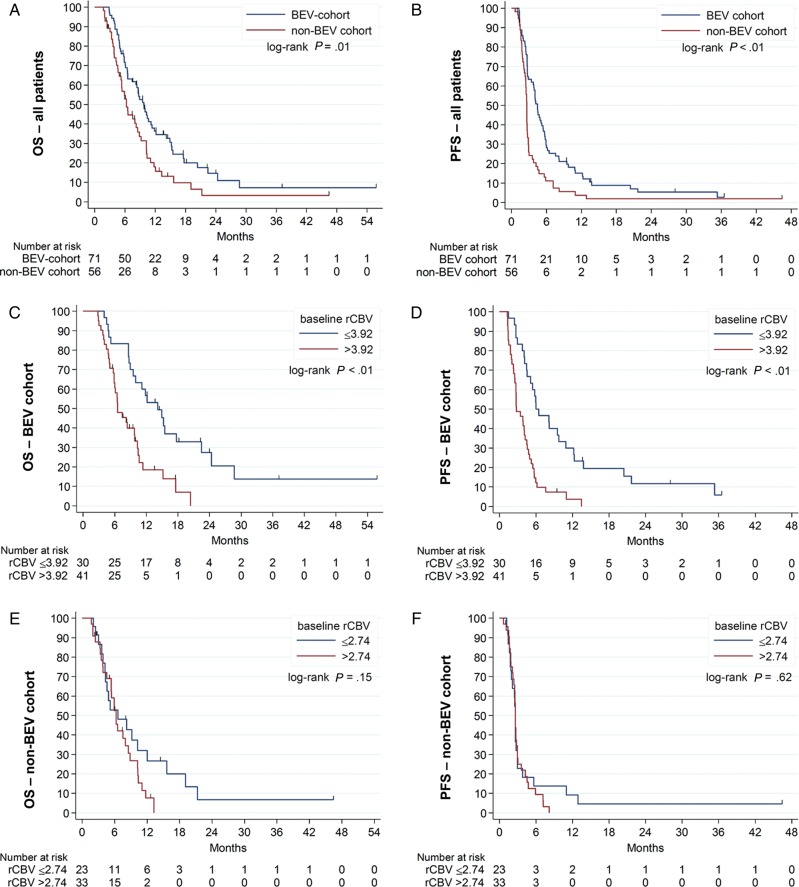
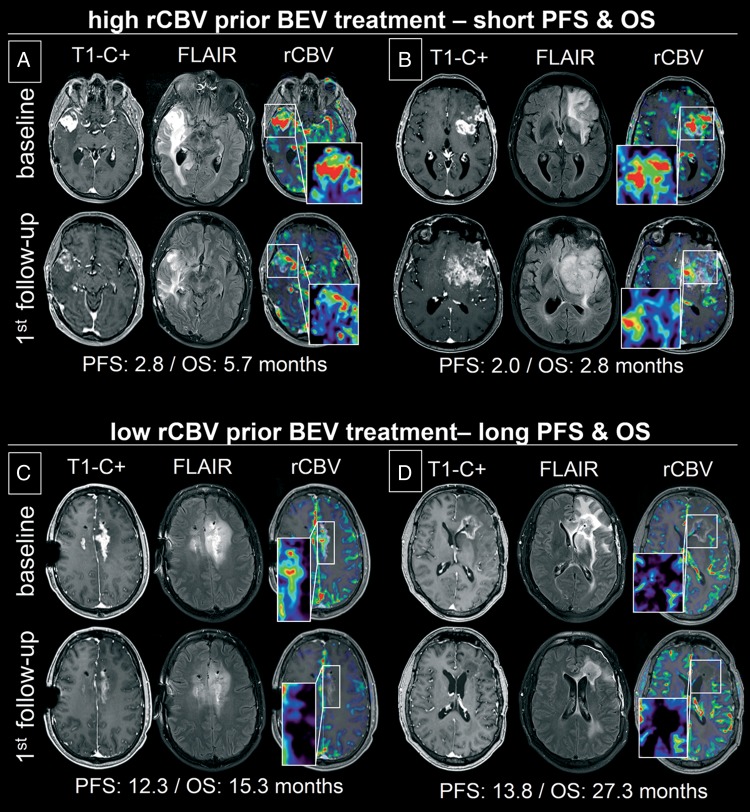
Results: Baseline rCBV was associated with both PFS (hazard ratio [HR] = 1.3; P < .01) and OS (HR = 1.3; P < .01) in the BEV cohort and predicted 6-month PFS in 82% and 12-month OS in 79% of patients, whereas it was not associated with PFS (HR = 1.0; P = .70) or OS (HR = 1.0; P = .47) in the non-BEV cohort. Corresponding median OS and PFS rates in the BEV cohort for patients with rCBV-values less than 3.92 (optimal threshold from receiver operating characteristic [ROC] analysis of 12-month OS data) were 14.2 and 6.0 months, as compared to 6.6 and 2.8 months for patients with rCBV-values greater than 3.92 (P < .01, respectively). cT1 and FLAIR volumes at first follow-up were significant predictors of 6-month PFS and 12-month OS in the BEV cohort but not in the non-BEV cohort. Corresponding volumes at baseline were not significant in any cohort.
Conclusions: Pretreatment rCBV is a potential predictive imaging biomarker in BEV-treated rGB but not alkylating chemotherapy-treated rGB, which is superior to volumetric analysis of conventional anatomic MRI and predicts 6-month PFS and 12-month OS in 80% of BEV-treated patients.
Keywords: bevacizumab; biomarker; cerebral blood volume; glioblastoma; rCBV.
© The Author(s) 2015. Published by Oxford University Press on behalf of the Society for Neuro-Oncology. All rights reserved. For permissions, please e-mail: journals.permissions@oup.com.
Figures
Comment in
-
Predictive imaging marker of bevacizumab efficacy: perfusion MRI.Neuro Oncol. 2015 Aug;17(8):1046-7. doi: 10.1093/neuonc/nov067. Epub 2015 Apr 24. Neuro Oncol. 2015. PMID: 25910842 Free PMC article. No abstract available.
References
-
- Wong ET, Brem S. Antiangiogenesis treatment for glioblastoma multiforme: challenges and opportunities. J Natl Compr Canc Netw. 2008;6(5):515–522. - PubMed
-
- Jain RK, di Tomaso E, Duda DG, et al. Angiogenesis in brain tumours. Nat Rev Neurosci. 2007;8(8):610–622. - PubMed
-
- Wen PY, Macdonald DR, Reardon DA, et al. Updated response assessment criteria for high-grade gliomas: response assessment in neuro-oncology working group. J Clin Oncol. 2010;28(11):1963–1972. - PubMed
-
- Nowosielski M, Wiestler B, Goebel G, et al. Progression types after antiangiogenic therapy are related to outcome in recurrent glioblastoma. Neurology. 2014;82(19):1684–1692. - PubMed
Publication types
MeSH terms
Substances
LinkOut - more resources
Full Text Sources
Other Literature Sources
Medical
