. 2015 May;83(5):2053-64.
doi: 10.1128/IAI.02339-14. Epub 2015 Mar 9.

Superantigenic Yersinia pseudotuberculosis induces the expression of granzymes and perforin by CD4+ T cells

Affiliations

Superantigenic Yersinia pseudotuberculosis induces the expression of granzymes and perforin by CD4+ T cells

Agathe Goubard et al. Infect Immun. 2015 May.

Abstract

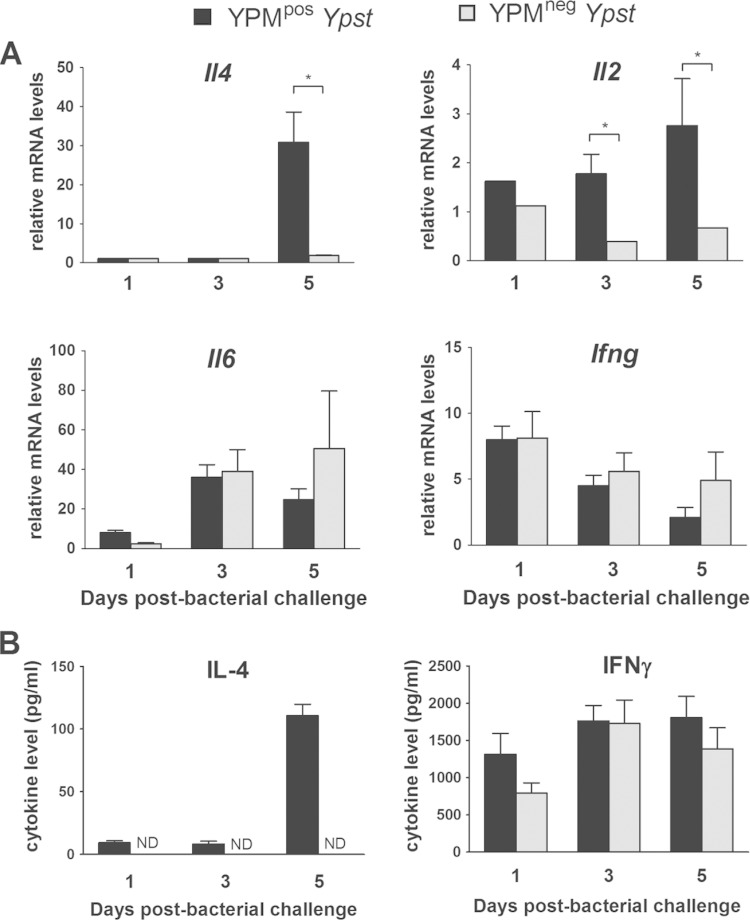
Bacterial superantigens (SAgs) are immunostimulatory toxins that induce acute diseases mainly through the massive release of inflammatory cytokines. Yersinia pseudotuberculosis is the only Gram-negative bacterium known to produce a SAg (Y. pseudotuberculosis-derived mitogen [YPM]). This SAg binds major histocompatibility complex class II molecules on antigen-presenting cells and T cell receptors (TcR) bearing the variable region Vβ3, Vβ9, Vβ13.1, or Vβ13.2 (in humans) and Vβ7 or Vβ8 (in mice). We have previously shown that YPM exacerbates the virulence of Y. pseudotuberculosis in mice. With a view to understanding the mechanism of YPM's toxicity, we compared the immune response in BALB/c mice infected with a YPM-producing Y. pseudotuberculosis or the corresponding isogenic, SAg-deficient mutant. Five days after infection, we observed strong CD4(+) Vβ7(+) T cell expansion and marked interleukin-4 (IL-4) production in mice inoculated with SAg-producing Y. pseudotuberculosis. These phenomena were correlated with the activation of ypm gene transcription in liver and spleen. A transcriptomic analysis revealed that the presence of YPM also increased expression of granzyme and perforin genes in the host's liver and spleen. This expression was attributed to a CD4(+) T cell subset, rather than to natural killer T (NKT) cells that display a TcR with a Vβ region that is potentially recognized by YPM. Increased production of cytotoxic molecules was correlated with hepatotoxicity, as demonstrated by an increase in plasma alanine aminotransferase activity. Our results demonstrate that YPM activates a potentially hepatotoxic CD4(+) T cell population.


Figures

FIG 1
FIG 1
Infection with YPMpos Y. pseudotuberculosis is associated with conventional Vβ7+ and Vβ8+ CD4+ T cell proliferation in spleen and liver. BALB/c mice were infected with 1 × 10⁴ to 3 × 10⁴ YPMpos or YPMneg Y. pseudotuberculosis (Ypst) in PBS or they received PBS alone (noninfected). Cellular analyses were performed 5 days after bacterial challenge. (A) The absolute numbers of splenocytes and hepatic immune cells were expressed as the means plus standard errors of the means (SEMs) (error bars). (B) Absolute counts of CD3+ cells and Gr1+ cells were determined by flow cytometry (means plus SEMs). (C) Analysis of the Vβ7+ and Vβ8+ populations in spleen and liver was performed by flow cytometry. The results are expressed as a percentage of the total CD3+ cells (mean plus SEM). (D) BALB/c and CD1d−/− mice were infected with 1 × 10⁴ to 3 × 10⁴ YPMpos or YPMneg Y. pseudotuberculosis and were sacrificed on day 5 postinfection. Splenocytes were analyzed by flow cytometry. Results are expressed as a percentage of total CD3+ T cells (mean plus SEM). Values that are significantly different (P < 0.05) in a Mann-Whitney nonparametric test are indicated by a bar and asterisk. Values that are not significantly different (NS) are indicated. The data (n = 3 to 6) are representative of at least two independent experiments.
FIG 2
FIG 2
YPMpos Y. pseudotuberculosis induces IL-2 and IL-4 production. BALB/c mice were challenged with 1 × 10⁴ to 3 × 10⁴ YPMpos or YPMneg Y. pseudotuberculosis (Ypst) in PBS or received PBS alone (noninfected). (A) Levels of cytokine-specific mRNAs in splenic tissues were measured 1, 3, and 5 days after the bacterial challenge by using RT-competitive PCR. The values are expressed relative to those in noninfected animals. A relative mRNA level of 1 corresponds to an absence of cytokine-specific mRNA production compared to noninfected animals. (B) Serum levels of IL-4 and IFN-γ were detected with ELISAs on days 1, 3, and 5 postchallenge. No IL-4 or IFN-γ could be detected in serum of noninfected mice (data not shown). Each sample was tested in duplicate. Values that are significantly different (P < 0.05) in a Mann-Whitney nonparametric test are indicated by a bar and asterisk. The data (n = 5 or 6) are expressed as the mean plus SEM and are representative of at least two independent experiments. ND, not detected.
FIG 3
FIG 3
ypm gene transcription is activated on day 5 postchallenge. BALB/c mice were challenged with 1 × 10⁴ to 3 × 10⁴ YPMpos Y. pseudotuberculosis. On days 1, 3, and 5 postinfection, the spleen and liver were divided into two aliquots: one for mRNA extraction and quantification of the ypm transcripts by quantitative RT-PCR and the other for bacterial counts. Each symbol represents the number of ypm transcripts/103 CFU for an individual animal, and the horizontal bar represents the median value for the group of animals. Values that are significantly different in a Mann-Whitney nonparametric test are indicated by a bar and asterisk as follows: *, P < 0.025; **, P < 0.001. The data (n = 5) are representative of two independent experiments.
FIG 4
FIG 4
Granzyme and perforin genes are activated in YPMpos Y. pseudotuberculosis-infected mice. BALB/c mice were challenged with 1 × 10⁴ to 3 × 10⁴ YPMpos or YPMneg Y. pseudotuberculosis (Ypst) in PBS or received PBS alone (noninfected). Transcription of granzyme and perforin genes was measured by real-time PCR and was expressed as the fold increase (2−ΔΔCT) in the YPMpos or YPMneg Y. pseudotuberculosis-infected mice compared to noninfected mice. A relative mRNA level of 1 corresponds to an absence of granzyme- or perforin-specific mRNA production compared to noninfected animals. (A) Relative expression of granzyme and perforin genes in the spleens of infected mice on days 1, 3, and 5 after challenge (n = 5). (B) Relative expression of granzyme and perforin genes in the liver on day 5 after bacterial challenge (n = 5). The data are expressed as the means plus SEMs. Values that are significantly different (P < 0.01) in a Mann-Whitney nonparametric test are indicated by a bar and two asterisks. ND, not detected.
FIG 5
FIG 5
Depletion of CD4+ cells abolishes the YPM-mediated production of cytotoxic molecules. BALB/c mice received intraperitoneal injections of 200 μg of anti-CD4 antibody, anti-CD8 antibody, or the isotype control 1 day before challenge with 1 × 10⁴ to 3 × 10⁴ YPMpos Y. pseudotuberculosis and then again 2 days postchallenge. Animals were sacrificed 5 days after infection. (A) In vivo cell depletion was confirmed by flow cytometry. (B) GzmA, GzmB, and Prf transcripts were detected in the liver. mRNA levels were expressed relative to the values in nondepleted mice infected with YPMpos Y. pseudotuberculosis. (C) Hepatic granzyme B-positive (GzmB+) CD3+ cells were detected by flow cytometry. The percentage was obtained after gating on the lymphocyte population. The number in the top right corner of representative flow cytometry panels represents the percentage of GzmB+ CD3+ cells in the lymphocyte population. The data (n = 3) are expressed as the means plus SEMs and are representative of at least two independent experiments. Significant differences (P < 0.05) are indicated by a bar and asterisk (Mann-Whitney nonparametric test).
FIG 6
FIG 6
YPM-mediated granzyme and perforin gene activation is not impaired in NKT cell-deficient mice. BALB/c and CD1d−/− mice were infected with 1 × 10⁴ to 3 × 10⁴ YPMpos or YPMneg Y. pseudotuberculosis (Ypst) in PBS or received PBS alone (noninfected). Specific granzyme A (GzmA) and perforin (Prf1) transcripts were detected by RT-PCR in the spleen or liver on day 5 postinfection. Results are expressed as the fold increase relative to noninfected mice (mean plus SEM). The data (n = 3) are representative of at least two independent experiments. Significant differences (P < 0.05) are indicated by a bar and asterisk (Mann-Whitney nonparametric test).
FIG 7
FIG 7
YPM increases the release of hepatic transaminases. ALT and AST activities (in international units per liter) in plasma of BALB/c mice were assayed 5 days after a challenge with 1 × 10⁴ to 3 × 10⁴ YPMpos or YPMneg Y. pseudotuberculosis (Ypst). Control (noninfected) mice received PBS only. Each symbol represents the value in an individual animal, and the horizontal bar corresponds to the median value for the group of animals (n = 6 or 7). Significant differences in a Mann-Whitney nonparametric test are indicated by a bar and asterisk as follows: *, P < 0.05; **, P < 0.01.

Similar articles

Cited by

References

    1. White J, Herman A, Pullen AM, Kubo R, Kappler JW, Marrack P. 1989. The V beta-specific superantigen staphylococcal enterotoxin B: stimulation of mature T cells and clonal deletion in neonatal mice. Cell 56:27–35. doi:10.1016/0092-8674(89)90980-X. - DOI - PubMed
    1. Llewelyn M, Cohen J. 2002. Superantigens: microbial agents that corrupt immunity. Lancet Infect Dis 2:156–162. doi:10.1016/S1473-3099(02)00222-0. - DOI - PubMed
    1. Muller-Alouf H, Carnoy C, Simonet M, Alouf JE. 2001. Superantigen bacterial toxins: state of the art. Toxicon 39:1691–1701. doi:10.1016/S0041-0101(01)00156-8. - DOI - PubMed
    1. Lappin E, Ferguson AJ. 2009. Gram-positive toxic shock syndromes. Lancet Infect Dis 9:281–290. doi:10.1016/S1473-3099(09)70066-0. - DOI - PubMed
    1. Macias ES, Pereira FA, Rietkerk W, Safai B. 2011. Superantigens in dermatology. J Am Acad Dermatol 64:455–472. doi:10.1016/j.jaad.2010.03.044. - DOI - PubMed

Publication types

MeSH terms

LinkOut - more resources