

The polycomb group protein L3MBTL1 represses a SMAD5-mediated hematopoietic transcriptional program in human pluripotent stem cells
- PMID: 25754204
- PMCID: PMC4400644
- DOI: 10.1016/j.stemcr.2015.02.003
The polycomb group protein L3MBTL1 represses a SMAD5-mediated hematopoietic transcriptional program in human pluripotent stem cells
Abstract
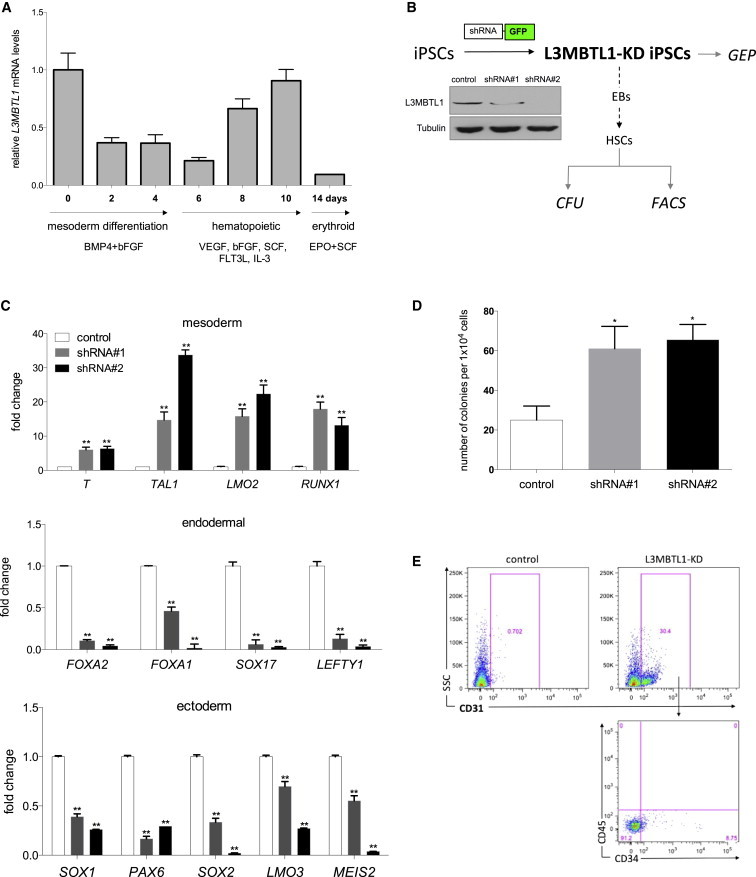
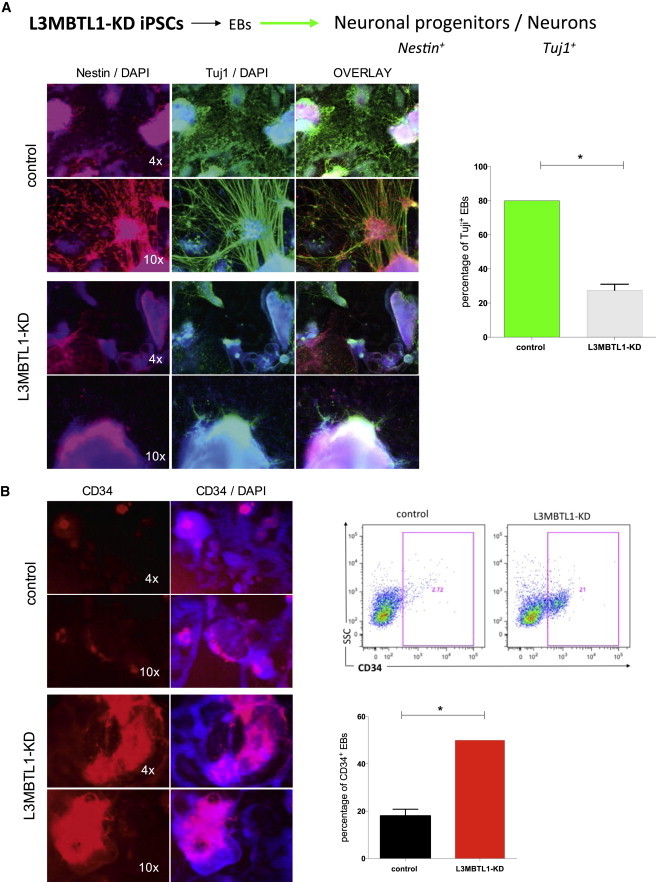
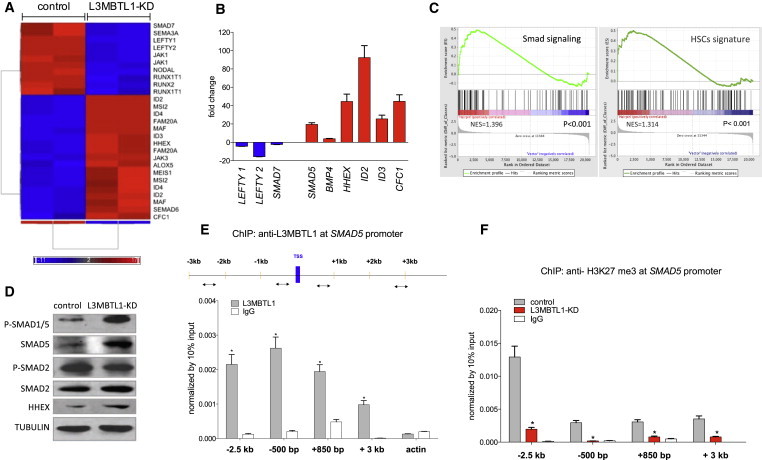
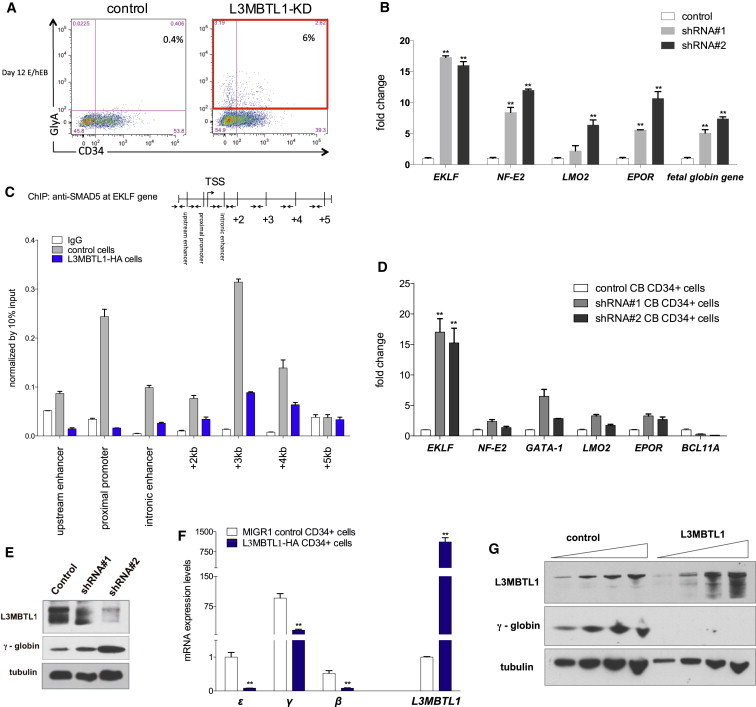
Epigenetic regulation of key transcriptional programs is a critical mechanism that controls hematopoietic development, and, thus, aberrant expression patterns or mutations in epigenetic regulators occur frequently in hematologic malignancies. We demonstrate that the Polycomb protein L3MBTL1, which is monoallelically deleted in 20q- myeloid malignancies, represses the ability of stem cells to drive hematopoietic-specific transcriptional programs by regulating the expression of SMAD5 and impairing its recruitment to target regulatory regions. Indeed, knockdown of L3MBTL1 promotes the development of hematopoiesis and impairs neural cell fate in human pluripotent stem cells. We also found a role for L3MBTL1 in regulating SMAD5 target gene expression in mature hematopoietic cell populations, thereby affecting erythroid differentiation. Taken together, we have identified epigenetic priming of hematopoietic-specific transcriptional networks, which may assist in the development of therapeutic approaches for patients with anemia.
Copyright © 2015 The Authors. Published by Elsevier Inc. All rights reserved.
Figures
Similar articles
-
Depletion of L3MBTL1 promotes the erythroid differentiation of human hematopoietic progenitor cells: possible role in 20q- polycythemia vera.Blood. 2010 Oct 14;116(15):2812-21. doi: 10.1182/blood-2010-02-270611. Epub 2010 Jun 28. Blood. 2010. PMID: 20585043 Free PMC article.
-
Linking Hematopoietic Differentiation to Co-Expressed Sets of Pluripotency-Associated and Imprinted Genes and to Regulatory microRNA-Transcription Factor Motifs.PLoS One. 2017 Jan 4;12(1):e0166852. doi: 10.1371/journal.pone.0166852. eCollection 2017. PLoS One. 2017. PMID: 28052084 Free PMC article.
-
ID1 and ID3 represent conserved negative regulators of human embryonic and induced pluripotent stem cell hematopoiesis.J Cell Sci. 2011 May 1;124(Pt 9):1445-52. doi: 10.1242/jcs.077511. Epub 2011 Apr 12. J Cell Sci. 2011. PMID: 21486943
-
Histone modifications controlling native and induced neural stem cell identity.Curr Opin Genet Dev. 2015 Oct;34:95-101. doi: 10.1016/j.gde.2015.08.003. Epub 2015 Oct 24. Curr Opin Genet Dev. 2015. PMID: 26476692 Review.
-
Transcriptional regulation of hematopoietic stem cell development in zebrafish.Exp Hematol. 2005 Sep;33(9):1007-14. doi: 10.1016/j.exphem.2005.06.013. Exp Hematol. 2005. PMID: 16140148 Review.
Cited by
-
The DEK Oncoprotein Is a Critical Component of the EKLF/KLF1 Enhancer in Erythroid Cells.Mol Cell Biol. 2015 Nov;35(21):3726-38. doi: 10.1128/MCB.00382-15. Epub 2015 Aug 24. Mol Cell Biol. 2015. PMID: 26303528 Free PMC article.
-
Sticky, Adaptable, and Many-sided: SAM protein versatility in normal and pathological hematopoietic states.Bioessays. 2023 Aug;45(8):e2300022. doi: 10.1002/bies.202300022. Epub 2023 Jun 15. Bioessays. 2023. PMID: 37318311 Free PMC article. Review.
-
Association of DDX5/p68 protein with the upstream erythroid enhancer element (EHS1) of the gene encoding the KLF1 transcription factor.J Biol Chem. 2023 Dec;299(12):105489. doi: 10.1016/j.jbc.2023.105489. Epub 2023 Nov 22. J Biol Chem. 2023. PMID: 38000658 Free PMC article.
-
Pure Red Cell Aplasia with Del(20q) Sensitive for Immunosuppressive Treatment.Case Rep Hematol. 2020 Jan 20;2020:1262038. doi: 10.1155/2020/1262038. eCollection 2020. Case Rep Hematol. 2020. PMID: 32082654 Free PMC article.
-
Activity-Induced Regulation of Synaptic Strength through the Chromatin Reader L3mbtl1.Cell Rep. 2018 Jun 12;23(11):3209-3222. doi: 10.1016/j.celrep.2018.05.028. Cell Rep. 2018. PMID: 29898393 Free PMC article.
References
-
- Adelman C.A., Chattopadhyay S., Bieker J.J. The BMP/BMPR/Smad pathway directs expression of the erythroid-specific EKLF and GATA1 transcription factors during embryoid body differentiation in serum-free media. Development. 2002;129:539–549. - PubMed
-
- Bench A.J., Nacheva E.P., Hood T.L., Holden J.L., French L., Swanton S., Champion K.M., Li J., Whittaker P., Stavrides G., UK Cancer Cytogenetics Group (UKCCG) Chromosome 20 deletions in myeloid malignancies: reduction of the common deleted region, generation of a PAC/BAC contig and identification of candidate genes. Oncogene. 2000;19:3902–3913. - PubMed
-
- Bench A.J., Li J., Huntly B.J., Delabesse E., Fourouclas N., Hunt A.R., Deloukas P., Green A.R. Characterization of the imprinted polycomb gene L3MBTL, a candidate 20q tumour suppressor gene, in patients with myeloid malignancies. Br. J. Haematol. 2004;127:509–518. - PubMed
Publication types
MeSH terms
Substances
Associated data
- Actions
Grants and funding
LinkOut - more resources
Full Text Sources
Other Literature Sources
Molecular Biology Databases
