. 2015 Mar 10:6:6497.
doi: 10.1038/ncomms7497.

Supramolecular synergy in the boundary lubrication of synovial joints

Affiliations

Supramolecular synergy in the boundary lubrication of synovial joints

Jasmine Seror et al. Nat Commun. .

Abstract

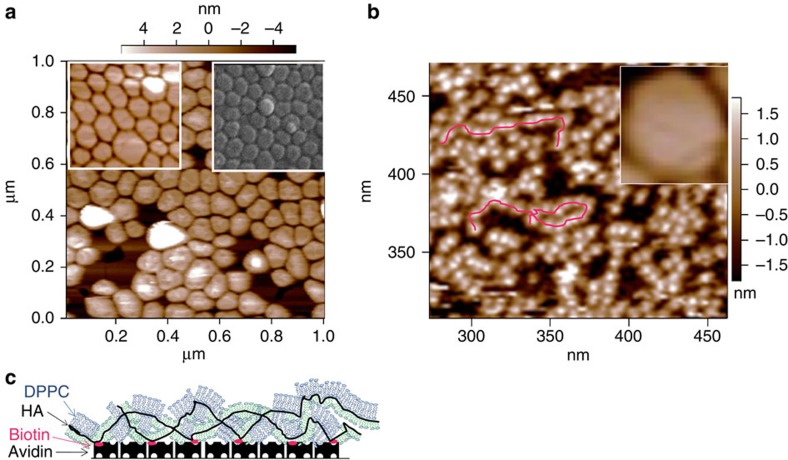
Hyaluronan, lubricin and phospholipids, molecules ubiquitous in synovial joints, such as hips and knees, have separately been invoked as the lubricants responsible for the remarkable lubrication of articular cartilage; but alone, these molecules cannot explain the extremely low friction at the high pressures of such joints. We find that surface-anchored hyaluronan molecules complex synergistically with phosphatidylcholine lipids present in joints to form a boundary lubricating layer, which, with coefficient of friction μ≈0.001 at pressures to over 100 atm, has a frictional behaviour resembling that of articular cartilage in the major joints. Our findings point to a scenario where each of the molecules has a different role but must act together with the others: hyaluronan, anchored at the outer surface of articular cartilage by lubricin molecules, complexes with joint phosphatidylcholines to provide the extreme lubrication of synovial joints via the hydration-lubrication mechanism.


Figures

Figure 1
Figure 1. Micrographs of liposomes on mica with and without HA.
Tapping mode atomic force microscope (AFM) micrographs of mica surfaces immersed in water following 12±2 h incubation in liposome dispersions and subsequent rinsing (Methods). (a) Initially bare mica surfaces following incubation in a DPPC-SUV/HA (dipalmitoylphosphatidylcholine–single unilamellar vesicles/hyaluronic acid) mixture (concentrations 1 mg ml−1 of each component) that had been stirred in the dark for 24–48 h at 60–70°C (higher than the liposome solid-ordered to liquid disordered transition temperature TM(DPPC)=41C). The left inset shows initially bare mica surface following incubation in a DPPC-SUV dispersion (1 mg ml−1, no HA) that had been stirred in the dark for 24–48 h at 60–70°C. The right inset shows cryo-scanning electron microscopy image of a mica surface following incubation in a DPPC-SUV dispersion (no HA), from ref. (Reprinted from ref. , with permission from Elsevier). (b) Mica surfaces coated with avidin and biotinylated HA (bHA) following incubation in a DPPC-SUV dispersion (1 mg ml−1, no HA) that had been stirred in the dark for 24–48 h at 60–70°. The inset shows (on the same scale) a single intact liposome taken from the main figure in (a). The red lines are a guide to the eye of necklace-like HA-DPPC complexes of structure as attributed in the cartoon (c) (blue: bilayers; green: monolayers). These micrographs show that HA in the bulk liposome dispersion has little effect on the liposome attachment to the surfaces (a), while when HA is attached to the surface (b), it disrupts the liposomes and complexes with the DPPC.
Figure 2
Figure 2. Normal force profiles between avidin-bHA-DPPC-coated mica surfaces.
(a) Normal forces Fn(D) as a function of surface separation D between two avidin-bHA-DPPC-coated mica surfaces as in Fig. 1b, measured in the surface force balance (SFB). Data are normalized as Fn(D)/R=2πE(D), where R is the mean surface curvature radius and E(D) is the interaction energy/unit area. Full symbols are first approaches, crossed symbols are second or third approaches and empty symbols are receding profiles. Black symbols refer to measurements in water, red symbols refer to measurements in 0.15 M KNO3 salt solution. A kink often observed in the first approach profiles around D≈100 nm (enlarged in inset, circled) is attributed to squeeze-out of residual, loosely attached liposomes. Data are based on five independent experiments with two to four different contact positions in each experiment. (b) A schematic of the SFB used for measuring forces between curved surfaces in a crossed-cylinder geometry a closest separation D apart. PZT is the sectored piezo-electric tube providing both normal and lateral motion to the upper surface, while Kn and Ks are the springs monitoring the normal and shear forces, respectively (Methods). Error bar, shown at low values of Fn(D)/R, corresponds to δFn(D)δD.Kn, where δD=3 nm is the estimated uncertainty arising from thermal drift and optical fringe errors (Methods). Also shown, for comparison, are the normalized force versus separation profiles between bare mica surfaces across water (controls from present study, blue stars and a broken blue line as guide to the eye), and between mica surfaces coated with DPPC liposomic vectors alone, summarized as a shaded band.
Figure 3
Figure 3. Shear forces measurements.
(a,b) Typical shear force (Fs) versus time traces, taken directly from the SFB, when two avidin-bHA-DPPC-bearing mica surfaces (Fig. 1b) slide past against each other in water. Top zig-zag traces are the back and forth lateral motion applied to the upper mica surface. All the other traces are the shear responses transmitted to the lateral springs at different surface separations and different mean pressures P. P values (estimated accuracy to ±20%) were evaluated from the contact area A derived from the flattening of the interference fringes as P=Fn/A. (c) shear force as a function of sliding velocity vs at pressure P=161 atm. (d) Shear force as a function of time for a given pressure P=61 atm and sliding velocity vs≈0.4 μm s−1. Results reported are based on shear force measurements taken in five different experiments and two to four different contact position within each experiment.
Figure 4
Figure 4. Variation of shear forces with load.
(a) Variation of shear forces (Fs) with normal load (Fn) between avidin-bHA-DPPC-bearing surfaces across water (black symbols) and 0.15 M KNO3 solution (red symbols). The black data points are the Fs versus Fn variation for the highest and lowest high-pressure μ (coefficient of friction) values, while the shaded area includes all data with intermediate μ values (omitted for clarity). The limiting pressures P at the maximal loads (Fn, max) for selected profiles and the corresponding values of μ=Fs, max/Fn, max are indicated, while the broken line (μ=1.5 × 10⁻³) is a guide to the mean of the data. (b) Fs versus Fn variation for first (empty symbols) and second (full symbols) approaches at different contact points, showing the reduction in friction following removal of residual liposomes. (c) Fs versus Fn variation between sliding mica surfaces bearing avidin-bHA alone (before complexation with PC lipids), from this study (stars) and from ref. (crosses); the broken line is taken from the main figure, showing the reduction in μ by over two orders of magnitude once PC lipids complex with the HA. Results reported are based on five different experiments and two to four different contact position within each experiment.

Comment in

Similar articles

Cited by

References

    1. Hodge W. A. et al.. Contact pressures from an instrumented hip endoprosthesis. J. Bone Joint Surg. Am. 71A, 1378–1386 (1989) . - PubMed
    1. Radin E. L. & Paul I. L. Response of joints to impact loading. I. In vitro wear. Arthritis Rheum. 14, 356–362 (1971) . - PubMed
    1. Forster H. & Fisher J. The influence of loading time and lubricant on the friction of articular cartilage. Proc. Inst. Mech. Eng. H. 210, 109–119 (1996) . - PubMed
    1. Afoke N. Y. P., Byers P. D. & Hutton W. C. Contact pressures in the human hip joint. J. Bone Joint Surg. Am. 69B, 536–541 (1987) . - PubMed
    1. Dowson D. in Symposium on Lubrication and wear in living and artificial joints 45–54Inst. Mech, Eng. (1967) .

Publication types