. 2015 Mar 10:6:6356.
doi: 10.1038/ncomms7356.

Brown fat activation reduces hypercholesterolaemia and protects from atherosclerosis development

Affiliations

Brown fat activation reduces hypercholesterolaemia and protects from atherosclerosis development

Jimmy F P Berbée et al. Nat Commun. .

Abstract

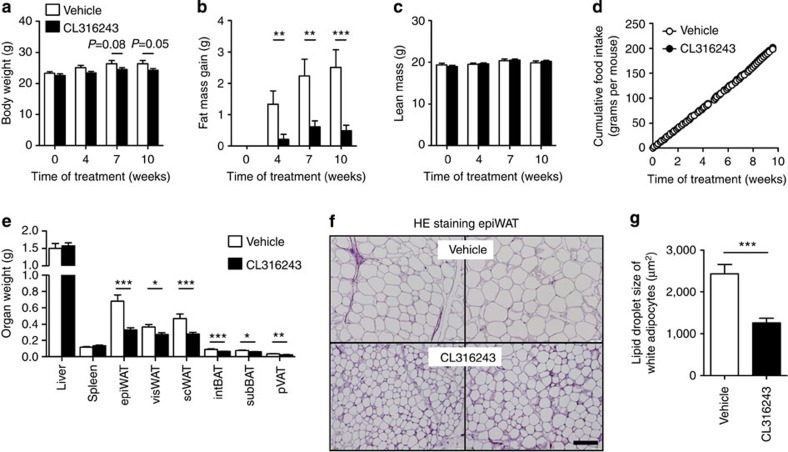
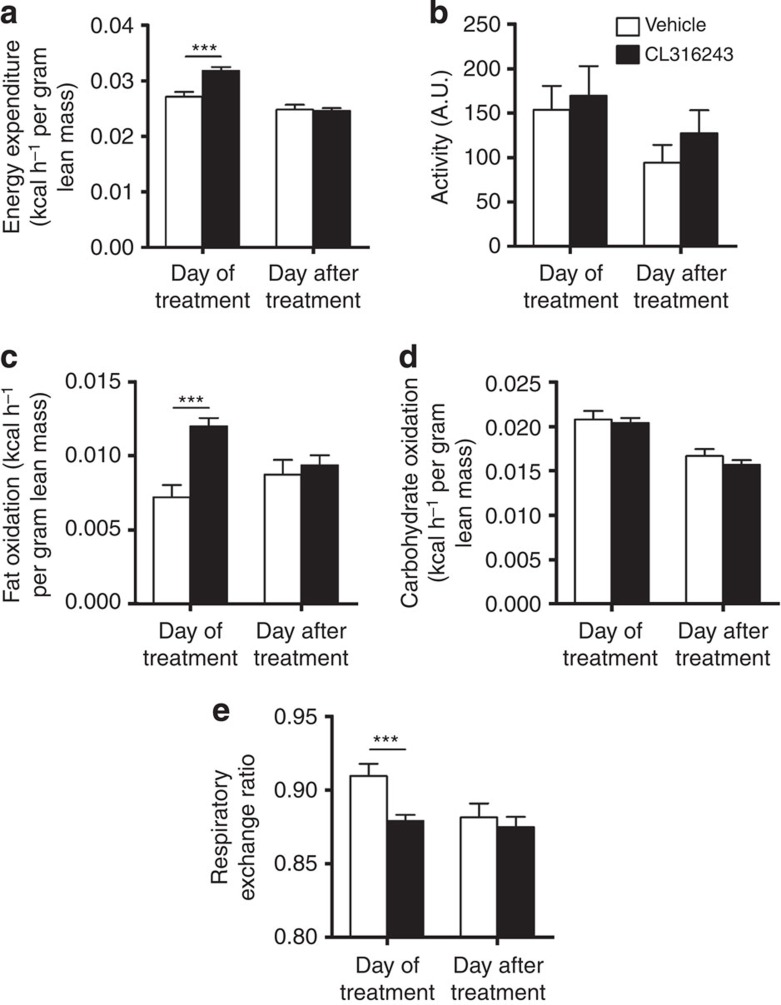
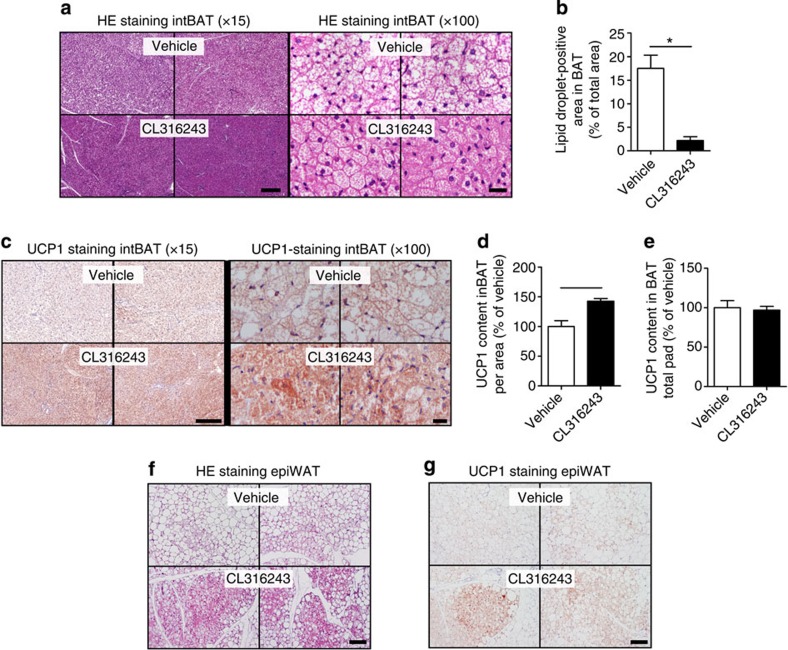
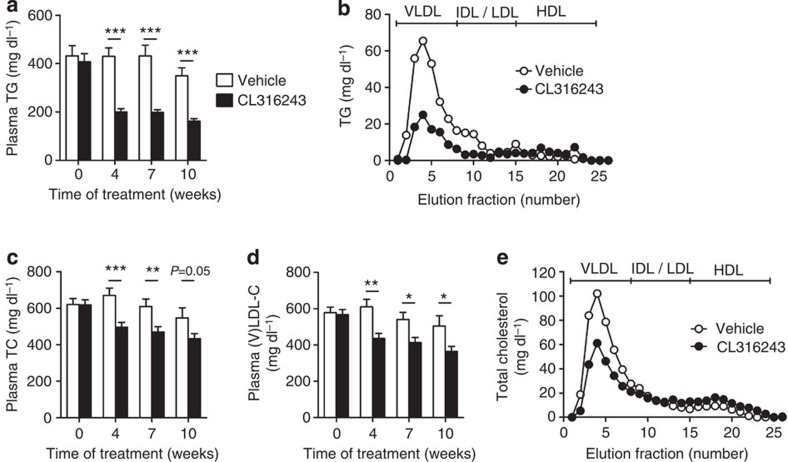
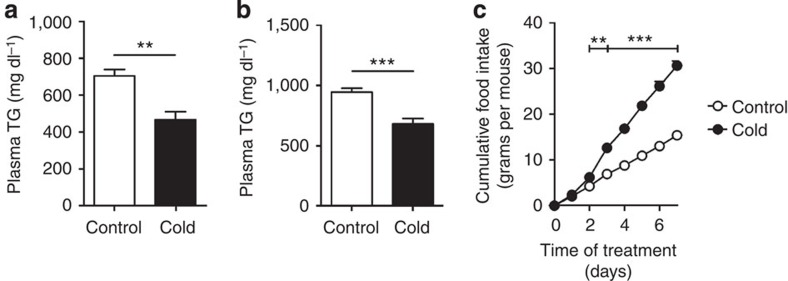
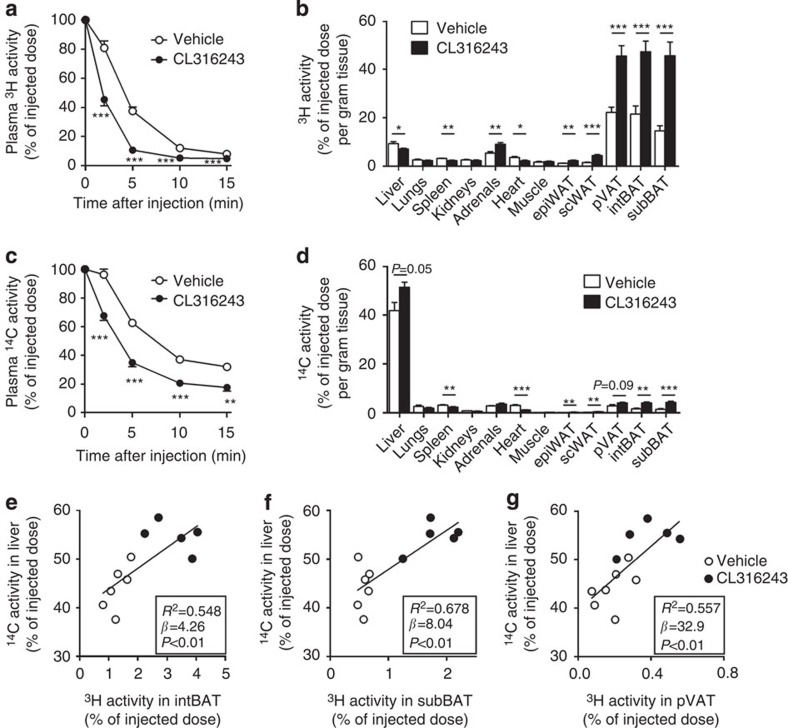
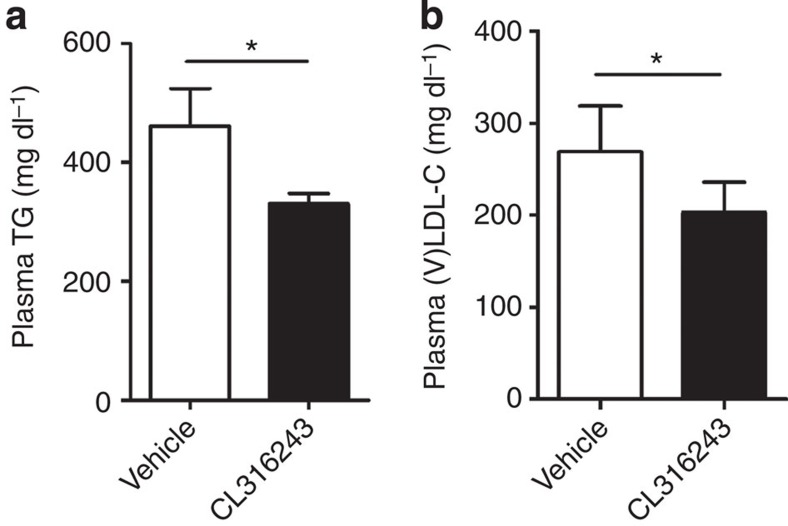
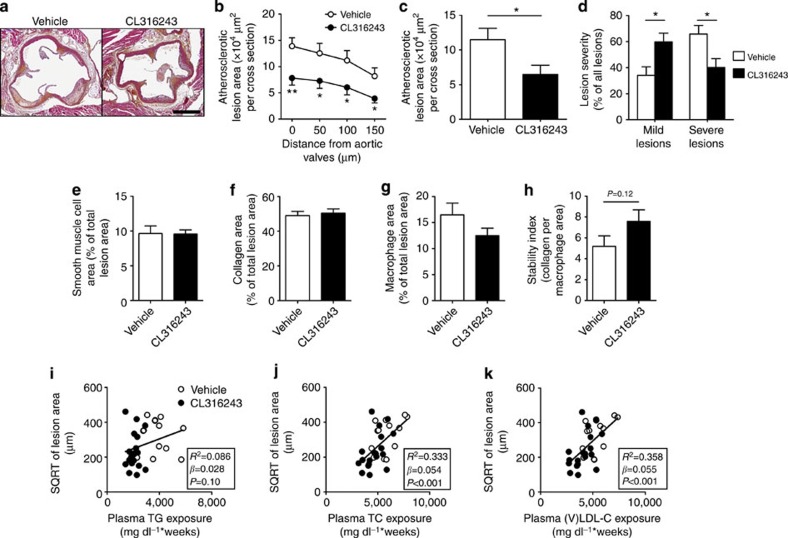
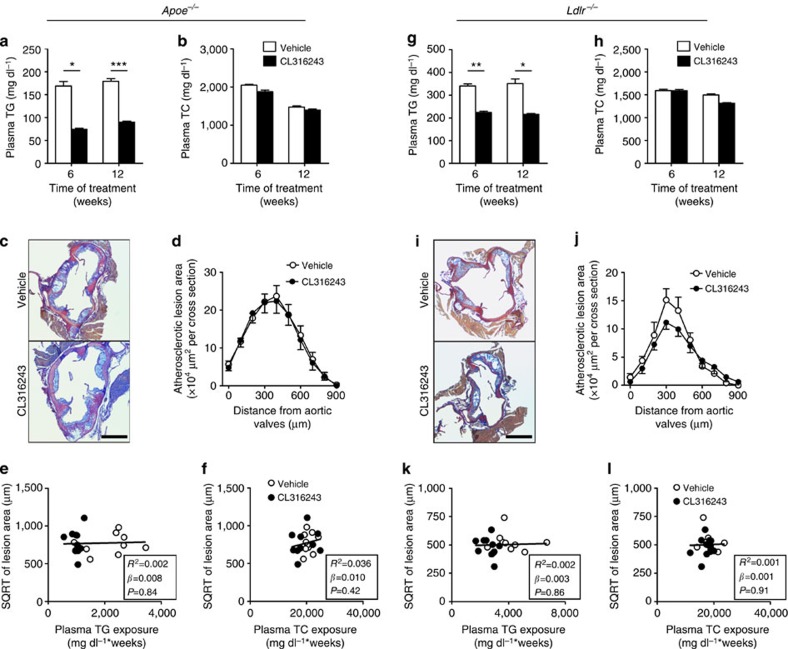
Brown adipose tissue (BAT) combusts high amounts of fatty acids, thereby lowering plasma triglyceride levels and reducing obesity. However, the precise role of BAT in plasma cholesterol metabolism and atherosclerosis development remains unclear. Here we show that BAT activation by β3-adrenergic receptor stimulation protects from atherosclerosis in hyperlipidemic APOE*3-Leiden.CETP mice, a well-established model for human-like lipoprotein metabolism that unlike hyperlipidemic Apoe(-/-) and Ldlr(-/-) mice expresses functional apoE and LDLR. BAT activation increases energy expenditure and decreases plasma triglyceride and cholesterol levels. Mechanistically, we demonstrate that BAT activation enhances the selective uptake of fatty acids from triglyceride-rich lipoproteins into BAT, subsequently accelerating the hepatic clearance of the cholesterol-enriched remnants. These effects depend on a functional hepatic apoE-LDLR clearance pathway as BAT activation in Apoe(-/-) and Ldlr(-/-) mice does not attenuate hypercholesterolaemia and atherosclerosis. We conclude that activation of BAT is a powerful therapeutic avenue to ameliorate hyperlipidaemia and protect from atherosclerosis.


Figures

Figure 1
Figure 1. β3-AR agonism reduces body fat mass in E3L.CETP mice.
(a) Body weight, (b) gain of total body fat mass, (c) lean mass and (d) cumulative food intake were determined in WTD-fed E3L.CETP mice at the indicated time points during treatment with the β3-AR agonist CL316243 or vehicle. (e) After necropsy at week 10, the weight of various organs was determined. (f) Epididymal WAT (epiWAT) was stained with haematoxylin–eosin (HE) and representative pictures are shown. Scale bar, 100 μm. (g) Lipid droplet size of white adipocytes was quantified. visWAT, visceral WAT; scWAT, subcutaneous WAT; intBAT, interscapular brown adipose tissue; subBAT, subscapular BAT; pVAT, perivascular adipose tissue. Values are means±s.e.m. (ae: n=13–19 per group; f,g: n=8 per group). *P<0.05, **P<0.01, ***P<0.001 (unpaired two-tailed Student’s t-test).
Figure 2
Figure 2. β3-AR agonism increases EE in E3L.CETP mice.
(a) Mice were housed in fully automated metabolic cages and EE was determined and corrected for lean body mass. (b) Physical activity was monitored. In addition, (c) fat oxidation and (d) carbohydrate oxidation were determined and corrected for lean body mass. (e) Respiratory exchange ratio was determined. Data are shown as the first 12 h directly after the injection with CL316243 or vehicle (‘Day of treatment’) and the same 12-h period 24 h later (‘Day after treatment’). Values are means±s.e.m. (n=13–19 per group). ***P<0.001 (unpaired two-tailed Student’s t-test).
Figure 3
Figure 3. β3-AR agonism activates BAT and increases browning of WAT in E3L.CETP mice.
Slides of intBAT of β3-AR agonist CL316243- and vehicle-treated E3L.CETP mice were (a) stained with haematoxylin–eosin (HE) or (c) immunohistochemically stained for UCP1, and representative pictures are shown. Scale bar, 200 μm (for × 15 original magnification) and 20 μm (for × 100 original magnification). (b) Lipid droplet-positive area, (d) UCP1 content per area and (e) UCP1 content of the total fat pad were quantified. Slides of epidydimal WAT (epiWAT) were stained with (f) HE and (g) immunohistochemically stained for UCP1, and representative pictures are shown. Scale bar, 100 μm. Values are means±s.e.m. (n=8 per group). *P<0.05, **P<0.01 (unpaired two-tailed Student’s t-test).
Figure 4
Figure 4. β3-AR agonism ameliorates dyslipidemia in E3L.CETP mice.
Fasting plasma (a) TG, (c) TC and (d) VLDL-C were measured in WTD-fed E3L.CETP at the indicated time points during treatment with the β3-AR agonist CL316243 or vehicle. The distribution of (b) TG and (e) TC over lipoproteins was determined after 10 weeks of treatment on pooled plasma samples per group. Values are means±s.e.m. (n=13–19 per group or pool). *P<0.05, **P<0.01, ***P<0.001 (unpaired two-tailed Student’s t-test).
Figure 5
Figure 5. Cold exposure decreases dyslipidemia in E3L.CETP mice.
E3L.CETP mice were fed a WTD and exposed to cold or control temperature for 7 days. Fasted plasma (a) TG and (b) TC were determined at the end of treatment. (c) Mice were individually housed and cumulative food intake was determined during treatment. Values are means±s.e.m. (n=8 per group). **P<0.01, ***P<0.001 (unpaired two-tailed Student’s t-test).
Figure 6
Figure 6. β3-AR agonism increases lipolytic processing and hepatic clearance of lipoproteins in E3L.CETP mice.
β3-AR agonist CL316243- and vehicle-treated mice were injected with VLDL-like particles, double-labelled with glycerol [3H]TO and [14C]CO, and (a,c) clearance from plasma as well as (b,d) uptake by organs and tissues at 15 min after injection were determined for (a,b) 3H-activity and (c,d) 14C-activity. The hepatic uptake of 14C activity was plotted against the uptake of [3H]TO-derived activity in (e) interscapular brown adipose tissue (intBAT), (f) subscapular BAT (subBAT) and (g) perivascular adipose tissue (pVAT). Linear regression analyses were performed. Values are means±s.e.m. (n=5–7 per group). *P<0.05, **P<0.01, ***P<0.001 (unpaired two-tailed Student’s t-test).
Figure 7
Figure 7. β3-AR agonism reduces dyslipidemia in E3L mice in the absence of CETP.
E3L mice were fed a WTD and treated with vehicle or the β3-AR agonist CL316243. Fasted plasma (a) TG and (b) (V)LDL-C were determined. Values are means±s.e.m. (n=5–7 per group). *P<0.05 (unpaired two-tailed Student’s t-test).
Figure 8
Figure 8. BAT activation reduces atherosclerosis by improving the plasma cholesterol profile.
(a) Slides of the valve area of the aortic root of β3-AR agonist CL316243- and vehicle-treated E3L.CETP mice were stained with haematoxylin–phloxine–saffron and representative pictures are shown. Scale bar, 400 μm. (b) Lesion area as a function of distance was determined per mouse, starting from the appearance of open aortic valve leaflets covering 150 μm. (c) The mean atherosclerotic lesion area was determined from the four cross-sections from b and (d) lesions were categorized according to lesion severity. (e) The smooth muscle cell, (f) collagen and (g) macrophage content of the lesions were determined, and (h) the stability index (collagen/macrophage content of the lesions) was calculated. The SQRT of the atherosclerotic lesion area from b was plotted against the plasma (i) total TG, (j) TC and (k) (V)LDL-C exposure during the 10-week treatment period. Linear regression analyses were performed. Values are means±s.e.m. (n=13–19 per group). *P<0.05, **P<0.01 (bh: unpaired two-tailed Student’s t-test).
Figure 9
Figure 9. BAT activation in Apoe−/− and Ldlr−/− mice reduces plasma TG, but not TC nor atherosclerosis.
Fasting plasma (a) TG and (b) TC levels were measured in WTD-fed Apoe−/− mice at the indicated time points during treatment with the β3-AR agonist CL316243 or vehicle. (c) Slides of the valve area of the aortic root of CL316243- or vehicle-treated Apoe−/− mice were stained with modified Van Gieson stain and representative pictures are shown. Scale bar, 400 μm. (d) Lesion area as a function of distance was determined per mouse starting from the appearance of open aortic valve leaflets covering 900 μm. The SQRT of the atherosclerotic lesion area from d in Apoe−/− mice was plotted against the plasma (e) total TG and (f) TC exposure during the 12-week treatment period. Linear regression analyses were performed. Fasting plasma (g) TG and (h) TC levels were measured in WTD-fed Ldlr−/− mice at the indicated time points during treatment with the β3-AR agonist CL316243 or vehicle. (i) Slides of the valve area of the aortic root of CL316243- or vehicle-treated Ldlr−/− mice were stained with modified Van Gieson stain and representative pictures are shown. Scale bar, 400 μm. (j) Lesion area as a function of distance was determined per mouse starting from the appearance of open aortic valve leaflets covering 900 μm. The SQRT of the atherosclerotic lesion area from j in Ldlr−/− mice was plotted against the plasma (k) total TG and (l) TC exposure during the 12-week treatment period. Linear regression analyses were performed. Values are means±s.e.m. (n=8–11 per group or pool). *P<0.05, **P<0.01, ***P<0.001 (a,b,d,g,h,j: unpaired two-tailed Student’s t-test).

Comment in

References

    1. Jukema J. W., Cannon C. P., de Craen A. J., Westendorp R. G. & Trompet S. The controversies of statin therapy: weighing the evidence. J. Am. Coll. Cardiol. 60, 875–881 (2012) . - PubMed
    1. Hany T. F. et al.. Brown adipose tissue: a factor to consider in symmetrical tracer uptake in the neck and upper chest region. Eur. J. Nucl. Med. Mol. Imaging 29, 1393–1398 (2002) . - PubMed
    1. Nedergaard J., Bengtsson T. & Cannon B. Unexpected evidence for active brown adipose tissue in adult humans. Am. J. Physiol. Endocrinol. Metab. 293, E444–E452 (2007) . - PubMed
    1. van Marken Lichtenbelt W. D. et al.. Cold-activated brown adipose tissue in healthy men. New Engl. J. Med. 360, 1500–1508 (2009) . - PubMed
    1. Virtanen K. A. et al.. Functional brown adipose tissue in healthy adults. New Engl. J. Med. 360, 1518–1525 (2009) . - PubMed

Publication types